It is also necessary to guarantee that the increasing number of SRDs operating in the adjacent Long Term Evolution (LTE) band does not degrade its performance, and vice versa. NCSM A number of CSMA sensors in the network NDC Number of DC sensors in the network Nmax Maximum number of sensors in a network.
Context and Motivation
Asynchronous channel access schemes are particularly relevant in the SRD landscape mainly due to the simplicity of the devices (e.g. sensors, remote controllers). In particular, the effects of the hidden node effect on the CSMA performance can be observed.
Main Contributions
The unlicensed frequency band used for all analyzes in this work is 863-870 MHz. The LTE sub-band that is closest to this band is the one used for User Equipment (UE) uplink.
Thesis Outline
The impact of the Long Term Evolution (LTE) frequency spread in the SRD is also evaluated; the results are presented as a minimum distance between the LTE interference and SRDs to avoid collisions. The goal is to determine whether the UE needs to be located far away from the sensors or whether they can both operate in the same physical space.
Introduction
In this chapter, the main random channel access techniques are introduced along with some analytical evaluations of their performance.
Duty Cycle (DC)
ALOHA
In the case of ALOHA, the probability of collision can be derived from the analysis under which conditions two packets would collide. Modeling the packet arrival rate as a normalized Poisson distribution of mean G, the probability of arrival of k packets during a packet duration, P(k), follows.
![Figure 2.2: Vulnerable period in Pure ALOHA [5].](https://thumb-eu.123doks.com/thumbv2/123dok_br/19768764.0/30.892.277.624.96.342/figure-2-2-vulnerable-period-in-pure-aloha.webp)
CSMA
This means that if two or more devices wait for the channel to become free, they will inevitably interfere, resulting in the worst performance for a CSMA protocol. A slotted version of CSMA addresses this problem by giving the devices a probability of transmitting in the next slot after the channel becomes free, which is known as p-persistent CSMA.
Introduction
Spectrum allocation for SRDs in the EU is based on the ECC recommendation, which also provides a global overview of the implementation status of the proposed frequency bands among all 48 CEPT member countries. Not only is the existing spectrum expected to become insufficient in the near future, but new applications and use cases are also appearing on the market for which the current rules (e.g. maximum direct current and transmitted power) are too restrictive – and thus attract benefit from the creation of new subbands with more appropriate requirements.
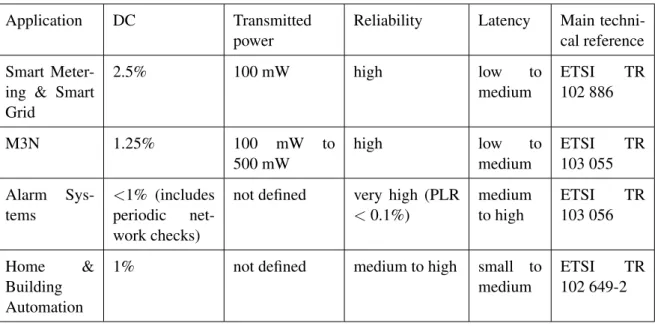
![Figure 3.1: Requirements of different IoT applications [9].](https://thumb-eu.123doks.com/thumbv2/123dok_br/19768764.0/34.892.151.746.111.416/figure-3-1-requirements-of-different-iot-applications.webp)
UHF Bands Allocated to SRDs
This recommendation divides SRD applications into 13 categories listed in Table 3.1 and recommends frequency band and channel access rules for each of them - all current SRD applications on the market must fall into one of these categories and follow the applicable rules accordingly. As the number of sensors is expected to increase significantly in the future, the demand for unlicensed spectrum will also increase. There is a general concern in the industry about the ability of SRD bands to adapt their solutions with the required quality of service in the future, and therefore there is a strong pressure to expand the SRD spectrum [14].
AFA is a technique that automatically causes the transmitter to change frequency when it detects activity in the current one. These mitigation techniques enable an increase in the efficient use of radio resources by allowing additional devices to opportunistically access the channel when it is free. The benefits of international spectrum harmonization are significant: not only would it allow for economies of scale in manufacturing SRDs, but it would also be highly beneficial for certain types of applications – the best example being RFID, as RFID-tagged goods can travel around the world.
![Figure 3.2: SRD band allocations in the 863-870 MHz band, according to Recommendation 70-03 [13].](https://thumb-eu.123doks.com/thumbv2/123dok_br/19768764.0/37.892.136.756.106.561/figure-srd-band-allocations-mhz-band-according-recommendation.webp)
SRD Applications with Highest Expected Growth
In addition to the obvious operational efficiencies that energy distributors gain from recording the meter value (which is usually done manually these days), these solutions are also in demand from end users as they allow them to monitor their consumption – an increasing concern about efficiency of resource use for environmental and economic reasons drives the need for smarter consumption monitoring solutions [17]. In terms of data traffic, alarm systems are said to be event-driven, meaning that it is an external event that causes a spike in the amount of data generated. While in previous years these devices would be used in a standalone manner (i.e. individually controlled), new smart home systems integrate them into one intelligent system that coordinates the sensors and actuators in the network.
As smart and automated homes become a market trend, the demand for such solutions will increase significantly in the next decade. Finally, the impetus for the expansion of the RFID sub-band to a 915-921 MHz sub-band lies mainly in the almost worldwide harmonization of this band for RFID systems, simplifying, for example, the logistics of goods traded across countries. Note that in the case of the other SRD applications presented in this section, the need for more bandwidth is driven by system performance.
The Monte Carlo Method
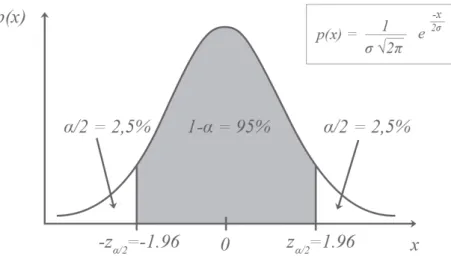
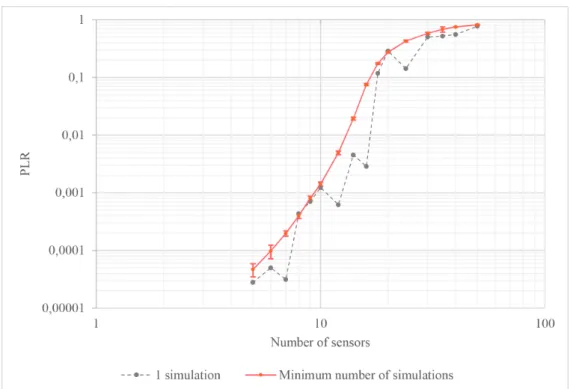
Given the complexity of radio access schemes and the wide variety of parameters they depend on, analytical analysis is either very limited due to a number of necessary simplifications or not feasible at all. The higher the number of samples (ie, the higher the number of simulation runs), the smaller the confidence intervals, which translates into a higher accuracy of the solution. This is a bit of a chicken-egg problem, since in order to obtain the number of simulations, you already need to know µ and σ.
First, an arbitrarily large number of Monte Carlo simulations are used for each value of the number of sensors in network 1. After the simulations are run, the resulting µandσ values for each number of simulations,S, are used to calculate the minimum number of simulations. necessary,Qmin, using equation (4.3). If Qmini is greater than the number of simulations run, the program is run again – this time for Qmin simulations;
Simulation Scenarios
At the beginning of each simulation, sensors are randomly placed within the defined area of the building. The values for interference and path loss for all possible node pairs are calculated once at initialization so that they are used throughout the simulation (eliminating the need to calculate them multiple times). One of the factors to consider when calculating the range of a node is the sensitivity of the receiver, Pdet, which is the minimum signal strength it can detect.
In turn, the thermal noise power,n0,depends on the temperature and the bandwidth of the receiver. In addition to the assumptions and scenarios already mentioned, some additional and more general simplifications were made whenever behavior fell outside the scope of this work. In reality, under certain circumstances, distorted frames can be recovered – in whole or in part – at the receiver.

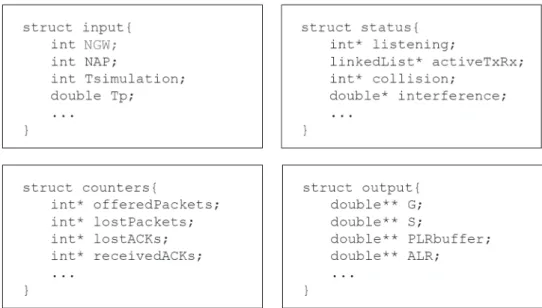
Simulator Implementation
CSMA
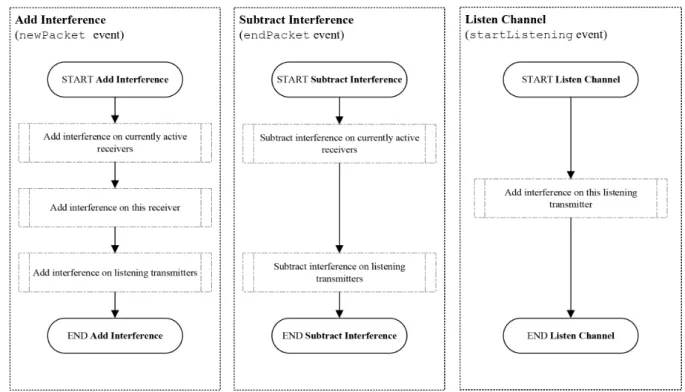
Within these functions, the two types of packets are distinguished, but some functions are common to both, as both refer to the transmission of data. In addition to these common blocks, the specific functions of each event are also located in the same place in the structure, as in the case of DC. In thestartListenevent (in Figure 4.15), after checking for a new cycle and an outdated packet, the function continues by incrementing the delivered packets counter, updating the status, listening to the channel, and scheduling the last event.
Following the above structure for initiation events, evenewPacket (represented in Figure 4.17) checks the events for the "outdated" packet and the new cycle, adding the following interference and updating the status information. Data and ACK packets are counted as different events, but are executed in the same function due to their common nature (both emulate a radio transmission). Again, similar to other end events, endPacket (Figure 4.18 and Figure 4.19) starts with packet ID checking, status update, and new cycle verification, followed by data packet-specific functions and ACK.

Monte Carlo Method Demonstration
First, the results from the reference scenario are presented, and a comparison is made with results from the literature, to validate the correct functioning of the simulator. Subsequently, several results are presented for the building scenario, where the effect of varying certain parameters is investigated and the adequacy of the different channel access schemes is assessed in an office environment.
Results for the Reference Scenario
CSMA
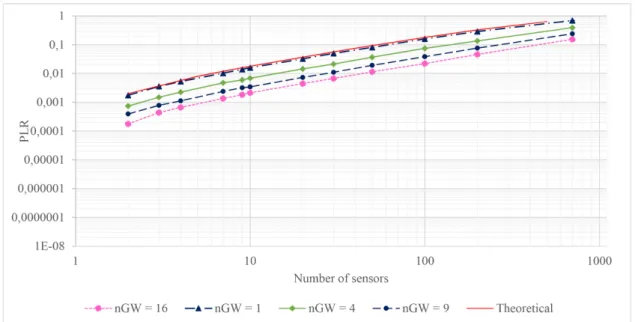
The results of the CSMA simulations for the reference scenario can be compared with those of [27]. It can be observed that the simulation results closely match the theoretical ones. The results, which can be observed in Figure 5.4, show a close match for the Tp = 20ms simulation, but not for the other one.
However, a new simulation was performed with different Trep and Ttimeoutrep values, for the following reason: in [3] the two values given to these parameters. 1Note that all variables that refer to an interval correspond to the maximum value of the interval. Assuming this could have happened, the indicated average values of TrepandTtimeoutrep would actually be the maximum values of the intervals.
![Figure 5.2: Comparison between simulated and theoretical DC PLR results [3].](https://thumb-eu.123doks.com/thumbv2/123dok_br/19768764.0/75.892.198.691.100.448/figure-5-comparison-simulated-theoretical-dc-plr-results.webp)
Results for the Real Scenario
CSMA
Furthermore, the effect of false negatives for Pt=−20dBm is also clear, as collisions increase the number of retransmissions. In Figure 5.12, the PLR of the CSMA system can be observed as a function of the number of interfering DC sensors, NDC. It can be concluded that the presence of the DC system does not significantly impair the CSMA PLR.
On the other hand, the DC system suffers significantly due to the presence of the CSMA system. In Figure 5.16, the PLR of the DC system increases significantly with each added CSMA sensor. This analysis, on the other hand, was performed by determining the maximum distance between the sensor and the gateway, dmax, as a function of the distance between the UE and the victim (sensor/gateway), dU E, in order for the UE not to cause collisions (by itself ) in the information received at this node.
Having said that, the limit for the inclusion of the UE in the inclusion area corresponds to dU E = dmax, which, from (5.6), results in Pt ≈ -13 dBm. Note that the emission limit values correspond to the measurement bandwidth in the last column of the table.