67 Table D.1: log(BERav) and EVMav of each band of the MB-OFDM signal for the three MP of Table 3.6 when six bands are transmitted. 96 Table D.3: log(BERav) and EVMav of each band of the MB-OFDM signal for the three MP of Table 3.6 when three bands are transmitted.
Introduction
- Scope of the work
- Optical communication systems
- Optical metropolitan networks
- Motivation and objectives of the dissertation
- Structure of the dissertation
- Main original contributions
Study and characterization of MB-OFDM system in metro networks using EAM including MB-OFDM signal. Evaluation of the minimum OSNR required to achieve a BER of 4×10⁻³ in a 112 Gb/s SSB MB-OFDM system using the EAM and DPostD algorithm to mitigate the SSBI term;

General principles of MB-OFDM system employing DD and EAMs
Fundamentals of OFDM
- Mathematical representation of OFDM signals
- Modulation and demodulation of the OFDM signal
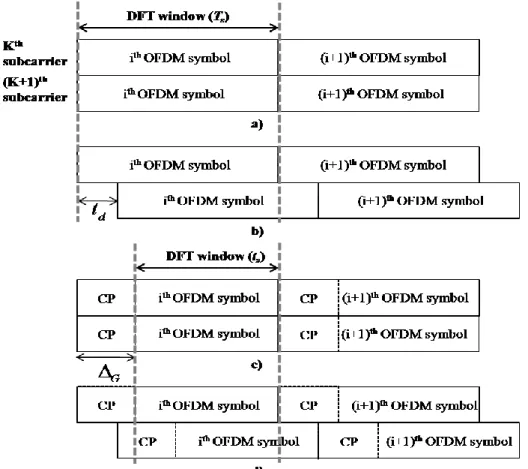
- Cyclic prefix
- Spectral efficiency of the OFDM signal
- Transmitter and receiver of an OFDM system
- Drawbacks of OFDM
The spectral efficiency of a signal is the ratio between the bit rate and the bandwidth of the signal. The ratio between the peak power and the average power of the signal is the PAPR.
OFDM system employing direct-detection
- Offset SSB-OFDM
- RF tone-assisted OFDM
- Iterative detection technique
- Beat interference cancellation receiver
The following approaches have been suggested to reduce the SSBI effect on signal performance. In this way, after the photodetector, the SSBI will fall into the gap that does not interfere with the signal and can be easily removed with an RF filter. The iterative technique consists of the following steps: first, the signal is processed with SSBI, and a primary reconstruction of SSBI is performed.
Signal quality strongly depends on the degree of SSBI removal, so high selective filters are required.

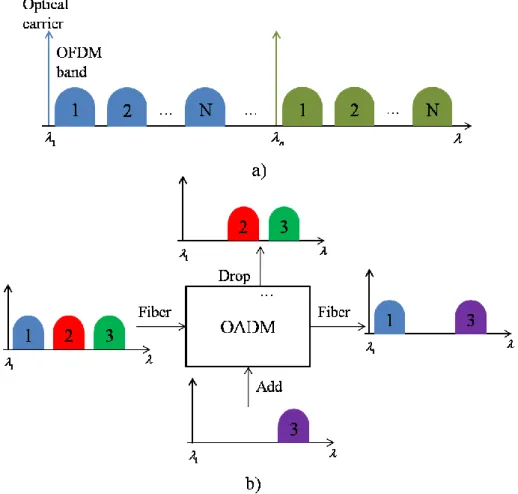
MB-OFDM concept
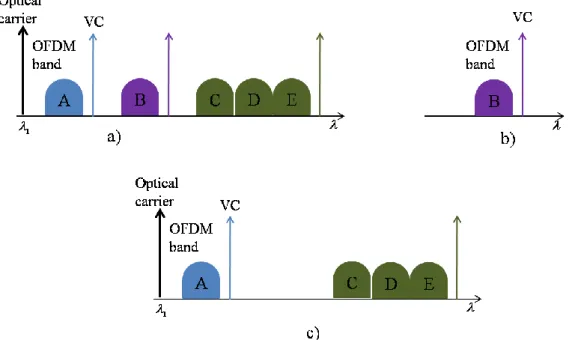
- MB-OFDM signal with virtual carriers
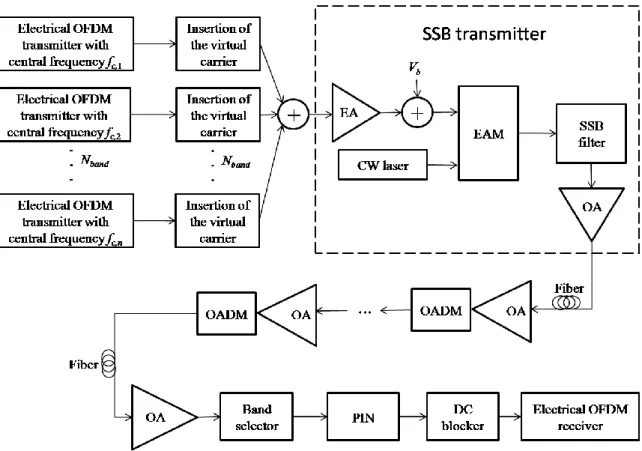
- MB-OFDM system archictecture
- MB-OFDM signal parameters
Each node of the metro ring must be able to insert, extract and pass a band of the MB-OFDM signal. Following this, a brief explanation of the OADM proposed in the MORFEUS project is presented. The first half of the signal goes to an OR where the desired OFDM band is extracted.
Finally, the bandwidth of the MB-OFDM signal, at the fiber input, is given by
Optical modulation
- Analysis of the system performance when an EAM is employed
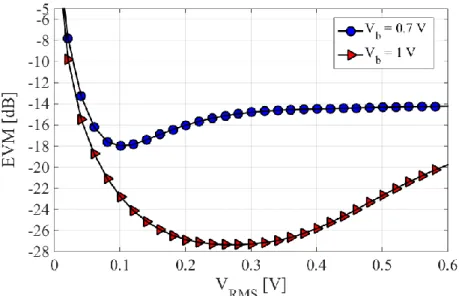
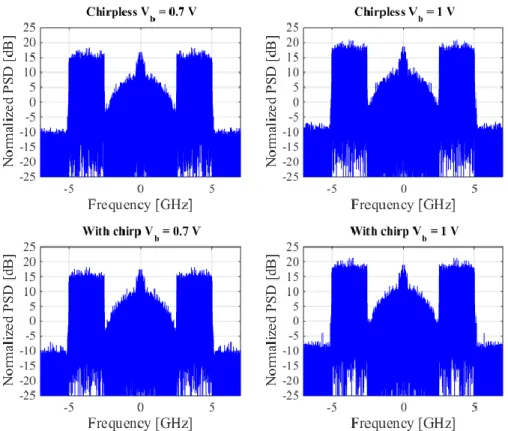
The phase of the electric field is obtained from the chirp parameter and the optical output power. System performance as a function of RMS voltage for 1 and 0.7 V bias was analyzed to select the most suitable bias. 30 Until now, all analyzes of EAM properties on system performance have been presented for a signal consisting of only one OFDM band.
The RMS voltage of the signal at the EAM input is 0.1 V and the bias voltage is set to 1 V.

MB-OFDM system at 112 Gb/s
Taking into account Dλ=17 ps/nm/km and Lf=400 km, which is an adequate value since the maximum connection length of a metro network is between 200 and 300 km, the monitoring interval should be minimum. The frequencies of the virtual carriers and the bands are calculated by using the equations in Eq. to recombine. The other parameters needed to characterize the system, such as the VBPR, are analyzed in Chapter 3 to achieve the best system performance.
Conclusions
Distortion compensation with MP in a single band transmission
Digital post-distortion using memory polynomials
- Memory polynomials
- Digital post-distortion
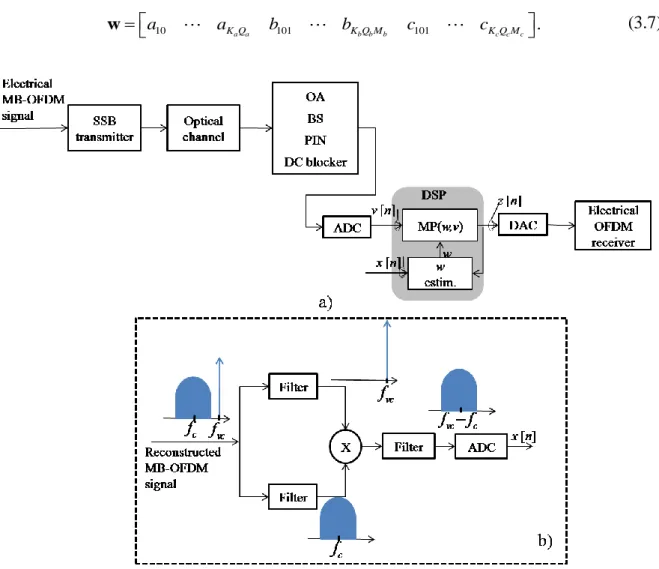
In this way, the total number of coefficients is the summation of the coefficients of: i) the adjusted signal (akq). Affects the reconstructed transmitted signal with the inverse of the gain G, given by. where <∙> stands for the average. The MP coefficients must be updated because the parameters of the system may vary with time.
Then the signals of both branches are multiplied and the result goes through another filter which.
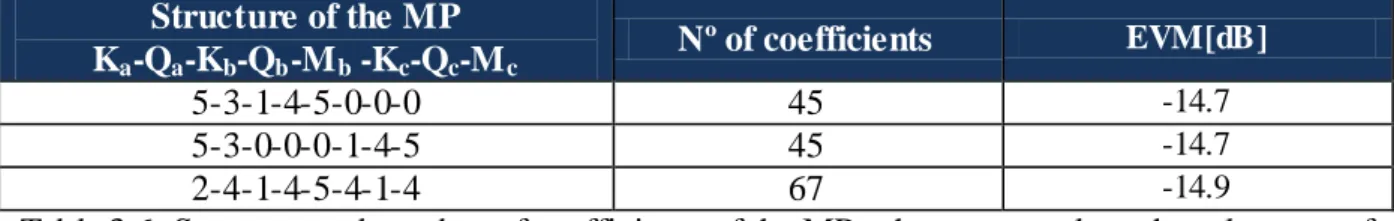
Searching for the MP structures more suitable for the system
- MP comprising only the coefficients for the aligned signal
- MP comprising the coefficients for the aligned signal and lagging terms
- MP comprising the coefficients for the aligned signal and leading terms
- Complete MP
For example, comparing the first and last MP from Table 3.3 concludes that the latter has better system performance than the former. From Table 3.3 it can be concluded that the order of the MP should be 5, since the order of all MPs is 5. Another conclusion drawn from this test, but not shown in the results of Table 3.3, is that the system performance improvement stops at Kb=4, again leading to an MP of order 5.
From Table 3.5, it was concluded that there is no benefit in using all MP coefficients when considering a system under these conditions.

Relevance of each one of the MP coefficient
It can be seen from the signal spectrum that the SSBI term is not attenuated. It can be seen that the spectrum of the OFDM signal is highly distorted leading to a degradation of the system performance. It can be seen that the symbols can be recovered with fewer errors than in the case where the third position of the vector w is zero.
It was demonstrated that a coefficient can be neglected for the calculation of the nth sample of the output signal.
Performance of the DPostD algorithm when different symbols are transmitted
49 Since the EVM may differ for different sets of symbols, as shown in Figure 3.5, the average EVM should be used to evaluate system performance. To calculate the average EVM, one needs to know how many iterations need to be performed to get a good estimate of the average EVM. Although some fluctuations can be observed when the number of iterations is above 120, the difference between the average EVM is a residual.

Tolerance of the SSBI mitigation to system parameters variation
When the SSBI is completely outside the OFDM band (VBG = 2.5 GHz), system performance is almost constant. The performance of the system will depend on the BS passband bandwidth and its center frequency. 3.13 shows that for a BS bandwidth higher than the bandwidth of the OFDM band (2.50 GHz), the EVM does not vary much.
In this way the impact of the filter on an optical fiber transmission can be studied.

Conclusions
In section 3.3 it was shown that the same MP structure does not result in the same system performance symbols being sent. This means that the coefficients must be updated for each data information transmitted and the average EVM must be used to evaluate the system performance. It was concluded that the relaxation constant that leads to the smaller difference in system performance when different symbols are sent is 0.02.
It was also shown that the system only requires 40 OFDM training symbols to correctly estimate the MP coefficients, which reduces the complexity of the system.
MB-OFDM system with DPostD based on MP
- MB-OFDM system employing one EAM
- MB-OFDM system employing four EAMs
- Required OSNR and maximum transmission distance
- Conclusions
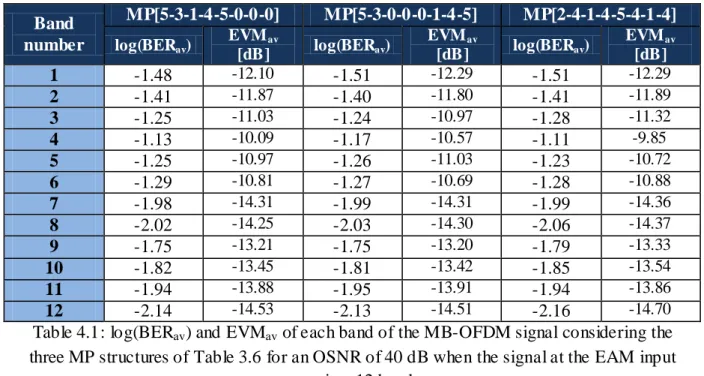
60 Moreover, from Table 4.2, it can be seen that even if the system noise is neglected, the desired BER cannot be achieved. The results shown are for the first band of the 12-band MB-OFDM signal, as it is the worst performing one. First, it can be concluded that the required OSNR of the system is about 20.5 dB.
However, the required OSNR of the system is 40.5 dB set by band 9 at 50 km fiber length.
Conclusion and future work
Final conclusions
In order to study the best values for the system parameters, the tolerance of the system to the variation of the parameters was evaluated. The influence of fiber dispersion was evaluated and it was concluded that the MP that considers all coefficients is more stable to fiber dispersion. It was demonstrated that to achieve maximum BER, the signal at the EAM input cannot contain 12 bands.
It has been shown that the required OSNR for a 12-band MB-OFDM signal is 20 dB higher than that required for single-band transmission.
Future work
Lee, “Spectral efficiencies of ultra-dense bidirectional and unidirectional channel interleaved WDM for metro applications,” IEEE/OSA J. Lee, “Spectral efficiencies of bidirectional and unidirectional channel interleaved WDM for metro applications,” IEEE/OSA J . Armstrong, “ Experimental Demonstrations of Electronic Dispersion Compensation for Long Distance Transmission Using Direct Detection Optical OFDM ,” IEEE/OSA J .
Chi, “Theoretical and Experimental Investigations of Directly Detected RF-to-Assisted Optical OFDM Systems,” IEEE/OSA J .
Up- and down-conversion
Now assuming that the modulator is directly connected to the PIN, the optical field at the MZM output is equal to the optical field incident on the PIN. This equation is for a DSB signal, when we use an SSB signal, we can only recover the terms in frequency fvc fRF. As explained in Section 2.4, there is no simple expression to describe EAM, but the conclusion made using MZM is still valid.
Equalizer
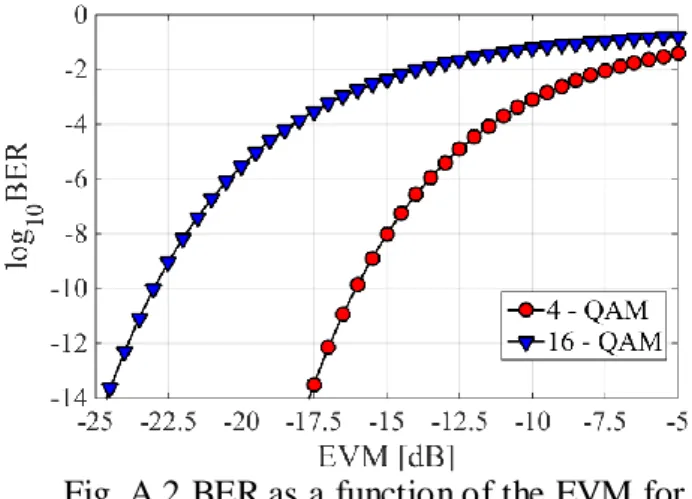
Error vector magnitude
Bit error ratio
If all subcarriers have similar bit rate, the BER of an OFDM band can be evaluated as For a simulation where the distortion cannot be neglected, the BER is typically evaluated by direct error counting (DEC). The EGA method assumes that the BER of the in-phase and quadrature components of an OFDM subcarrier at the receiver is described by a Gaussian distribution, so that the BER of each component of the subcarrier can be evaluated from the subcarrier's mean and standard deviation values.
It was concluded that the number of noise runs needed to obtain an accurate estimate of the BER is 50.
Thermal noise
To overcome the limitations of the EVM and DEC methods, the EGA method was proposed in [63] for systems using quadrature and cross-QAM modulation, and it was shown that the EGA method presents BER values similar to those obtained by DEC in the useful time. These values are calculated from a set of different noise sets, so the number of noise sets must be estimated to obtain an accurate BER.
Optical fiber
Optical noise
If we assume that the OFDM signal moves in parallel direction and the noise moves in both directions, the optical field at the OA output can be written as. Since the OA is connected directly to the PIN, the power to the PIN output is given by.
Voltage limitation for the EAM
So it can be concluded that the better performance of the single-ended signal at 1 V is due to the difference in optical power. The rest must be caused by the combined effect of the chirp and the distortion caused by the modulator. B.3, it can be seen that the difference between the distortion and the signal is lower for the bias voltage of 0.7 V, which means that the SNR is also lower, leading to a worse performance compared to the of bias of 1 V.
EAM parameter 89 is considered, but now the same difference is only 3 dB, as observed in Fig.
Test of the coefficients importance
MP performance for different set of symbols
C.6, it can be concluded that the set of symbols leading to a poorer system performance is far. Comparing the three MPs, we see that if a set of symbols leads to a poorer system performance when using the MP, the same happens for the other two MPs. It can also be seen that the ratio constant of 0.02 leads to a better system performance than when μ = 0.5, as concluded in section 3.4.
If we now observe the evolution of the coefficients along the iterations, it turns out that for μ = 0.5 the value of the coefficient varies more than for μ = 0.02.
![Fig. C.4 a) EVM as a function of the iteration for μ = 0.02 and 0.5 for the MP[5-3-1-4-5-0-0-0] and the evolution of the coefficients for b) μ = 0.02 and](https://thumb-eu.123doks.com/thumbv2/123dok_br/19768128.0/118.893.171.729.410.863/fig-c-evm-function-iteration-mp-evolution-coefficients.webp)
Required OSNR
95 seen that the required OSNR is still imposed by the 50 km transmission distance and that band 12 is no longer the one with the best performance. So if fewer bands are used by the EAM, the optical signal will present less distortion. In the following, the maximum number of bands that can be used simultaneously by an EAM to achieve the required BER is evaluated.
97 Table D.3: log(BERav) and EVMav for each band of the MB-OFDM signal for the three MP af.
![Fig. C.8 Required OSNR for the 12 bands of the MB-OFDM signal when an ideal rectangular filter is used as a BS considering the MP[5-3-1-4-5-0-0-0] and different](https://thumb-eu.123doks.com/thumbv2/123dok_br/19768128.0/121.893.158.691.178.434/required-osnr-bands-signal-rectangular-filter-considering-different.webp)