Tanto o modelo como a respectiva análise de sensibilidade são verificados com uma ferramenta de projeto de asa e o método de diferenças finitas, respectivamente. Palavras-chave: métodos de gradiente, projeto aerodinâmico, análise de sensibilidade, método de painel, diferenciação automática, método adjunto.
Nomenclature
Glossary
LP Linear programming is a class of optimization problems where all functions (objective and constraints) are linear. Nonlinear NLP programming is a type of optimization problem where the objective and constraints are nonlinear functions.
Introduction
- Motivation
- Multidisciplinary Design and Optimization
- Framework and Objectives
- Thesis Outline
This situation corresponds, as suggested by Figure 1.5 (b), to travel in perpendicular directions, changing the design variables related to the "active" discipline in each iteration of the optimization. The direction of travel in Figure 1.5 (b) is such that it produces changes in all design variables simultaneously.

Optimization Methods
- Definitions
- Classification
- Gradient Based Methods
- Unconstrained Gradient Based Methods
- Constrained Gradient Based Methods
- Heuristic and Gradient Free Methods
- Method Selection
This method uses the symmetry of the gradient vector at each iteration k for the search direction. The detailed methodology is presented in Algorithm 2. The reduced gradient method was first introduced by Wolfe [26].
![Figure 2.1: Classification of optimization methods [10]](https://thumb-eu.123doks.com/thumbv2/123dok_br/19767793.0/34.892.198.694.621.992/figure-2-1-classification-of-optimization-methods-10.webp)
Sensitivity Analysis Methods
- Symbolic Differentiation
- Finite-Differences Method
- Complex-Step Derivative
- Semi-Analytical Methods
- Direct Method
- Adjoint Method
- Automatic Differentiation
- Usage of Methods
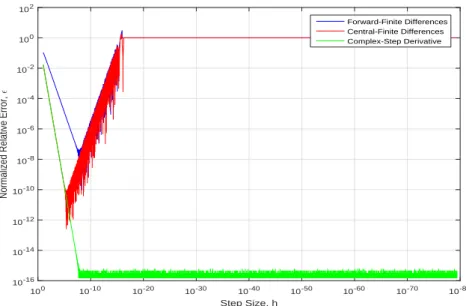
The formulas in Equation (3.2) and Equation (3.3) are the forward finite difference (FFD) and backward finite difference, respectively. The formula presented in Equation (3.6) is second-order accurate, since the truncation error depends quadratically on the step size. Since the matrix product is associative, there are two ways to solve Equation (3.15): the adjoint and the direct method.
It should be noted that solving equation (3.14) corresponds to solvent linear systems of equations, one for each column. If we consider the product of the first two matrices after the minus sign in equation (3.15) and assign to it the adjoint matrix as suggested in the parentheses, we get the result. 3.17) where [ψ] is an adjoint matrix with dimensions k×m.
Aerodynamic Model and Framework
- Fundamental Equations in Incompressible Flows
- Potential Flow Model
- Laplace Equation
- Elementary Solutions
- Panel Method
- Aerodynamic Framework Description
- Wing Parametrization
- Panels Definition
- Change of Basis
- Aerodynamic Solver
- Post-Processing
- Code Verification
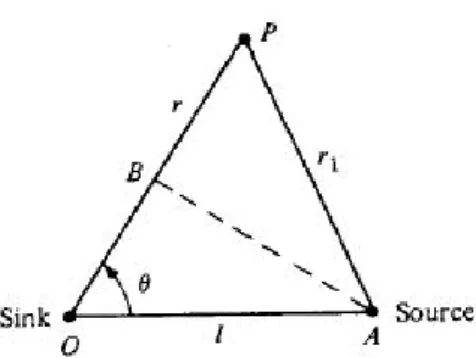
Due to the identity of the vector ∇ × ∇(φ) = 0, it follows from equation (4.8) that the velocity field can be written through a potential function φas. Equation (4.11b) states that the velocity field must tend toward the undisturbed free field, far away from the body. As stated in equation (4.12), it is possible to obtain more complex solutions by superposition of elementary ones.
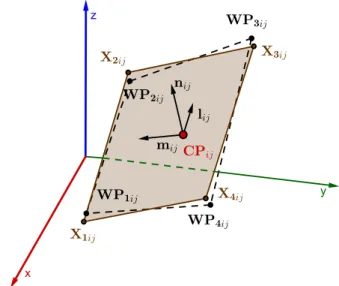
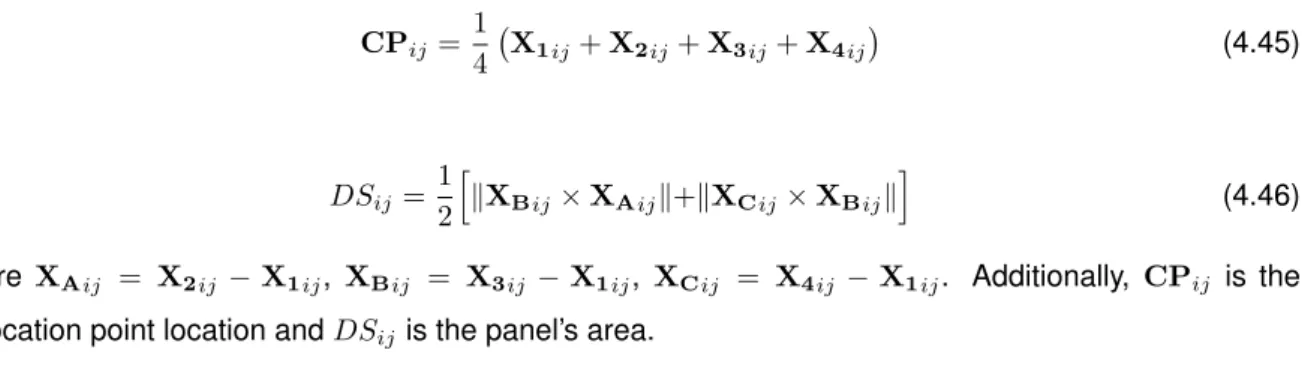
In this way, it is clear that the only unknown in equation (4.48) is the doublet vector, since the source intensity is known and equal to . The influence coefficients present in equation (4.48) are integral terms which can be proved to be a function of the influence panel corner points expressed in their own local reference frame, and the influence panel collocation point location expressed in that reference frame.
Sensitivity Analysis Framework
- Mathematical Formulation
- Design Variables
- Intermediate Variables
- Adjoint Method
- Chain-Rule
- Sensitivities of Wing Parametrization Module
- Partial Derivatives by Symbolic Differentiation
- Partial Derivatives by Automatic Differentiation
- Benchmark - Complex-Step Derivative
- Sensitivities of Panels Definition Module
- Partial Derivatives by Symbolic Differentiation
- Benchmark - AD and the Complex-Step Derivative
- Sensitivities of Change of Basis Module
- Sensitivities of Aero Solver Module
- Benchmark - Automatic Differentiation
- Sensitivities of Post Process Module
- Summary of the Chain Rule
- Final Benchmark with Finite Differences
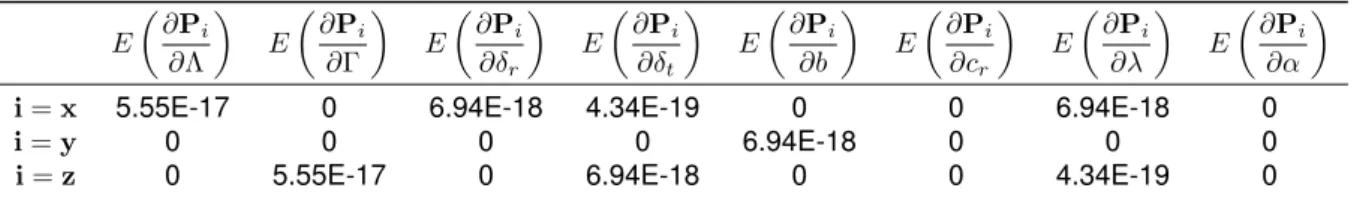
Similar to equations (5.3) and (5.4) is the variableLPP, an abbreviation of 'Local Panel Points'. 5.5) and according to Table 4.3 this explicitly depends on the variables PP, CP and LV. The final step in the sensitivity analysis framework corresponds to constructing the intermediate Jacobians and applying the chain rule. The table shows the absolute error of the partial derivatives of a wing pointPcomponents with respect to the components ofα∪xgeo.
All the partial derivatives of the source and dipole effects with respect to all their dependencies, already and recently presented, are introduced in Section A.2 of Appendix A. As observed in this section and also in Section 5.5.3, it is required that calculate the partial derivatives of the source intensities with respect to its dependencies.
Parametric Study
- Convergence Study
- Angle of Attack
- Taper Ratio
- Twist Distribution
- Sweep Angle
- Dihedral Angle
- Airfoil Section
- Remarks on Wing Parameters
The influence of the taper ratio on the relevant aerodynamic coefficients will now be presented. To evaluate the effect of the taper ratio, one can force the wings to operate with the same lift coefficient and aspect ratio. The decreasing tendency of the bending moment is due to the increase in lift per span near the wing root, which decreases the taper.
According to the figure, increasing the sweep angle increases the wing loading near the wingtips so that the lift distribution deviates from the elliptical reference case. a) Variation of the drag coefficient with wing sweep. An optimization problem will also be solved to explore the effect of the airfoil shape in the wing drag.
Wing Aerodynamic Optimization
Optimizer
To this effect, MATLABR provides a powerful toolbox called Optimization Toolbox[67], which allows the user to solve a large set of problems, namely linear programming (LP), mixed integer linear programming (MILP), quadratic programming ( QP), non-linear programming (NLP), among other solvers. To handle linear equality and/or inequality constraints, the respective matrices and vectors must be provided. Both nonlinear objective and constraint functions must be provided to their respective MATLABR functions through a function handle.
Additionally, if the gradient is calculated externally by the user, it must be provided as another output in these functions. To that effect, MATLABR provides a function called optimoptions, which creates the array according to the user's preferences.
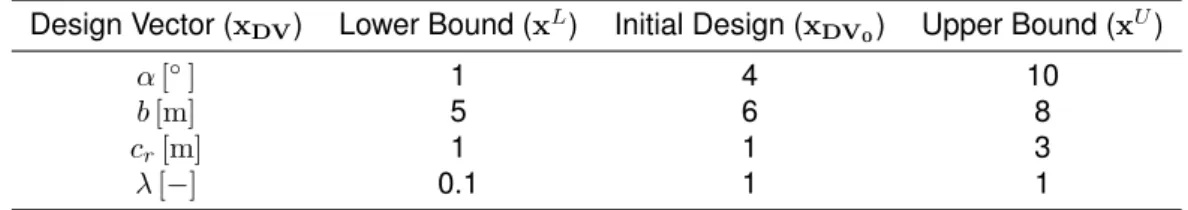
Wing Planform Optimization
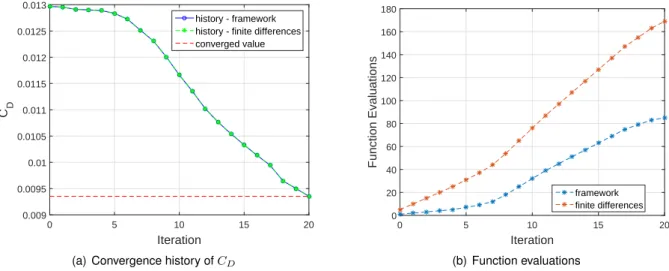
Examples of available options include optimization algorithm, maximum number of function evaluations and iterations, first-order optimality measure, and the option to provide analytic gradients for objectives and constraints. In addition to the number of iterations, the number of function evaluations and computational time are also tracked and compared. The cumulative number of function evaluations is shown in Figure 7.2 (b), using both the FD and the sensitivity framework.
NDV + 1)(i+ 1) for FD, andi+ 1 for the sensitivity framework, where NDV is the number of design variables and i is the iteration number as given in Figure 7.2 (b), it can be concluded that the optimizer spent 20 and 24 additional function evaluations using FD and differentiation tool, respectively, during line search. These results show that the new sensitivity analysis framework is less efficient when dealing with a small number of design variables.
Full Wing Optimization
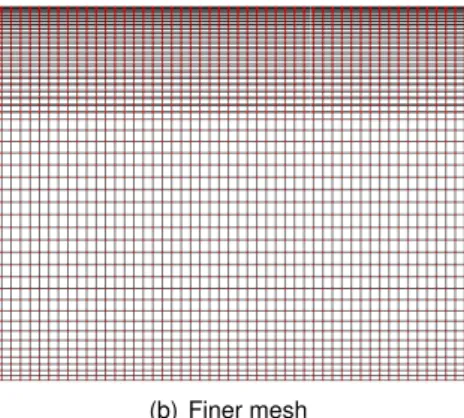
The reduction in angle of attack was necessary to adjust the value of CLand, the combined change in planform design variables was such that it produced a significant increase in aspect ratio and Oswald efficiency. After stating the problem, the baseline wing configuration and respective flight mode must be defined and it was chosen to be the same as in the first optimization problem (Table 7.1). The results were obtained using a grid with 30×8 panels in the chord and span directions respectively.
This reduction was possible through a reduction in lift coefficient, an increase in aspect ratio and Oswald efficiency, achieved mainly by a combined effect of increasing the wingspan and adjusting the twist, chord and camber distributions. This can be an advantage if viscous effects are taken into account, as high suction peaks usually mean unfavorable pressure gradients in the top surface, leading to increasing boundary layer separation.
Conclusions
Achievements
In that sense, it was observed that the respective sensitivity analysis of the module responsible for the panel generation and the aerodynamic solver were about 1000 and 200 times faster, respectively, compared to the implementation using automatic differentiation. As a result, the sensitivity analysis framework proved to be more than 9 times faster when compared to the implementation of the finite-differences method for the aerodynamic model without compromising the accuracy of the final jacobian. Finally, two representative aerodynamic optimization problems were solved using the new tool and a similar implementation using forward finite differences.
Furthermore, the new tool proved to be inefficient when dealing with a small number of design variables since the cost of evaluating the aerodynamic model is several times less computationally expensive than evaluating the new sensitivity analysis framework. However, the new tool proved to be much more efficient than the implementation using finite differences as the optimization process using the former was about 9 times faster, reducing a 19 hour optimization to one that takes only 2 hours.
Future Work
To precompile the derivatives from the sensitivity analysis of the aerodynamic solver and post-process modulus, the coupled semi-analytical method was used since the combined number of inputs was much greater than the number of outputs. The second was a complete optimization of the arm with respect to all design variables, subject to the same constraints as the first, but in addition, the pitching moment coefficient was fixed at the base value. From the first problem, it can be observed that the optimized design did not change much using one method over the other.
From the last problem, it is also observed that the final design parameters between implementations have not changed much. According to these results, it can be concluded that the new tool provides a much better computational efficiency for designs that use many design variables.
Holland. Adaptation in natural and artificial systems: an introductory analysis with applications to biology, control and artificial intelligence. Threshold acceptance: a general-purpose optimization algorithm that appears superior to simulated annealing. Journal of Computational Physics.
Appendix A
Details of Partial Derivatives
Panels Definition Module
Aero Solver Module
Considering the dependence of the variables of the rion xi,yi,x,yandz, it can be said that dri. where the partial derivatives are given by. A.30). The derivatives of rj with respect to the generic variable ξ are easily obtained by substituting the index into the previous equations. Observing now the expressions forfij andgij in equations (A.21a) and (A.21b), and applying the chain rule to them, we get
The partial derivatives in both equations are given by. A.41) Again, the relevant derivatives are obtained by substituting the index. Considering now the influence of the source in equation (4.50a), it is possible to relate it to the influence of the dipoleCas.
Appendix B
Twist and Planform Optimization
However, optimization using finite differences was about 3 times faster than using the new tool. Based on these results, we can conclude that the use of finite differences is better when very few design variables are used, as one might suspect from looking at Table 5.5. The optimization results are presented in Table B.4, and a visual comparison between the baseline and the optimized wing configuration is presented in Figure B.2.
By observing the objective function values before and after the optimization, one can observe a reduction of 28% while satisfying the lift and area equality constraints.
![Figure 1.3: Aircraft market share for different regions [8]](https://thumb-eu.123doks.com/thumbv2/123dok_br/19767793.0/27.892.190.703.107.389/figure-1-3-aircraft-market-share-different-regions.webp)
![Figure 1.6: Sensitivity analysis methods - Computational cost as a function of the number of design variables, Martins [14]](https://thumb-eu.123doks.com/thumbv2/123dok_br/19767793.0/29.892.263.601.748.1017/figure-sensitivity-analysis-methods-computational-function-variables-martins.webp)