54 Figure 38 - Nitrate concentration values in the permeate mixture and feed WW from the MF system. 55 Figure 39 - Phosphate concentration values in the permeate mixture and feed WW from the MF system.
Literature review
- The world water scenario – the background
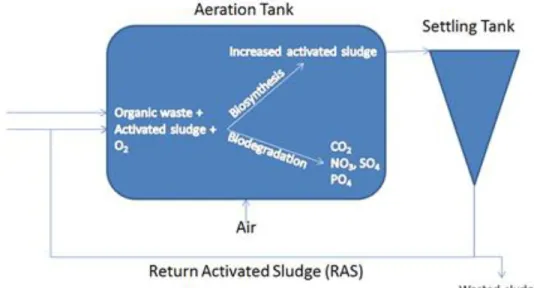
- Wastewater treatment – Activated sludge process
- ZeroWasteWater (ZWW): the concept
- AB process: the A-stage
- Anaerobic digestion (AD)
- Fermentation
- First concentration step in the ZWW-concept: Membrane process
- Advantages of membrane assisted biotreatment
- Microfiltration (MF)
- Forward osmosis (FO)
- Fouling
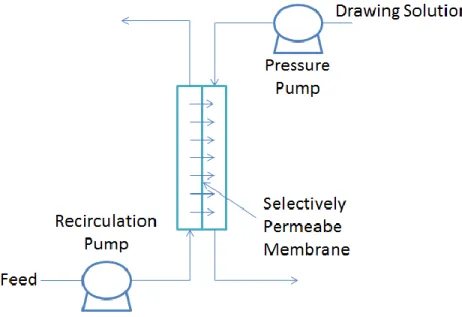
Most of the solids separation problems can be linked to the floc characteristics of the activated sludge. Thus, the concentrated solution on the permeate side of the membrane is the source of the driving force in the FO process. Nevertheless, the water flow is in the path of a concentrated draw solution (analogous to FO).
Research question and thesis outline
Materials and methods
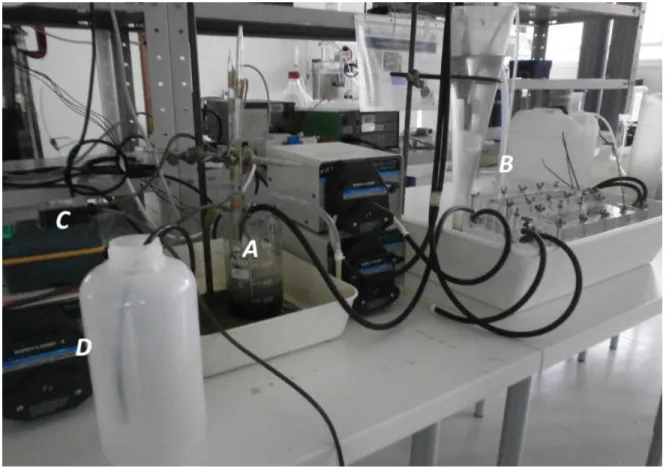
Experimental Setups
- Wastewater and sludge
- Primary membrane enhanced A-stage
- General set-up and operational conditions
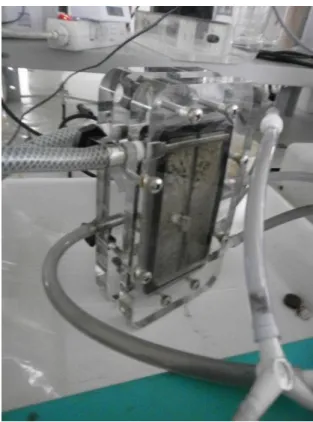
- Microfiltration (MF): membrane system 1
- Forward Osmosis (FO): membrane system 2
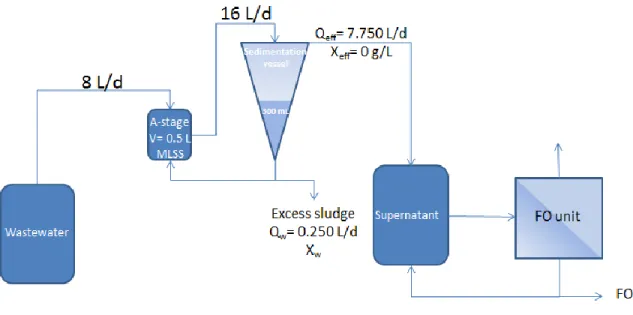
- A-stage coupled with a settler and membrane system
- General layout and sedimentation stage
- Forward osmosis system receiving the settler supernatant
- Enhanced A-stage with tangential filtration systems
- General layout and MF stage
- Forward osmosis system receiving the MF permeate
- Primary membrane enhanced A-stage: Batch test with A-sludge as feed
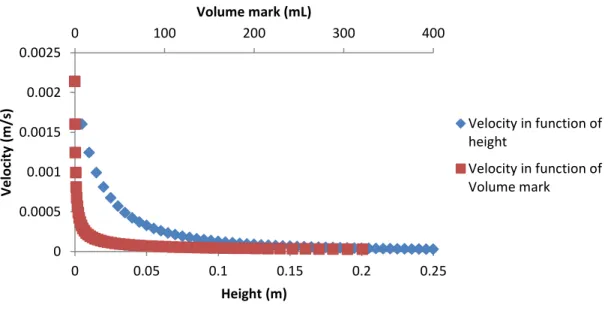
In order to have the same flow rate (Q) used in the MF system and thus compare the results obtained, the cross flow rate (vl) in the FO system can be calculated. TS and VS determinations were performed only on the initial ML and in the sludge aeration, which was performed directly from the bottom of the clarifier. In order to calculate the inlet height in the cone corresponding to the maximum upflow velocity of the water, it is necessary to calculate the minimum required surface area Smin and the respective radius (Rmin) by equation 22 and equation 23 (table 7).
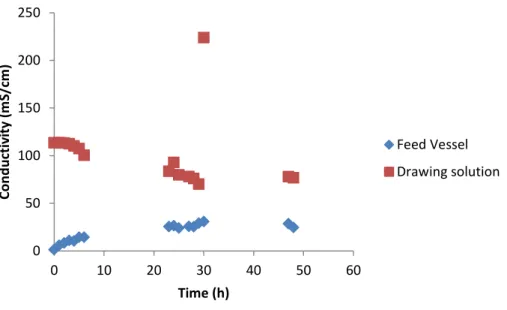
The venting corresponds to a flow rate removed from the feed vessel to prevent a large increase in reactor conductivity and establish a steady state. During the test with this test setup, conductivity values were determined in the feed vessel. 33 As in the previous system, TS and VS determinations were made on the initial ML and on the sludge discharge, which was performed directly from the reactor.
Venting corresponds to the rate of flow withdrawn from the feed vessel to avoid a large increase in reactor conductivity and to establish a steady state. The inlet to the inlet vessel was connected to a level controller to adjust for expected changes in permeate flow. in time, maintaining a constant volume of 500 ml. Conductivity was measured in the feed vessel and in the drawn solution during tests with this experimental setup.
Analytical Techniques
- Determination of the Chemical Oxygen Demand (COD)
- Determination of the Total Ammonia Nitrogen (TAN)
- Determination of Kjehldahl-Nitrogen (Kj-N)
- Total and volatile solids
- Chloride, nitrate, nitrite, sulphate and orthophosphate
- Conductivity
- Oxygen concentration
Thus, 0.4 g of magnesium oxide (MgO) was added to 10 ml of sample to convert all ammonium into ammonia, which was subsequently distilled out (Vapodest 30s, Gerhardt) and condensed into 10 ml of boric acid with indicator. Back-titration of the boric acid indicator solution with 0.02 M hydrochloric acid to its original pH of 5.3 allows the ammonium content to be determined. After 1/1.5 hour in the destruction device at 400C (until the liquid is clear), the tubes are allowed to cool until all the white fumes have disappeared.
Subsequently, 50 mL of sodium hydroxide is automatically added to the sample to convert all the ammonium into ammonia, the samples are distilled and condensed to 10 mL of boric acid solution, and the content is determined by acid-base titration, as described for TAN determination. . The end point for the titration is around pH 5.3 and is also visible when the indicator changes color from green to blue/purple. Volatile solids (VS) were determined by subsequent ashing of the dry solids for 2 hours at a temperature of 600°C.
The difference in mass between dry solids and ash was taken as the mass of volatile solids in the sample. Oxygen concentration measurements were performed with an HQ40d LDO electrode connected to a HACH multimeter analyzer.
Results
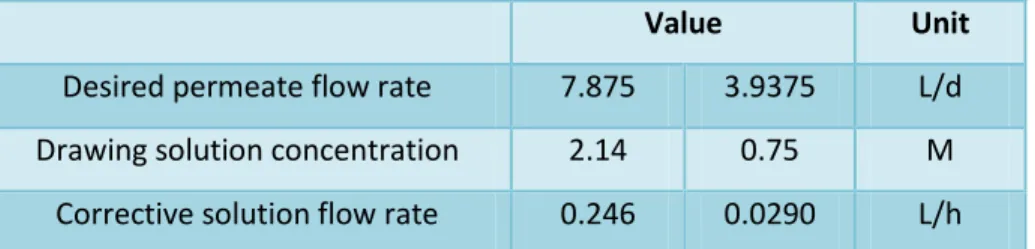
FO system’s drawing solution and correspondent corrective solution
Since the water in FO systems permeates from the feed side through the membrane to the draw solution, it is important to adjust the concentration of the draw solution to keep this value constant and corresponding performance at a constant level. In this system, a 5 M NaCl correction solution was used for this, a concentration value near the NaCl solubility limit.
Primary membrane enhanced A-stage
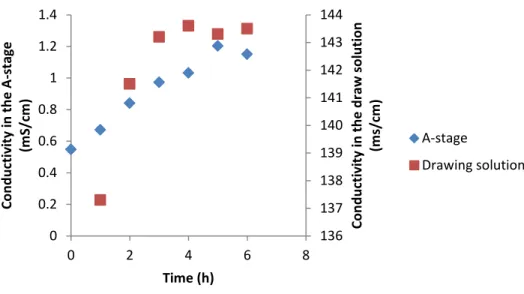
41 draw solution dilution system should have been corrected with 29 mL/h of 5 M NaCl instead of the 25.4 mL/h value used, which could have contributed to the suboptimal performance. From the conductivity measured in phase A and in the drawing solution, during the experiment with the FO system, it can be seen that in phase A there is a clear tendency for an increase in conductivity over time, while the salt concentration in the drawing solution was stable after the first 3 hours (Figure 17).
A-stage coupled to a settler and membrane system
- Operation of the A-stage coupled to the settler
- Results from the forward osmosis system receiving the settler supernatant
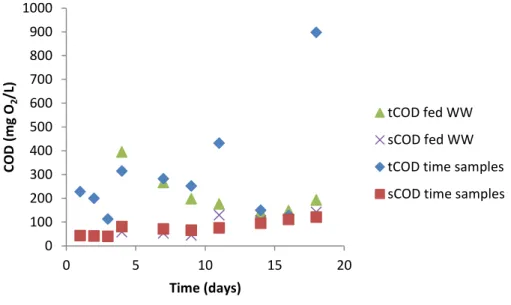
In the first few days, tCOD levels in the supernatant are slightly lower than those of the added WW (Figure 19), indicating that some overall removal has occurred. However, from approximately day 8 onwards, no apparent removal of organic matter in the system was observed, given the tCOD levels of the above samples. This could also be due to the transfer of biomass into the supernatant, as evidenced by the loss of biomass measured in the A phase (see Figure 26).
By analyzing the samples using IC, it was possible to follow the concentrations of several anions in the added WW and in the supernatant throughout the experiment. However, some nitrites were detected in the supernatant on the first days of the experiment, which coincided with the higher dissolved oxygen concentrations determined at the same time (Figure 18). The sulfate concentration profiles show only an apparent decrease in the first days of the experiment (around 40%), and then show similar values in the supernatant and in the WW added system (Figure 25).
Following the conductivity values in the food container during the experiment, it becomes clear that both systems behave the same in the first 30 hours (Figure 28). 49 From the values in Figure 29, it is clear that both systems presented a similar profile in terms of flux and conductivity values in the food container.
Enhanced A-stage with tangential filtration systems
- Operation of the A-stage with a mesh sieve coupled to the MF unit
- Results from the forward osmosis system receiving the MF permeate
53 16th day after, there is no significant ammonia and Kj-N removal in the system (Figure 34 and Figure 35). It should be noted that between days 18 and 22 low concentrations of ammonia were measured in the system. 54 WW from the Ossemeersen treatment plant exhibited less than half of the chloride concentrations measured in WW from the Maria Middelare treatment plant.
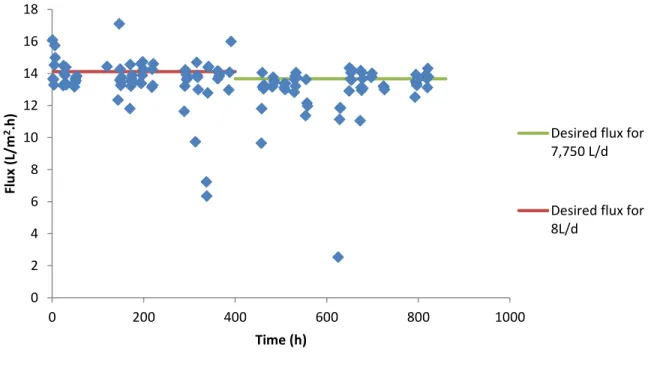
During the assay, some nitrites were formed in the system (Figure 37), especially in the early stages when the dissolved oxygen concentration was high (Figure 31). 57 Analyzing the levels of TS and VS in level A samples taken during the test, we can conclude that the system showed higher values of the VS/TS ratio in the first days. It can also be seen that the system with a higher bleed rate (1500 ml/d) tends to maintain a higher flow rate throughout the experiment compared to the 250 ml/d bleed system (Figure 42), as it has a higher ability to maintain conductivity in the inlet vessel at constant low levels.
In both experiments, the conductivity value in the drawing solution tended to decrease, although it was continuously corrected by the addition of the 5 M NaCl solution. In the system with a deaeration of 250 ml/d (Figure 43), the conductivity in the drawing solution decreased less due to the lower osmotic water transfer rate.
Primary membrane enhanced A-stage: Batch test with A-sludge as feed
61 As in the other FO tests, the conductivity in the A-stage feed tended to rise due to the water permeation to the drawing solution side. However, there was again an unexpected decrease in the draw solution conductivity (Figure 46) despite the corrective solution addition being carried out at a flow rate calculated to compensate for a higher flux value than that actually registered. As expected and already registered in the previous FO tests, higher conductivity values in the feed vessel correspond to lower permeate flux values, but this effect is weakened in the higher conductivity (Figure 47).
Discussion
This poor settling over time is also reflected in the VS and TS profiles (Figure 26), as a reduction in the concentration of solid particles present in the A-stage is visible (up to 62% in TS and 67% in VS). In the improved A-stage with tangential filtration systems, removal of tCOD between 39 and 83% and between 2 and 42% for sCOD was observed. If we analyze the measured concentrations of ammonia, nitrate and nitrite in the improved A-stage with tangential filtration systems, the removal efficiencies of TAN and Kj-N are low (Figure 34 and Figure 35).
Nevertheless, the occurrence of nitrification was detected by the system's production of nitrite and nitrate during the essay (Figure 37 and Figure 38), essentially at the beginning of the essay when the concentration of dissolved oxygen was high. As in the previous system, there is generally no significant removal of anions, as expected. 66 events need to be investigated regarding the possible removal mechanisms taking place in the system.
Although pH measurements were not made during the phase A test improved with dual membrane systems, this possibility is consistent with the fact that in the same period the system showed lower TAN concentrations (Figure 34). This could be a possible justification as these days were the ones with the lowest dissolved oxygen concentration in the system (Figure 31).
Conclusion
Recommendations for future research
69 Finally, it would also be interesting to use the sludge produced by a highly concentrated A stage in anaerobic digestion and fermentation process and compare their performance with those obtained in conventional activated sludge processes. An economic analysis should also be carried out to assess whether the pumping energy demand resulting from the use of the membrane systems is compensated by the possible gains from products and energy recovered through sludge anaerobic digestion or fermentation. Handbook on the causes and control of activated sludge bulking, foaming and other solids separation problems.
Retention and flux decline mechanisms for nanofiltration of dye baths from the textile industry. Comparison of aerobic denitrification in high-oxygen atmospheres by Thiosphaera pantotropha ATCC 35512 and Pseudomonas stutzeri SU2 freshly isolated from the activated sludge of a swine wastewater treatment system. Characterization and comparison of a membrane bioreactor and a conventional activated sludge system in the treatment of wastewater containing high molecular weight compounds.
Microbiological basis of phosphate removal in the activated sludge process for wastewater treatment. The use of simultaneous chemical precipitation in modified activated sludge systems exhibiting biological excess phosphate removal.