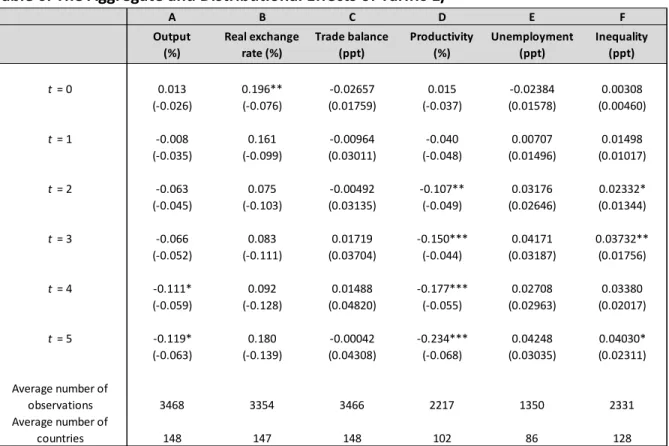
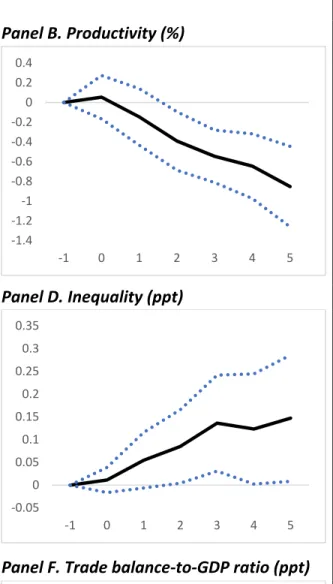
We find that tariff increases in the medium term lead to economically and statistically significant declines in domestic output and productivity. We find empirically that tariff increases lead to declines in output and productivity in the medium term, as well as increases in unemployment and inequality. In contrast, we do not find an improvement in the trade balance following tariff increases, plausibly reflecting our finding that the real exchange rate tends to appreciate as a result of higher tariffs.
In particular, we perform a series of robustness checks which include: a) control for simultaneous shocks in the trade balance and real exchange rates, b) control for expected future growth and c) application of a VAR model where the tariffs are ordered last—that is, assuming , that changes in tariffs respond to simultaneous changes in economic activity. The impact of trade policies on inequality has been examined in the context of debates about the relative importance of trade and technology in creating inequality (Helpman, 2016) or by using firm-level data to understand the impact of. In addition, while previous studies have looked at the impact of trade liberalization or trade openness, we only look at tariffs—a narrower variable that may also be more relevant in the current global political context.
We emphasize that our findings strengthen the case for free trade and seem entirely consistent with conventional wisdom in the discipline. Xi,t is a vector of control variables, including two lags of each of: a) changes in the dependent variable, b) the tariff, c) log output, d) log real exchange rates, and d) the trade balance as a percentage of GDP, and . The coefficients of greatest interest to us are {β}, the impulse responses of our variables of interest to changes in the tariff rate.5 We choose our variables of interest to depict arguably the four most important manifestations of real-world health.
This database provides information on 22 manufacturing industries based on INDSTAT2 2016, ISIC Revision 3.6 However, to match the sectoral information in the OECD input-output table, we combine some of the sectors in the UNIDO database.
R ESULTS
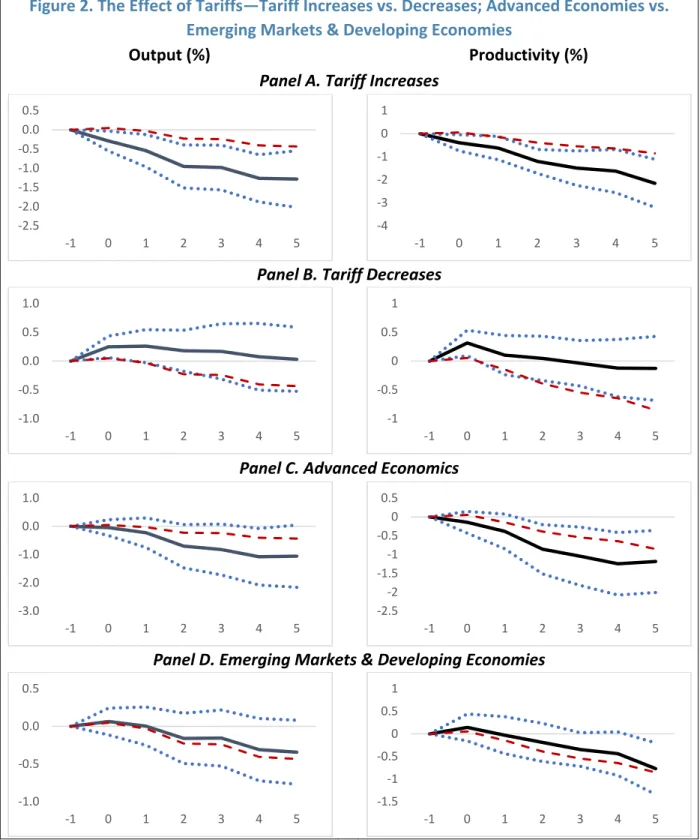
We present our results on the symmetry of tariff increases and decreases in the top half of Figure 2. Clearly, the decrease in output after a one standard deviation increase in the tariff rate is higher than the baseline; this effect is statistically significant, as shown in Panel A of Figure 2 for both output and productivity. The drop in rates usually leads to a slight, immediate increase in demand because buyers know that lower prices will prevail in the future.
This argument is also supported by our results on consumption, as shown in Figure AIV.1 (Panels C and D): an increase in tariffs leads to a larger reduction in consumption than in the baseline. Our results are shown in the lower part of Figure 2; the impulse response functions are analogous to those in the upper half (based on (2)), but for a different partitioning of the data (based on equation 3). Similarly, the effect on productivity is higher than in the baseline for advanced economies and lower for other economies.
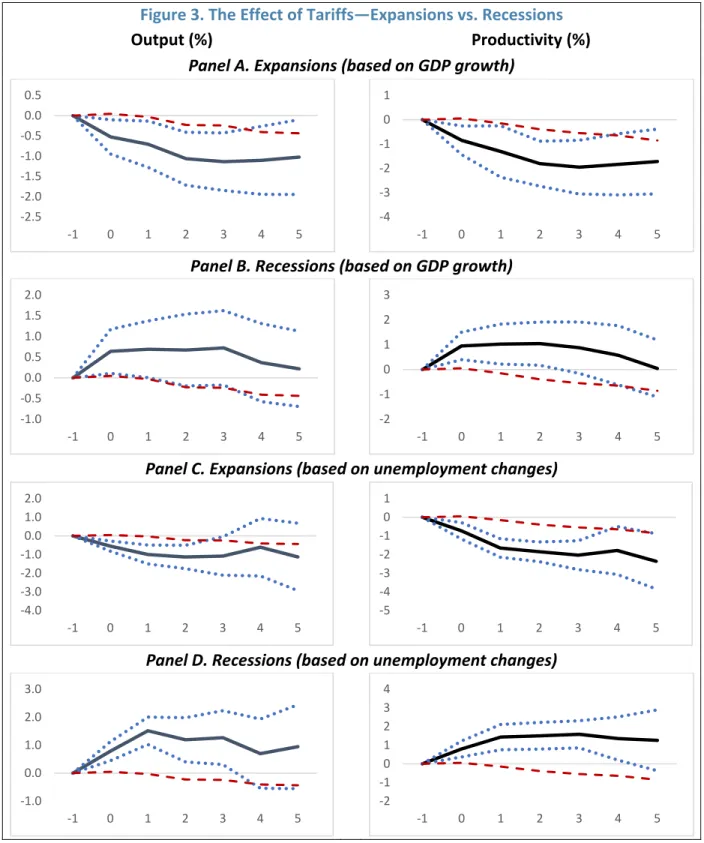
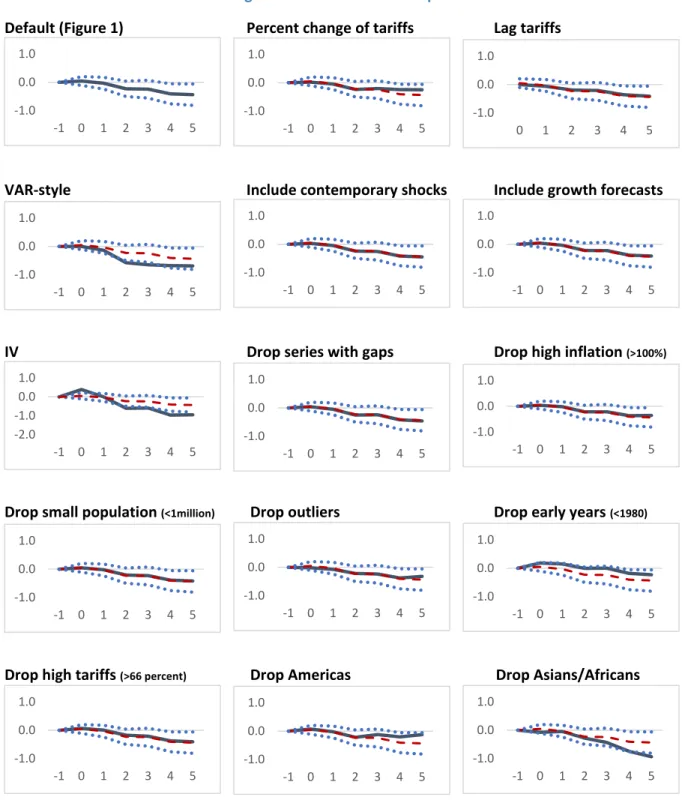
The results in Figure 3 show that the response of output and productivity to tariff increases is more dramatic during expansions. Our default results are presented in the upper left part of the figure for easy comparison. In the upper middle panel, we check whether the results hold when considering tariff changes in percentage terms (that is, dividing our baseline measure by the lagged tariff rate), rather than in absolute terms.
In the upper right panel, we substitute the lag of rates for its contemporaneous value. The IRFs for our different transformations of tariffs indicate that the output response to changes in tariff is not statistically different from that reported in the baseline: in both cases these responses lie well within the confidence bands of the baseline responses. Our specification implicitly assumes that shocks to the rate do not respond to changes in the outcome variables within a year.
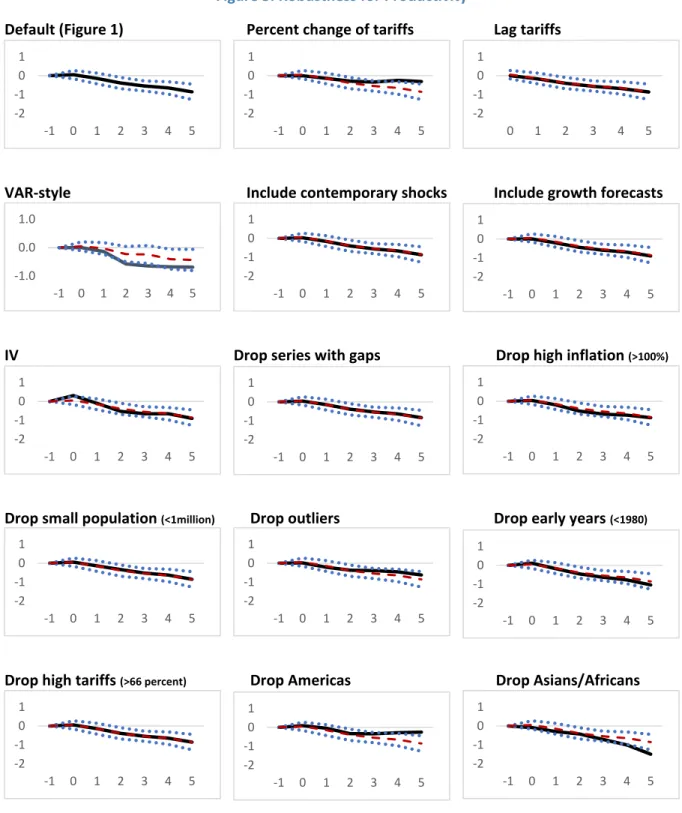
These three perturbations are presented in the second row of Figure 4 and do not fundamentally change our conclusions. Moreover, we consider the instrument plausibly exogenous, as changes in the rate in major (top 5) trading partner countries are unlikely to be correlated with the error term of equation (1), once we control for lagged changes in domestic macroeconomic variables (output , real exchange rates, tariffs and balance of trade). Our analysis so far has shown that, on average, tariff increases lead to declines in production and productivity in the medium term.
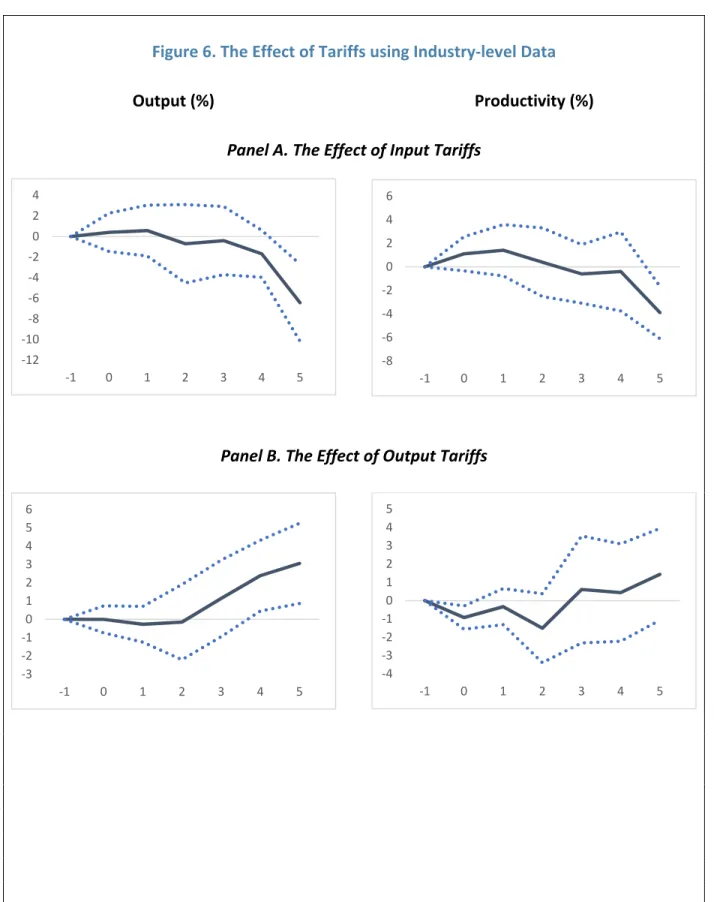
The results in the top panels of Figure 6 suggest that an increase in the input tariff rate leads to a statistically significant decrease in sector output of about 6.4% five years. To summarize, these results suggest that the negative macroeconomic effect of tariff increases presented in the previous section stems largely from increases in input tariffs.
C ONCLUSION
Ju, Jiandong, Yi Wu and Li Zeng, 2010, "The Impact of Trade Liberalization on the Balance of Trade in Developing Countries," IMF Staff Papers, vol. Thirlwall, 2004, "The Impact of Trade Liberalization on Exports, Imports and the Balance of Payments of Developing Countries," Economic Journal, vol. Note: The solid line indicates the response of output (real exchange rate, trade balance, labor productivity, unemployment, inequality) to a one standard deviation increase in tariff; the dotted lines correspond to 90%.
Note: The solid black line indicates the response of output (productivity) to a one standard deviation increase and decrease in tariff (advanced economies and emerging markets and developing economies); the dashed lines correspond to 90% confidence bands; estimates for Panel A and B are based on equation (2); estimates for Panels C and D are based on equation (3). Red dashed lines indicate the response of output (productivity) to a one standard deviation increase in tariff in the baseline; estimates based on equation (1). Note: The black solid line indicates the response of output to a one standard deviation increase in tariff using the scenarios described in each title of the chart.
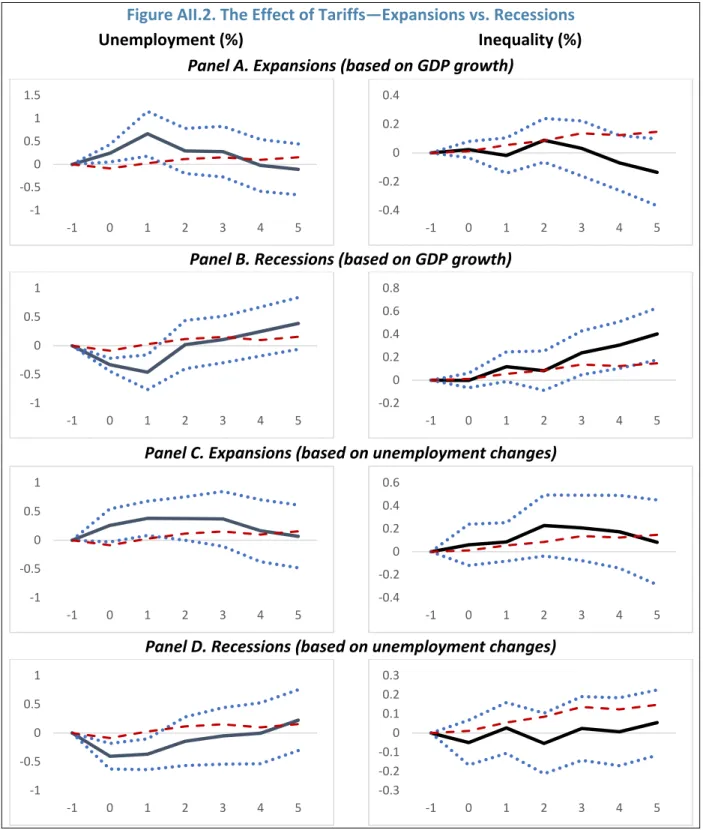
Note: The solid black line indicates the productivity response to a one standard deviation tariff increase using the scenarios described in each chart title. Note: The solid line indicates the response of labor output/productivity to a one standard deviation increase in the input/output tariff; dotted lines correspond to 90% confidence bands. Note: The solid black line indicates the response of unemployment (inequality) to one standard deviation increase and decrease in tariff (advanced and emerging and developing economies); dotted lines correspond to 90% confidence bands; estimates for Panels A and B are based on equation (2); estimates for panels C and D are based on equation (3).
Dashed red lines indicate the response of unemployment (inequality) to a one standard deviation increase in the tariff in the baseline; estimates based on equation (1). Note: The solid black line indicates the response of unemployment (inequality) to a one standard deviation tariff increase between expansion and recession; dotted lines correspond to 90% confidence bands;. Dashed red lines indicate the response of the real exchange rate (trade balance) to a one standard deviation increase in the tariff in the baseline; estimates based on equation (1).
Note: The solid black line indicates the response of real exchange rate (trade balance) to a one standard deviation increase in tariff during expansions and recessions; the dashed lines correspond to 90% confidence bands; estimates based on equation (4); for Panel A and B, expansions and recessions are identified using GDP growth; for Panel C and D using unemployment changes. Note: The black solid line indicates the response of unemployment to a one standard deviation increase in rate using the scenarios described in each title of the chart. Note: The black solid line indicates the response of inequality to a one standard deviation increase in tariff using the scenarios described in each title of the chart.
Note: The black solid line indicates the reaction of the real exchange rate to an increase in the rate by one standard deviation using the scenarios described in each title of the chart. Note: The black solid line indicates the trade balance's response to a rate increase of one standard deviation using the scenarios described in each title of the chart. Note: The solid black line indicates the response of consumption (inflation) to a rate increase of one standard deviation;.
Dashed red lines indicate the response of consumption (inflation) to a one standard deviation increase in the tariff in the baseline; estimates based on equation (1).