Introduction
Wall Functions in Viscous Flow
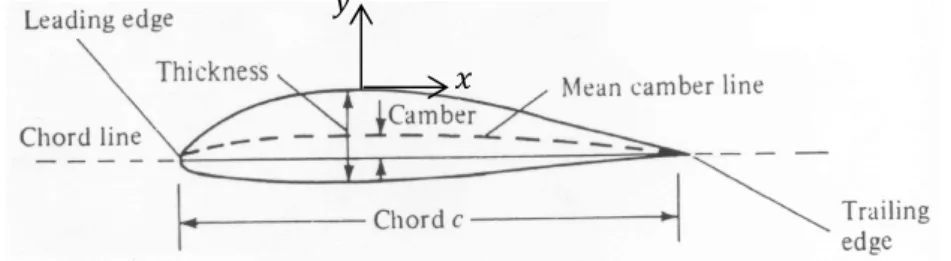
Mathematical Models
10l∗ is the production of turbulence kinetic energy (with limiter), is the specific rate of dissipation of turbulence, l∗, op, r, os and os are constants and tu is a mixing function of and defined in [6] is zero away from the wall (resulting in the − k model) and changes to one inside the boundary layer (activating the − model). 9 where Ω is the vortex size, u is equal to 0.31 and t is another mixing function also presented in [6].
Wall Functions
The eddy viscosity is then used to calculate the Reynolds stresses with equation (2.8) to close the system of the RANS equations. Finally, the log layer is valid from = 30 − 50 to the outer edge of the law-of-the-wall region, which depends on the Reynolds number. The turbulence quantities can also be calculated as a function of in the area of the wall law.
Despite the usefulness of the law of walls, not all flows (or indeed very few) are as simple as those on which the said law is based. The − SST model showed very good results in predicting the skin friction coefficient up to 80. 34] tested the accuracy of the hybrid WF by eliminating the numerical error inherent in coarse grids using the so-called "delta-grid". ”, in which the wall integration grid is shifted up by a distance (delta) to provide the desired in the first cell for the WF.
12 Flow calculations over a flat plate collapsed into the wall integration profile when using.
Implementation of Wall Functions in ReFRESCO
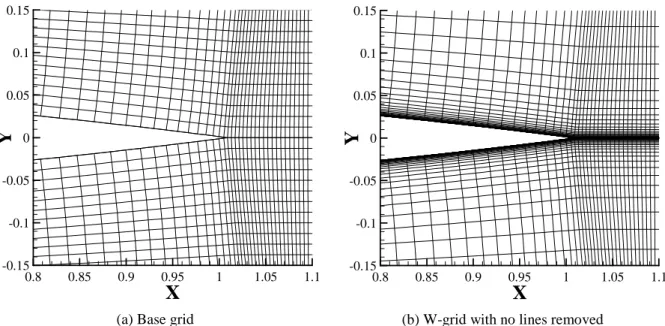
Most commercial grid generators available allow the user to choose the dimensionless distance to the wall of the first node (), but construct the grid so that the distance between the grid lines increases progressively as the distance from the wall increases. For values greater than 1, where the WF method is justified, this method of grid generation leads to very few nodes within the boundary layer, lacking the resolution needed to calculate the high gradients in that region. This thesis aims to study a more accurate raster generation approach by eliminating some raster lines next to the wall, while maintaining the high resolution above the first volume.
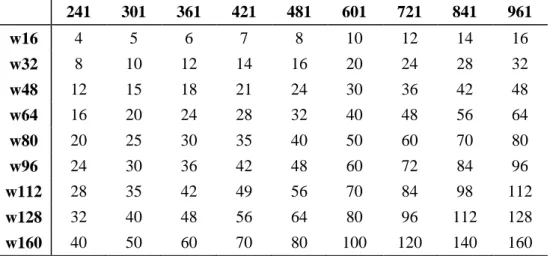
This grid generation method is then applied to two different airfoils and tested for different angles of attack and Reynolds numbers. The friction velocity is calculated from the velocity magnitude, the turbulence dissipation rate is fixed at the first node of the inner grid away from the wall, and the turbulence kinetic energy is resolved in the near-wall cell with a corrected production term based on z .
Airfoils
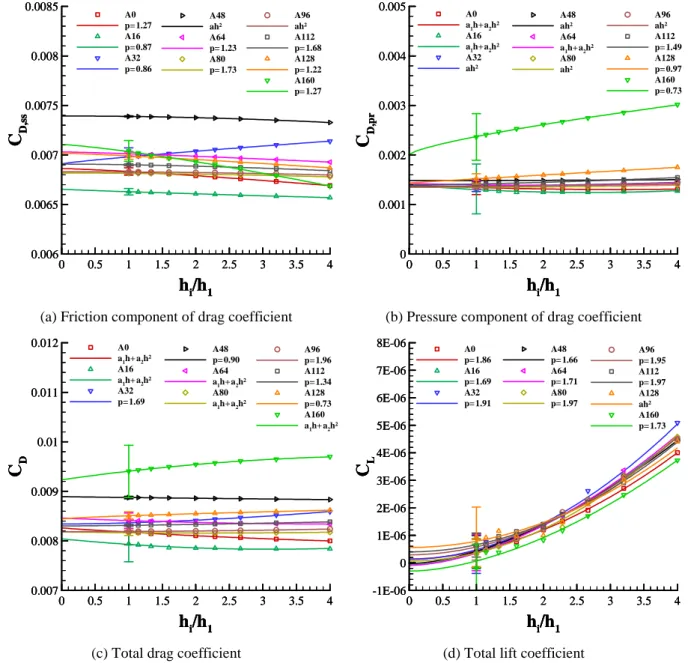
The difference between the same four groups as in the ¡h and the No-WF solution is illustrated in Figure 4.4b. Again the results are not presented due to the influence of the iterative error on the results. The results for the ¡ª are very similar to those of the ¡ª,®Å due to the very small values of ¡ª,ÄÄ.
The asymptotic values (¡ª,®Å when ℎK/ℎu→ 0) still show a significant dependence on the distance of the first node to the wall. The pressure coefficient along the chord is shown in Figure 4.18a, and the difference between the standard grid groups and the No-WF solution is shown in Figure 4.18b. In this section, the results obtained with the standard and W-grid are compared with those obtained by directly applying the no-slip condition.
The variation of the aerodynamic forces with is illustrated in Figure 4.21, for the Standard and W grids.

Grid Generation
Choice of Grid Configuration
The calculations were also performed using the no-slip condition directly to serve as a reference for the WF results. None of the WF solutions show a transition point, and group A48 (= 11) shows significant deviation from the No-WF solution for the majority of the chord length. The variation of friction, pressure and total drag coefficient with is illustrated in Figure 4.7, for the standard and W grids.
As for the total ¡«, for values below 1, the W grid shows a small deviation from the solution obtained with direct application of the anti-slip condition. 41 Figure 4.9 illustrates the ¡h distribution along the chord for the top and bottom surfaces of the NACA 0012 airfoil. The variation of the friction, pressure, and total drag and lift coefficients are shown in Figure 4.13 for the Standard and W grids.
The results for the pressure component of the drag show a high dependence on the drag, with the asymptotic values ranging from 0.0105 to 0.012.
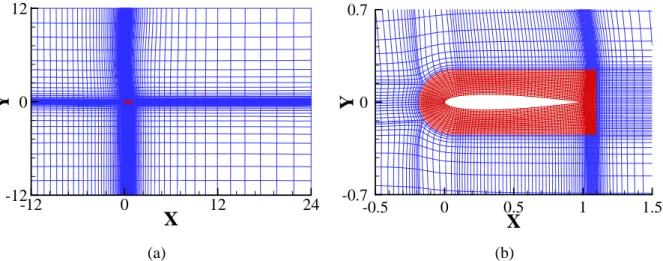
Generation of Base Grid
- Block I
- Blocks II and V
- Blocks III and IV
Interpolation for Near-Wall Refinement
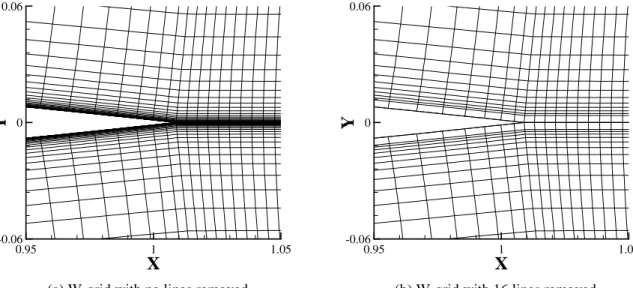
- The W-grid
- The Standard grid
And the second component due to the integration of the pressure along the airfoil surface, denoted by the index Q. The results show a significant sensitivity ¡«,ÄÄ to the dimensionless distance of the first mesh node to the wall. The pressure distribution over the surface of NACA 0012 solution No-WF, group A96 and CFL3D [46] is shown in Figure 4.4a.
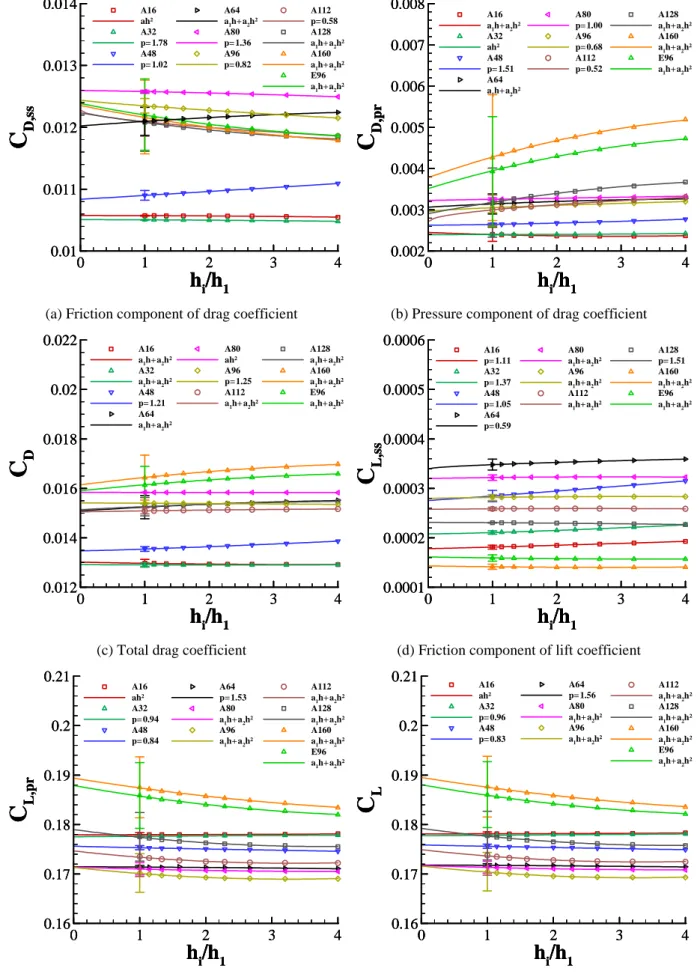
The standard grid does not seem to give satisfactory results at any location of the first grid node above the wall. Outside this range, none of the grid types appear to be appropriate for these calculations. In the region of the log layer, the standard grid gives smaller deviations from the solution obtained without WF than the W grid, although the W grid shows considerably high uncertainty values.
None of the groups from the W-grid show a transition, assuming turbulent flow from the leading edge onwards. The results for the friction component of the drag coefficient show that the standard grid gives smaller deviations than the W-grid, again due to the error cancellation effect discussed in Section 4.3.3. At four degrees of incidence angle, the W-grid shows very little -dependence of the pressure distribution, but significant deviations from the No-WF results are observed.

Results
Numerical properties
- W-Grid
- Standard Grid
- Comparison to No-WF solution and Experimental Results
Calculations for this angle of attack were performed for all sets of five sets (A through E). The No-WF results show very good agreement with the output from the extensively tested CFL3D code with the SST turbulence model [46] along the chord, including predicting the transition from laminar to turbulent flow at approximately 1% of the chord. The highest deviations of the four groups with WF to No-WF boundary conditions are near the pressure peak and trailing edge.
Similar to the W lattice, the flow is considered completely turbulent since the leading edge when WF is applied, which translates into significant deviations from the No-WF solution, mainly in the first 20% of the chord. Outside these regions, the relative deviation reaches 8% in the buffer layer region and deviates from the reference solution for values above 100 due to the small number of grid nodes used to resolve the boundary layer. For this raster type, the buffer layer area shows a relative deviation of 8% at = 11.
It is confirmed that the location of the first node must be chosen carefully, i.e. outside these regions the results for this airfoil at this angle of attack appear to be in good agreement with the references. a) Relative deviation of the friction component from the air drag coefficient.
- W-Grid
- Standard Grid
- Comparison to No-WF solution and Experimental Results
The A80 results are very similar to the No-WF results, but both show some deviation from the experimental data, namely in the pressure peak region. All results obtained with WF are in very good agreement with the No-WF solution, as shown in Figures 4.10b and 4.10c. a) Pressure coefficient distribution of group A80, No-WF and experimental data. The four selected groups to which WF has been applied have been plotted with the No-WF solution and it is possible to see that the leading edge region (up to 20% of the chord) is the region where the larger deviations occur.
The A80n group appears to produce very good results for L/ > 0.10, which is not surprising since this group is located where WF shows the highest accuracy, i.e. c) Deviation of skin friction coefficient from No-WF. Very small differences from the WF solution to the No-WF solution are obtained with the Standard network as can be seen in Figures 4.12b and 4.13c. Both network types are plotted against experimental data from [48] and No-WF and it can be easily seen that the WF solutions are practically coincident for values of 50 and 51 for the standard and W network, respectively.
This suggests that grids of the standard type can be used with very little loss of numerical accuracy if the distance of the first grid node above the wall is carefully chosen. a) Distribution of pressure coefficient of group A80n, No-WF and experimental data.
- W-Grid
- Standard Grid
- Comparison to No-WF and Experimental Results
51 generates a large 'hole' in the area immediately downstream of the trailing edge, leading to inappropriate gridline spacing in the wake. Comparing only the WF results with those obtained with direct application of the anti-slip condition, the WF results show significant deviations, namely in the buffer layer region. The ¡ª,ÄÄ is not shown due to the influence of the iterative error on the results, as mentioned in section 4.3.1.
Unlike the standard raster, the W raster does not show an area above the buffer layer where the results tend towards a constant value of the deviation. A grid generation procedure was presented that allows systematic grid refinement for the assessment of the grid convergence properties of the force coefficients. This required the development of a network generator that could easily and efficiently construct networks with specific distances close to the wall () and one of two configurations: the standard and the W grid.
58 - At zero degrees of angle of attack, the pressure distributions show very good agreement with the No-WF solutions almost regardless of the value and the highest deviations appear in the leading and trailing edge regions.
Conclusions and Future Work