Monetary Policy Spillovers and the Trilemma in the
New Normal
Joshua Aizenman, USC and NBER Menzie D. Chinn, UW-Madison & NBER
Hiro Ito, Portland State University
SNB-BIS-Dallas Fed-CEPR-JIMF Conference on
“Spillovers of conventional and unconventional monetary policy: the role of
real and financial linkages”
Zurich, July 8-9, 2015
Global Financial Cycles?
• Countries around the globe anxiously await
developments in major economies (the U.S., Euro Area, Japan, China)
• Small open economies are particularly sensitive to policy changes in the economic centers (CEs)
o “Fragile five”
o “Taper tantrum”
o Expected lifting of ZIRP by the U.S.
The debate begins
Hélène Rey @ Jackson Hole, 2013:
“Dilemma not Trilemma: The Global Financial Cycle and Monetary Policy Independence”
• “Whenever capital is freely mobile, the global financial cycle constrains national monetary
policies regardless of the exchange rate regime.”
• It is a dilemma between capital mobility and monetary policy independence, not trilemma
3
The Trilemma
4
Exchange Rate Stability Monetary Union / Currency Board
e.g. Euro, Gold Stand., Hong KongFinancially closed system
e.g., Bretton WoodsChina in the 1980s
Floating exchange rate regime
e.g., Japan, Canada
1
Exchange Rate Stability
Monetary Union / Currency Board e.g. Euro, Gold Stand., Hong KongFinancially closed system e.g., Bretton Woods
China in the 1980s
Floating exchange rate regime
e.g., Japan, Canada
1
Monetary Independence Capital
Mobility
“irreconcilable duo”
Rey (2013)
Rey (2013)
• The CE’s monetary policy influences other
countries’ national MPs through K-flows, credit growth, and bank leverages
• The “trilemma” reduces to an “irreconcilable duo”
of monetary independence and K mobility
The types of exchange rate regime of the non- CEs no longer matter
Restricting K-mobility is the only way for non-
central countries to retain monetary autonomy
-1-.5 0.5 1
Corr. of ST-int. rates w/ US
1990m1 1995m1 2000m1 2005m1 2010m1 2015m1
IDC China
LDC EMEs
-1-.5 0.5 1
Corr. of LT-int. rates w/ US
1990m1 1995m1 2000m1 2005m1 2010m1 2015m1
IDC China
LDC EMEs
-.5 0.5 1
Corr. of stock market indexes with the US S&P
1990m1 1995m1 2000m1 2005m1 2010m1 2015m1
IDC China
LDC EMEs
ST-Interest Rates
LT-Interest Rates Stock Market Price Indexes 36 month
Rolling
correlations
The Bottom Line …
• The extent of sensitivity to core economies’
conditions differs across policy regimes and economies w/ different structures
• We investigate:
o How the sensitivity to the core economies’
conditions differs across countries and change over time for different types of financial variables o What factors determine the extent to which the
financial conditions of the center economies (i.e.,
the U.S., Japan, the Eurozone, and China) affect
those of developing countries and EMEs
Two-Step Approach to Measuring Impact
Step 1: Estimate sensitivities
Step 2: Relate sensitivities to macro variables
(1) .
1 1
it it
Fit C
c
C it C
Fit G
g
G it G Fit Fit
F
it Z X Y
R
(2) .
ˆ
5 4
3 2
1 0
Fit Fit
Fit
Fit Fit
Fit C
Fit
u CRISIS
INST
LINK MC
OMP
Step 1 – estimate γ’s
11
R F : a return in local country
Policy ST interest rates, sovereign bond term spread, changes in stock market price indexes, and changes in the REER
X c : a vector of corresponding returns of the “center economies”
Z G : global factors
– Real: PC of the U.S., ECB, and BOJ policy rates, oil, commodity – Financial: VIX, Ted-spread
Y : local factor (y/y IP growth)
Rolling estimation w/ 36-month windows, each of 100 countries
Model w/ and w/out China as one of the CEs
(1) .
1 1
it it
Fit C
c
C it C
Fit G
g
G it G Fit Fit
F
it Z X Y
R
Step 2 – Relate γ ’s to Policies, Conditions, Institutions
• OMP: Open Macro Policies – Exchange rate stability, financial openness (Chinn-Ito), Int’l reserve accumulation
• MC: Macro conditions – infl. volatility, CA balances, public finances (budget balance or gov’t gross debt)
• LINK: Import Demand by CEs, bank lending by CEs, FDI provided by CEs, degree of trade competition w/r/t CEs
• INST: LEGAL (PC of BQ, LAO, Anti-corrupt), Fin. Dev.
• CRISIS: currency and banking
• 1986-2012, 3-yr panels, about 60 countries
• (i x 3 x t) γ’s
12
(2) .
ˆ
5 4
3 2
1 0
Fit Fit
Fit
Fit Fit
Fit C
Fit
u CRISIS
INST
LINK MC
OMP
Proportion of Significant F-Tests
0.2.4.6.8 1
% of Sig. Estimates
1992-1994
1995-1997
1998-2000
2001-2003
2004-2006
2007-2009
2010-2012
LDC Sample
Real Global Fin. Global Cross-link Domestic
0.2.4.6.8 1
% of Sig. Estimates
1992-1994
1995-1997
1998-2000
2001-2003
2004-2006
2007-2009
2010-2012
LDC Sample
Real Global Fin. Global
Cross-link Domestic
0.2.4.6.8 1
% of Sig. Estimates
1992-1994
1995-1997
1998-2000
2001-2003
2004-2006
2007-2009
2010-2012
LDC Sample
Real Global Fin. Global Cross-link Domestic 0.2.4.6.8 1
% of Sig. Estimates
1992-1994
1995-1997
1998-2000
2001-2003
2004-2006
2007-2009
2010-2012
LDC Sample
Real Global Fin. Global
Cross-link Domestic
Policy Interest Rate Stock Market Price Changes
Sovereign Term Spread REER
First-Step Estimates: Summary
• The link with the CEs has been dominant for developing and emerging market economies in the last two decades
• The movements of policy interest rate and term spreads are more sensitive to global financial shocks in the late 1990s through early 2000s and since 2008
• China does not exert substantial influence in
financial markets
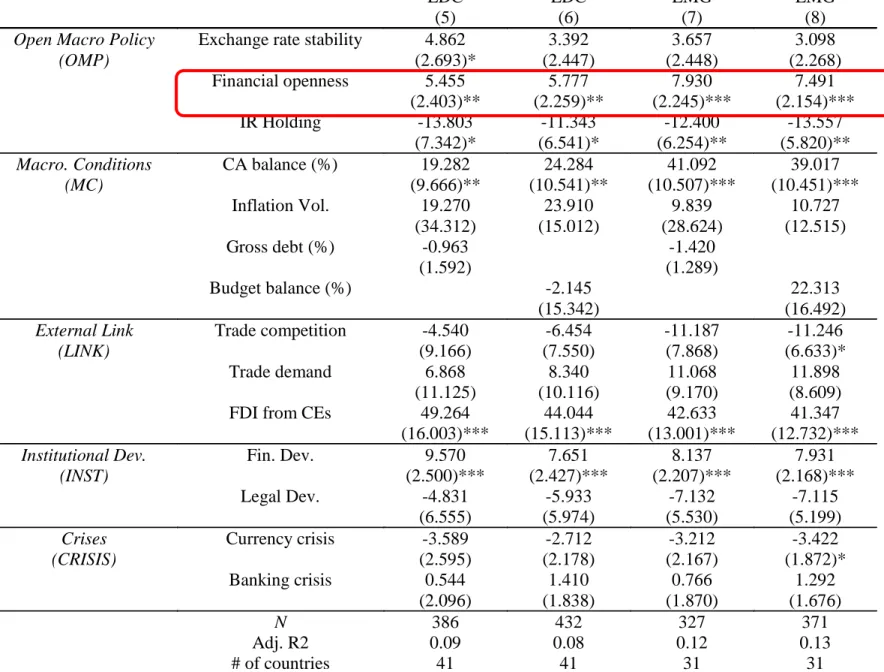
Table 1-1: Factors Affecting Policy Interest Rate Sensitivity, 1986-2012
LDC LDC EMG EMG
(5) (6) (7) (8)
Open Macro Policy Exchange rate stability 4.862 3.392 3.657 3.098
(OMP) (2.693)* (2.447) (2.448) (2.268)
Financial openness 5.455 5.777 7.930 7.491
(2.403)** (2.259)** (2.245)*** (2.154)***
IR Holding -13.803 -11.343 -12.400 -13.557
(7.342)* (6.541)* (6.254)** (5.820)**
Macro. Conditions CA balance (%) 19.282 24.284 41.092 39.017
(MC) (9.666)** (10.541)** (10.507)*** (10.451)***
Inflation Vol. 19.270 23.910 9.839 10.727
(34.312) (15.012) (28.624) (12.515)
Gross debt (%) -0.963 -1.420
(1.592) (1.289)
Budget balance (%) -2.145 22.313
(15.342) (16.492)
External Link Trade competition -4.540 -6.454 -11.187 -11.246
(LINK) (9.166) (7.550) (7.868) (6.633)*
Trade demand 6.868 8.340 11.068 11.898
(11.125) (10.116) (9.170) (8.609)
FDI from CEs 49.264 44.044 42.633 41.347
(16.003)*** (15.113)*** (13.001)*** (12.732)***
Institutional Dev. Fin. Dev. 9.570 7.651 8.137 7.931
(INST) (2.500)*** (2.427)*** (2.207)*** (2.168)***
Legal Dev. -4.831 -5.933 -7.132 -7.115
(6.555) (5.974) (5.530) (5.199)
Crises Currency crisis -3.589 -2.712 -3.212 -3.422
(CRISIS) (2.595) (2.178) (2.167) (1.872)*
Banking crisis 0.544 1.410 0.766 1.292
(2.096) (1.838) (1.870) (1.676)
N 386 432 327 371
Adj. R2 0.09 0.08 0.12 0.13
# of countries 41 41 31 31
Table 1-2: Factors Affecting Stock Market Sensitivity, 1986-2012
LDC LDC EMG EMG
(5) (6) (7) (8)
Open Macro Policy Exchange rate stability -0.291 -0.189 -0.318 -0.220
(OMP) (0.124)** (0.125) (0.139)** (0.139)
Financial openness -0.207 -0.101 -0.089 0.013
(0.101)** (0.113) (0.116) (0.126)
IR Holding 0.133 -0.027 0.216 0.057
(0.302) (0.326) (0.330) (0.368)
Macro. Conditions CA balance (%) -0.104 0.341 -0.047 0.381
(MC) (0.384) (0.475) (0.545) (0.585)
Inflation Vol. 2.111 1.341 1.400 1.111
(1.618) (0.695)* (1.691) (0.716)
Gross debt (%) 0.171 0.175
(0.066)*** (0.068)**
Budget balance (%) -0.714 -0.840
(0.703) (0.963)
External Link Trade competition 0.692 0.712 0.441 0.490
(LINK) (0.368)* (0.399)* (0.404) (0.434)
Trade demand -0.038 -0.003 0.178 0.198
(0.452) (0.477) (0.473) (0.503)
FDI from CEs -1.040 -0.431 -1.270 -0.626
(0.606)* (0.651) (0.626)** (0.676)
Institutional Dev. Fin. Dev. -0.202 -0.154 -0.154 -0.108
(INST) (0.101)** (0.112) (0.110) (0.120)
Legal Dev. 0.008 -0.282 -0.015 -0.329
(0.265) (0.276) (0.276) (0.287)
Crises Currency crisis -0.052 -0.032 -0.058 -0.038
(CRISIS) (0.115) (0.109) (0.118) (0.112)
Banking crisis 0.008 -0.002 -0.003 -0.023
(0.083) (0.085) (0.092) (0.094)
N 325 357 290 322
Adj. R2 0.05 0.03 0.03 0.01
# of countries 31 31 26 26
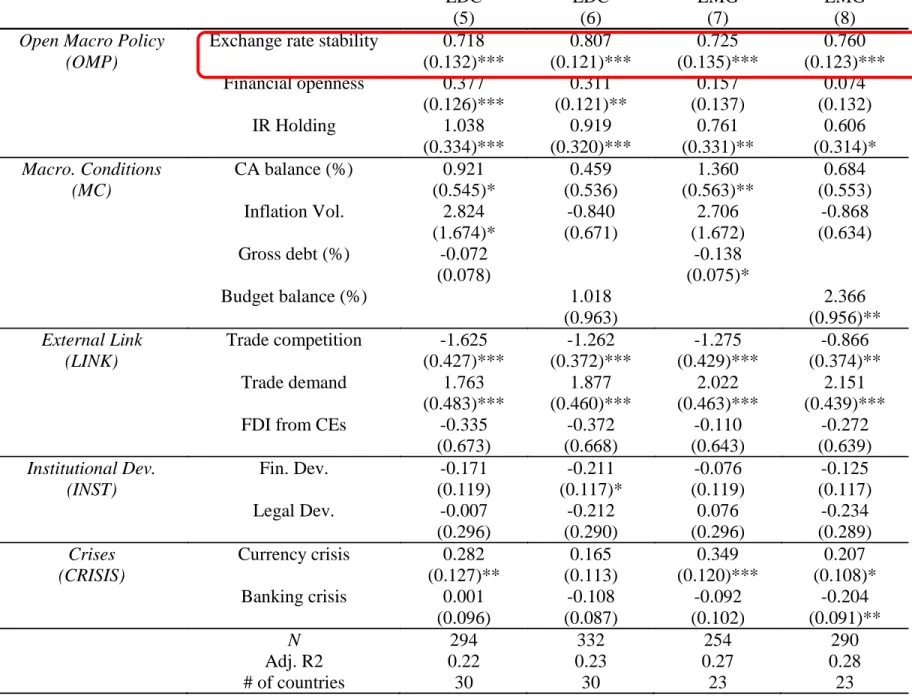
Table 1-3: Factors Affecting REER Sensitivity, 1986-2012
LDC LDC EMG EMG
(5) (6) (7) (8)
Open Macro Policy
Exchange rate stability 0.718 0.807 0.725 0.760
(OMP)
(0.132)*** (0.121)*** (0.135)*** (0.123)***
Financial openness 0.377 0.311 0.157 0.074
(0.126)*** (0.121)** (0.137) (0.132)
IR Holding 1.038 0.919 0.761 0.606
(0.334)*** (0.320)*** (0.331)** (0.314)*
Macro. Conditions
CA balance (%) 0.921 0.459 1.360 0.684
(MC)
(0.545)* (0.536) (0.563)** (0.553)
Inflation Vol. 2.824 -0.840 2.706 -0.868
(1.674)* (0.671) (1.672) (0.634)
Gross debt (%) -0.072 -0.138
(0.078) (0.075)*
Budget balance (%) 1.018 2.366
(0.963) (0.956)**
External Link
Trade competition -1.625 -1.262 -1.275 -0.866
(LINK)
(0.427)*** (0.372)*** (0.429)*** (0.374)**
Trade demand 1.763 1.877 2.022 2.151
(0.483)*** (0.460)*** (0.463)*** (0.439)***
FDI from CEs -0.335 -0.372 -0.110 -0.272
(0.673) (0.668) (0.643) (0.639)
Institutional Dev.
Fin. Dev. -0.171 -0.211 -0.076 -0.125
(INST)
(0.119) (0.117)* (0.119) (0.117)
Legal Dev. -0.007 -0.212 0.076 -0.234
(0.296) (0.290) (0.296) (0.289)
Crises
Currency crisis 0.282 0.165 0.349 0.207
(CRISIS)
(0.127)** (0.113) (0.120)*** (0.108)*
Banking crisis 0.001 -0.108 -0.092 -0.204
(0.096) (0.087) (0.102) (0.091)**
N
294 332 254 290
Adj. R2 0.22 0.23 0.27 0.28
# of countries 30 30 23 23
Summary
• An economy that pursues greater
exchange rate stability and financial
openness would face a stronger link
with the center economies through
policy interest rates and real effective
exchange rate movements
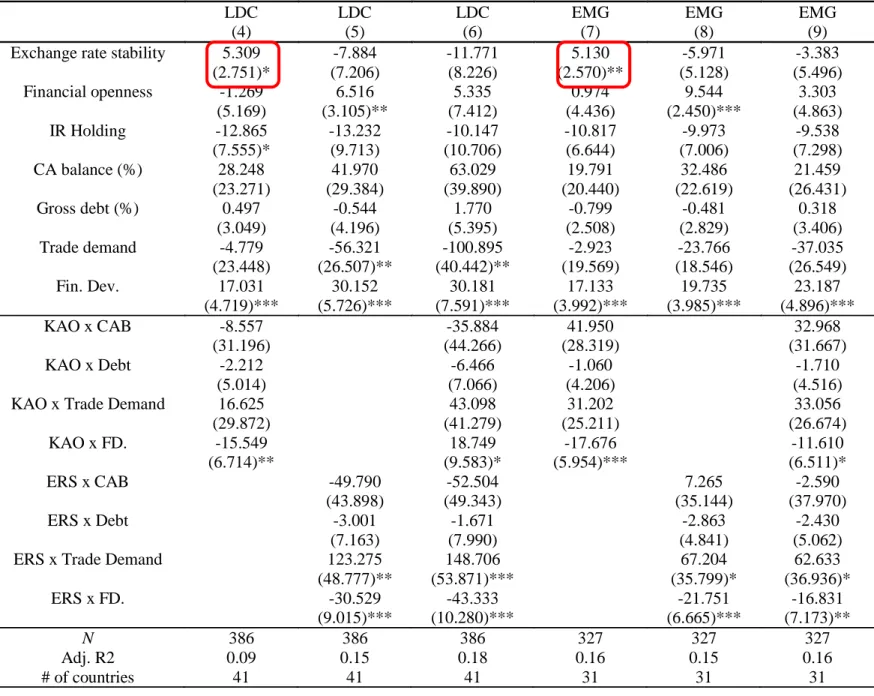
Table 2-1: Interactive Effects and Interest Rate Sensitivity
LDC LDC LDC EMG EMG EMG
(4) (5) (6) (7) (8) (9)
Exchange rate stability 5.309 -7.884 -11.771 5.130 -5.971 -3.383
(2.751)* (7.206) (8.226) (2.570)** (5.128) (5.496)
Financial openness -1.269 6.516 5.335 0.974 9.544 3.303
(5.169) (3.105)** (7.412) (4.436) (2.450)*** (4.863)
IR Holding -12.865 -13.232 -10.147 -10.817 -9.973 -9.538
(7.555)* (9.713) (10.706) (6.644) (7.006) (7.298)
CA balance (%) 28.248 41.970 63.029 19.791 32.486 21.459
(23.271) (29.384) (39.890) (20.440) (22.619) (26.431)
Gross debt (%) 0.497 -0.544 1.770 -0.799 -0.481 0.318
(3.049) (4.196) (5.395) (2.508) (2.829) (3.406)
Trade demand -4.779 -56.321 -100.895 -2.923 -23.766 -37.035
(23.448) (26.507)** (40.442)** (19.569) (18.546) (26.549)
Fin. Dev. 17.031 30.152 30.181 17.133 19.735 23.187
(4.719)*** (5.726)*** (7.591)*** (3.992)*** (3.985)*** (4.896)***
KAO x CAB -8.557 -35.884 41.950 32.968
(31.196) (44.266) (28.319) (31.667)
KAO x Debt -2.212 -6.466 -1.060 -1.710
(5.014) (7.066) (4.206) (4.516)
KAO x Trade Demand 16.625 43.098 31.202 33.056
(29.872) (41.279) (25.211) (26.674)
KAO x FD. -15.549 18.749 -17.676 -11.610
(6.714)** (9.583)* (5.954)*** (6.511)*
ERS x CAB -49.790 -52.504 7.265 -2.590
(43.898) (49.343) (35.144) (37.970)
ERS x Debt -3.001 -1.671 -2.863 -2.430
(7.163) (7.990) (4.841) (5.062)
ERS x Trade Demand 123.275 148.706 67.204 62.633
(48.777)** (53.871)*** (35.799)* (36.936)*
ERS x FD. -30.529 -43.333 -21.751 -16.831
(9.015)*** (10.280)*** (6.665)*** (7.173)**
N 386 386 386 327 327 327
Adj. R2 0.09 0.15 0.18 0.16 0.15 0.16
# of countries 41 41 41 31 31 31
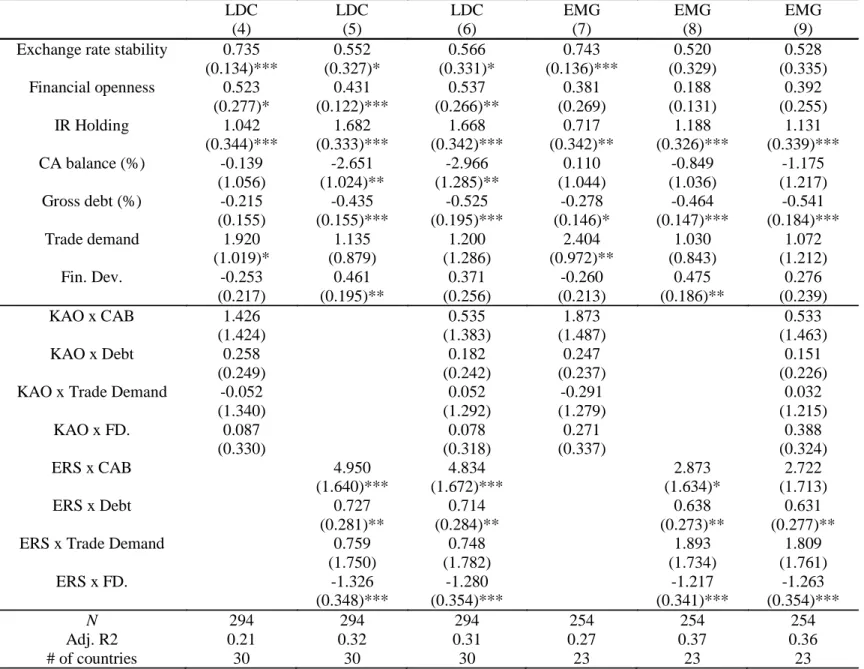
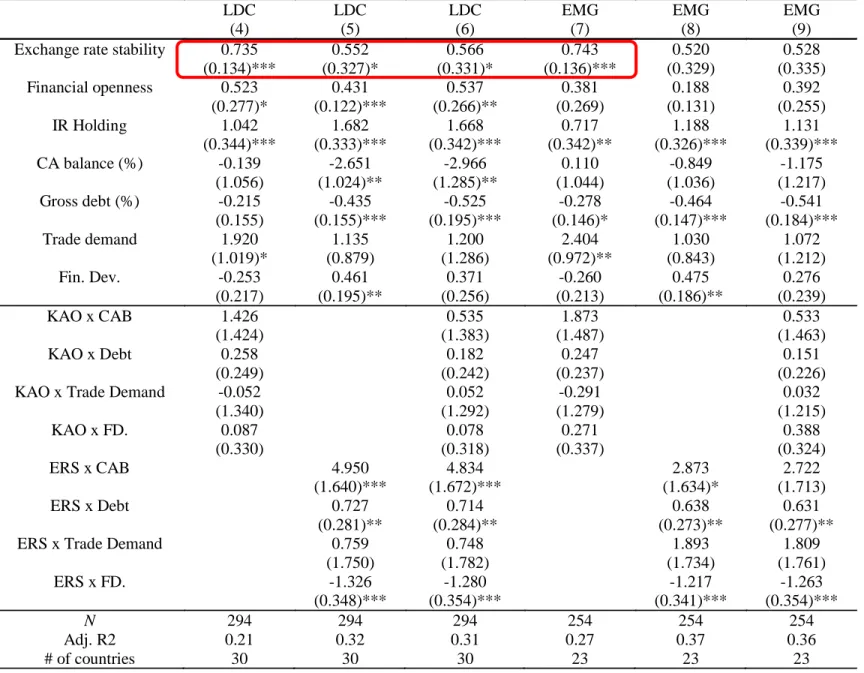
Table 2-3: Interactive Effects and REER Sensitivity
LDC LDC LDC EMG EMG EMG
(4) (5) (6) (7) (8) (9)
Exchange rate stability 0.735 0.552 0.566 0.743 0.520 0.528
(0.134)*** (0.327)* (0.331)* (0.136)*** (0.329) (0.335)
Financial openness 0.523 0.431 0.537 0.381 0.188 0.392
(0.277)* (0.122)*** (0.266)** (0.269) (0.131) (0.255)
IR Holding 1.042 1.682 1.668 0.717 1.188 1.131
(0.344)*** (0.333)*** (0.342)*** (0.342)** (0.326)*** (0.339)***
CA balance (%) -0.139 -2.651 -2.966 0.110 -0.849 -1.175
(1.056) (1.024)** (1.285)** (1.044) (1.036) (1.217)
Gross debt (%) -0.215 -0.435 -0.525 -0.278 -0.464 -0.541
(0.155) (0.155)*** (0.195)*** (0.146)* (0.147)*** (0.184)***
Trade demand 1.920 1.135 1.200 2.404 1.030 1.072
(1.019)* (0.879) (1.286) (0.972)** (0.843) (1.212)
Fin. Dev. -0.253 0.461 0.371 -0.260 0.475 0.276
(0.217) (0.195)** (0.256) (0.213) (0.186)** (0.239)
KAO x CAB 1.426 0.535 1.873 0.533
(1.424) (1.383) (1.487) (1.463)
KAO x Debt 0.258 0.182 0.247 0.151
(0.249) (0.242) (0.237) (0.226)
KAO x Trade Demand -0.052 0.052 -0.291 0.032
(1.340) (1.292) (1.279) (1.215)
KAO x FD. 0.087 0.078 0.271 0.388
(0.330) (0.318) (0.337) (0.324)
ERS x CAB 4.950 4.834 2.873 2.722
(1.640)*** (1.672)*** (1.634)* (1.713)
ERS x Debt 0.727 0.714 0.638 0.631
(0.281)** (0.284)** (0.273)** (0.277)**
ERS x Trade Demand 0.759 0.748 1.893 1.809
(1.750) (1.782) (1.734) (1.761)
ERS x FD. -1.326 -1.280 -1.217 -1.263
(0.348)*** (0.354)*** (0.341)*** (0.354)***
N 294 294 294 254 254 254
Adj. R2 0.21 0.32 0.31 0.27 0.37 0.36
# of countries 30 30 30 23 23 23
MM-MM Estimation (a) Effect of Financial Development
(+10 ppt) KAOPEN*
0.00 0.50 1.00 ERS* 0.00 3.02 3.96 4.89 0.50 0.85 1.79 2.73 1.00 -1.32 -0.38 0.56
(b) Effect of Trade Demand (+5 ppt)
KAOPEN
0.00 0.50 1.00 ERS* 0.00 -5.04 -3.97 -2.89
0.50 -1.33 -0.25 0.83 1.00 2.39 3.47 4.55
SMT-SMT Estimation (c) Effect of Trade Demand (+5 ppt)
KAOPEN
0.00 0.50 1.00 ERS* 0.00 -0.07 -0.07 -0.08
0.50 0.01 0.01 0.00 1.00 0.10 0.09 0.09
REER-REER Estimation (e) Effect of CAB Deterioration
(–2 ppt) KAOPEN
0.00 0.50 1.00 ERS* 0.00 0.06 0.05 0.05
0.50 0.01 0.01 0.00 1.00 -0.04 -0.04 -0.05
(f) Effect of Gross Debt (+10 ppt)
KAOPEN
0.00 0.50 1.00 ERS* 0.00 -0.05 -0.04 -0.03
0.50 -0.02 -0.01 0.00 1.00 0.02 0.03 0.04
(g) Effect of Financial Development (+10 ppt)
KAOPEN
0.00 0.50 1.00 ERS* 0.00 0.04 0.04 0.04 0.50 -0.03 -0.02 -0.02 1.00 -0.09 -0.09 -0.08
0 1 ERS 2 KAOPEN X
Summary
• Greater import demand for a developing
country increases policy interest rate or stock market price correlations when the exchange rate stability is greater
• Greater exchange rate stability also amplifies
the impact of greater gross debt on the REER
link
What about the link between
• Country i’s Exchange Market Pressure (EMP) and
• The CE’s financial variables, i.e., o policy interest rates
o REER o EMP
• We repeat the two-step approach
• The gamma now refers to the correlation between the EMP and the CE’s financial variables
• The CE’s REER matters more than policy interest
rates
Table 5: Exchange Market Pressure Sensitivity to Core Economies’ Conditions, 1986-2012
Corr. b/w CE’s MM and Countries’ EMP Corr. b/w CE’s REER and Countries’
EMP
Corr. b/w CE’s EMP and Countries’
EMP
FULL LDC EMG FULL LDC EMG FULL LDC EMG
(1) (2) (3) (4) (5) (6) (7) (8) (9)
Exchange rate stability -186.31 -84.62 -161.73 8.351 19.587 18.713 -0.277 0.402 0.439
(171.16) (371.54) (314.44) (6.225) (6.890)*** (7.407)** (0.220) (0.302) (0.322)
Financial openness 51.15 -258.35 -262.67 -10.296 -21.161 -17.558 -0.204 0.097 0.118
(153.17) (331.24) (272.59) (5.571)* (6.143)*** (6.421)*** (0.197) (0.269) (0.280)
IR Holding 561.50 1,090.15 888.59 -20.095 -14.726 -6.901 0.460 -0.058 -0.087
(245.98)** (487.00)** (427.27)** (8.947)** (9.031) (10.064) (0.317) (0.395) (0.438)
CA balance (%) -593.36 -2,641.66 -652.60 59.261 67.269 28.283 1.191 0.973 2.029
(1,051.28) (1,780.93) (1,482.22) (38.237) (33.026)** (34.914) (1.353) (1.446) (1.520)
Gross debt (%) -156.83 -313.78 -240.79 -5.544 -2.352 -0.804 -0.029 -0.281 -0.357
(131.08) (241.32) (191.05) (4.768) (4.475) (4.500) (0.169) (0.196) (0.196)*
Trade demand -537.11 -1,027.42 -2,726.26 39.433 8.589 14.270 -2.600 -3.573 -3.522
(992.73) (1,784.10) (1,478.31)* (36.107) (33.085) (34.822) (1.278)** (1.448)** (1.516)**
Fin. Dev. -250.45 -500.85 -276.97 -11.077 -10.351 -12.094 0.827 0.495 0.240
(202.33) (342.08) (280.57) (7.359) (6.344) (6.609)* (0.260)*** (0.278)* (0.288)
KAO x CAB -1,912.78 -2,522.00 -817.90 -54.082 -24.893 -68.213 -3.164 -3.496 -2.907
(1,103.96)* (1,990.26) (1,803.57) (40.153) (36.908) (42.483) (1.421)** (1.616)** (1.849)
KAO x Debt -122.31 -129.68 -39.58 5.922 -7.144 -5.077 -0.108 -0.170 -0.198
(147.74) (312.96) (251.57) (5.373) (5.804) (5.926) (0.190) (0.254) (0.258)
KAO x Trade Demand -32.80 748.99 984.54 -21.672 18.136 -0.896 4.677 5.619 5.333
(1,022.77) (1,834.10) (1,487.89) (37.200) (34.012) (35.047) (1.317)*** (1.489)*** (1.526)***
KAO x FD. 514.79 56.77 -304.72 -8.619 -16.551 -19.001 -0.635 -0.326 -0.243
(216.95)** (427.73) (364.40) (7.891) (7.932)** (8.584)** (0.279)** (0.347) (0.374)
ERS x CAB 4,295.00 6,439.94 2,488.60 -65.220 -108.129 -1.265 3.797 4.131 1.684
(1,219.04)*** (2,204.84)*** (2,141.21) (44.338) (40.888)*** (50.437) (1.569)** (1.790)** (2.196)
ERS x Debt 269.16 508.41 298.50 6.127 10.041 6.626 -0.013 0.313 0.431
(188.07) (358.44) (286.88) (6.840) (6.647) (6.758) (0.242) (0.291) (0.294)
ERS x Trade Demand 2,276.38 3,485.31 4,992.84 -75.257 -90.629 -89.484 -1.263 -2.984 -2.035
(1,168.05)* (2,392.58) (2,099.68)** (42.484)* (44.369)** (49.458)* (1.504) (1.942) (2.153)
ERS x FD. -783.07 -502.29 97.01 17.335 26.167 32.941 -0.510 -0.038 0.225
(254.94)*** (471.76) (426.71) (9.273)* (8.749)*** (10.051)*** (0.328) (0.383) (0.438)
N 625 382 321 625 382 320 625 382 321
Adj. R2 0.23 0.22 0.13 0.16 0.18 0.16 0.22 0.31 0.32
# of countries 59 40 30 59 40 30 59 40 30