Compared to cash flow news, discount news is not a major driver of Swiss stock market returns. Neither of the two GVD components alone predicts that the Swiss stock market will achieve out-of-sample returns.
3 Asset return predictability: data and descrip- tive statistics
Dependent variables
As a proxy for the Swiss stock market index, we use the Swiss MSCI total return index expressed in CHF. As a proxy for the Swiss bond market index, we use the Citigroup World Bond Index Switzerland, which is constructed on the assumption that coupon payments are reinvested in the index.
Predictors of asset returns
- Standard predictors
- GVD (“Goliath versus David”)
When the market value of small companies falls in relation to the market value of large companies, this means that GVD basically measures the total return for the L largest companies in relation to the total return on the market portfolio.
Descriptive statistics
- Dependent variables
- Predictors of asset returns
The appendix provides additional information on the Swiss stock market (basically M and its variation over time) and results obtained with other definitions of GVD (varying L). For example, the absolute values of the pairwise correlation coefficients between the dividend-price ratio, the price-earnings ratio and the payout yield are close to 0.8.
4 Predicting stock and bond market returns
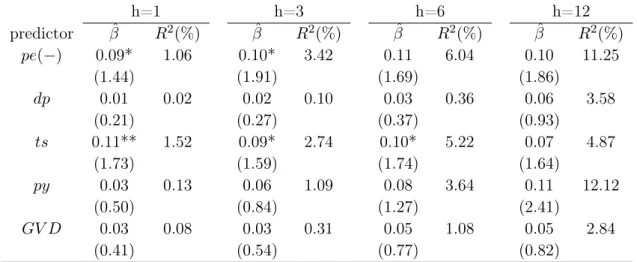
In-sample predictability
Only price-earnings ratio and GVD exhibit in-sample predictive power for Swiss stock market returns. At the forecast horizon of one month ahead, the price-earnings ratio exhibits the largest estimate of βˆ.
Out-of-sample predictability
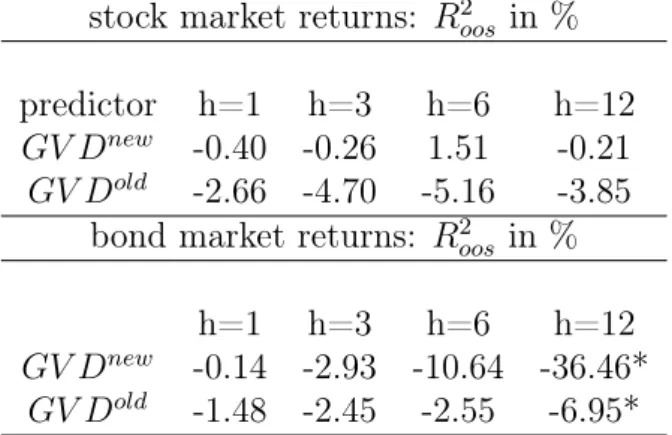
With the exception of the term spread and the price-to-earnings ratio, none of the other variables show any sign of predictive power for excessive Swiss bond returns. We evaluate the predictive power of the out-of-sample forecasters for the forecast period starting in January 2008 (tOOS), that is, the forecast evaluation period is from January 1999 to December 2007.
Is the predictive power stable over time?
We reject the null for the stability of the GVD regression coefficient at all forecast horizons. Therefore, rather than explaining why we find relatively little forecast ability for most of the predictions examined, the test results presented in Table (7) confront us with another puzzle.
5 A closer look at GVD
- GVD and its components
- The components of GVD and the predictability of stock and bond returns
- Predictability of cash-flow or discount-rate news?
- Predictability of the state of the economy?
- Is the predictive power of GVD components stable over time?
None of the point estimates for GV Dnew and GV Dold are significantly different from zero. The results of the out-of-sample predictions presented in Table (10) suggest that this is not the case. The two components of the Swiss version of GVD are virtually uncorrelated with each other and thus appear to capture different information about future stock returns.
We evaluate this hypothesis through a regression of the cash flow news and the discount rate (risk premium) driven components of stock and bond market returns on GVD. Moreover, based on the results presented in Sections 5.1 and 5.2, we assess the predictive power of the components of GVD for the two news components of Swiss asset returns. The decomposition of bond market returns into their cash flow and discount rate based news components does not provide further information on this issue.
GVD predicts changes in measures of the state of the US economy (Duarte and Kapadia, 2015). So it is an indirect test of whether cash flow or discount rate of return news of the Swiss stock market can be related to the state of the Swiss economy. These results are broadly consistent with the US data, in that the GVD component that reflects discount rate news also predicts the state of the economy.
6 The impact of global risks on asset return predictability
Time variation in the forecast ability of GVD and global risks
In theory, exchange rate risk in the intertemporal CAPM is represented by all bilateral exchange rates in the world. They show that two risk factors capture all the information about global shocks in foreign exchange markets, i.e., the shocks that matter to capture exchange rate risk in the international CAPM. 2014) empirical version of the international CAPM introduces the return on a world stock market index as its first risk factor.
The third risk factor in Brusa et al. 2014) is the dollar factor, i.e., the average currency return across all US dollar exchange rates. We are interested in the impact of global risk on the predictability of Swiss stock market returns. We provide details on the construction of our versions of the carry factor and the global dollar factor in the appendix.
In addition, GV Dold and GV Dnew forecast different parts of Swiss stock market returns (GV Dnew: cash flow news; GV Dold: discount rate news). This finding reflects that GV Dnew predicts the component of Swiss stock market returns driven by cash flow news. The impact of the global dollar factor appears to be sufficient to render the overall sensitivity of future stock returns to GV Dold insignificant.
Global risks and stock return predictability
In contrast, the interaction term of GV Dold with the global dollar factor always significantly decreases the sensitivity of future stock market returns to GV Dold. However, in contrast to the evidence for GV Dold, the influence of this global foreign exchange rate factor is insufficient to eliminate the predictive power of GV Dnew for future stock market returns. There is no relationship between the time variation of the coefficient from the predictive regressions and world stock market returns.
Overall, the results presented in this subsection suggest that the evidence of time-varying predictive power of GVD for Swiss stock market returns reflects the impact of global exchange rate risk. In addition, our results show that the two global exchange rate risk factors can have opposite effects on the forecasters' ability to predict stock market returns. Focusing first on the left panel of table (15), we observe the predictive power of world stock market returns for Swiss stock market returns.
This finding confirms Rapach et al. 2013), which shows that US stock market returns predict foreign stock market returns. Since the US stock market is the most important component of the world stock market index, our regression results are likely to echo their results. However, the right panel of table (15) suggests that global currency risk has an impact on the predictability of Swiss stock market returns through its effect on GVD.
7 Conclusions
Global foreign exchange risk, as reflected, therefore also has a direct effect on the predictability of Swiss equity returns. This time variation is linked to global foreign exchange risks and thus highlights the importance of global risks to returns on asset markets of small, open economies.
These statistics are normalized by the stock market or bond market total return news variance (NR or NBR) so that they sum to one. Notes: This table presents the descriptive statistics of the predictor variables in the study (Panel A) and their pairwise correlations (Panel B). The adjusted price-earnings ratio, pe, is the log of current Swiss stock prices (the index) minus the log of a 10-year moving average of earnings. The net payout yield, py, is defined as the sum of dividends and share repurchases minus the issuance of new capital by t−∆tto t and normalized by the aggregate capitalization of the stock market at t.
Finally, we look at GVD, which is defined as the change in the share of the largest firms in the aggregate Swiss stock market from t−∆t to t. Notes: This table presents OLS estimates from univariate regressions of Swiss stock market returns for each potential predictor variable described in table (3). Notes: This table reports the out-of-sample R2 statistic (Roos2) proposed by Campbell and Thompson (2008) from out-of-sample forecasts of Swiss stock market returns.
Notes: This table reports the out-of-sample R2 statistic (R2oos) proposed by Campbell and Thompson (2008) from out-of-sample forecasts of Swiss stock market returns. Notes: This table presents OLS estimates from h-month-ahead regressions of stock market returns for the two GVD components (GV Dnew and GV Dold) assuming that the regression coefficients (and hence the predictive power) change over time. This time variation is modeled as a linear function of three global risk factors: the global stock market return denominated in local currencies (global), the carry factor (foreign currency) (carry) and the global dollar factor (dollarglobal).
For example, w is defined as w= 1 +σ(world)worldt, where σ represents the standard deviation and world is the "raw" world stock market return. Notes: The top panel of this table reports OLS estimates from h-month-ahead regressions of stock market returns against three global risk factors: the global stock index return (world), the carry factor (foreign currency) (carry), and the global dollar factor (dollarglobal). .

Appendix
Swiss stock market and GVD
However, despite the recent decline in the number of firms, the total market capitalization of the Swiss stock market has increased in recent years. This is reflected in the descriptive statistics of GVD presented in table 3 in the main body of the paper. The average value of GVD is negative, indicating that the total market capitalization of the total market (mainly composed of small firms) has grown more than the market capitalization of the largest firms.
But on average, the 50 largest companies make up close to 90% of the total stock market value. Our base version of GVD focuses on the 50 largest companies in the Swiss stock market relative to the overall market, the GV D50. Notes: This table presents OLS estimates from univariate regressions of one-month forward Swiss stock and bond market returns on GVD constructed with data from the 25 (GV D25) or 75 (GV D75) largest companies on the Swiss stock market.
We use two global foreign currency risk factors in our estimates of the impact of global risks on the predictability of Swiss assets. Taking the difference between the returns on the higher and lower dollar-beta portfolios eliminates US-specific risks and thus can be interpreted as the global component of the dollar factor. Table (19) provides some descriptive statistics of the returns of the two global foreign currency risk factors over our sample period from January 1999 to August 2016.