Comprehensive Analysis of Genome
Rearrangements in Eight Human Malignant
Tumor Tissues
Stefanie Marczok☯, Birgit Bortz☯, Chong Wang, Heike Pospisil
*
University of Applied Sciences Wildau, High Performance Computing in Life Sciences, Institute for Applied Biosciences, Wildau, Germany
☯These authors contributed equally to this work.
Abstract
Carcinogenesis is a complex multifactorial, multistage process, but the precise mechanisms are not well understood. In this study, we performed a genome-wide analysis of the copy number variation (CNV), breakpoint region (BPR) and fragile sites in 2,737 tumor samples from eight tumor entities and in 432 normal samples. CNV detection and BPR identification revealed that BPRs tended to accumulate in specific genomic regions in tumor samples whereas being dispersed genome-wide in the normal samples. Hotspots were observed, at which segments with similar alteration in copy number were overlapped along with BPRs adjacently clustered. Evaluation of BPR occurrence frequency showed that at least one was detected in about and more than 15% of samples for each tumor entity while BPRs were maximal in 12% of the normal samples. 127 of 2,716 tumor-relevant BPRs (termed ‘common BPRs’) exhibited also a noticeable occurrence frequency in the normal samples. Colocalization assessment identified 20,077 CNV-affecting genes and 169 of these being known tumor-related genes. The most noteworthy genes areKIAA0513important for immu-nologic, synaptic and apoptotic signal pathways, intergenic non-coding RNA
RP11-115C21.2possibly acting as oncogene or tumor suppressor by changing the structure of chromatin, andADAM32likely importance in cancer cell proliferation and progression by ectodomain-shedding of diverse growth factors, and the well-known tumor suppressor gene
p53. The BPR distributions indicate that CNV mutations are likely non-random in tumor genomes. The marked recurrence of BPRs at specific regions supports common progres-sion mechanisms in tumors. The presence of hotspots together with common BPRs, despite its small group size, imply a relation between fragile sites and cancer-gene alter-ation. Our data further suggest that both protein-coding and non-coding genes possessing a range of biological functions might play a causative or functional role in tumor biology. This research enhances our understanding of the mechanisms for tumorigenesis and progression.
a11111
OPEN ACCESS
Citation:Marczok S, Bortz B, Wang C, Pospisil H (2016) Comprehensive Analysis of Genome Rearrangements in Eight Human Malignant Tumor Tissues. PLoS ONE 11(7): e0158995. doi:10.1371/ journal.pone.0158995
Editor:Amanda Ewart Toland, Ohio State University Medical Center, UNITED STATES
Received:December 8, 2015
Accepted:June 25, 2016
Published:July 8, 2016
Copyright:© 2016 Marczok et al. This is an open access article distributed under the terms of the Creative Commons Attribution License, which permits unrestricted use, distribution, and reproduction in any medium, provided the original author and source are credited.
Data Availability Statement:All relevant data are within the paper and its Supporting Information files.
Introduction
The incidence of tumor increases rapidly with aging [1,2], but the tumorigenesis is probably caused mainly by genetic preloads, bad environmental conditions and lifestyle behaviors [1,3]. Cells affected by somatic mutations develop the typical hallmarks of cancer: sustaining prolifer-ative signaling, evading growth suppressors, activating invasion and metastasis, enabling repli-cative immortality, inducing angiogenesis and resisting cell death [4]. Unrepaired genetic variations have long been thought associated with carcinogenesis [4,5]. One type of genomic aberrations is copy number variation (CNV) that leads to an altered number (fewer or more) of copies of a genomic region in comparison with a reference genome. CNV arises from diverse mechanisms including nonallelic homologous recombination (NAHR), nonhomologous end joining (NHEJ) and fork stalling and template switching/microhomology-mediated break-induced replication (FoSTeS/MMBIR) during replication or recombination [6–8].
Previous studies [6,9–13] have detected an increased number of CNVs in human malignant tumors and found a functional correlation of CNVs with tumorigenesis. For example, Gratias et al. [9] reported small deletions in retinoblastomas and CNVs at chromosomal band 16q24 known to encompass among others geneKIAA0513. TheKIAA0513gene has been postulated to play an important role in immunologic, synaptic and apoptotic signal pathways [10]. Yang et al. [11] observed an increase of overall CNV burden in familial colorectal cancer patients compared with healthy controls as well as a novel structural variation at 12p12.3, suggesting a contribution of the overall burden of CNVs to familial colorectal cancer risk.TP53, also known as cellular tumor antigen p53, is involved in growth suppression and apoptosis. Several studies [11,14–18] identified a remarkable number of CNVs characteristic ofTP53-related tumors in Li-Fraumeni syndrome, an autosomal dominantly inherited disorder characterized by a variety of early-onset tumors. CNV breakpoints, forming a boundary between two copy number altered regions, have gained increasing attention in the mechanistic studies of tumorigenesis [19]. Li et al. [20] have identified cancer-type-specific breakpoint hotspots with distinct genomic pat-terns and found that these hotspots are enriched with known cancer genes. In an earlier study [13], we detected an increasing number of CNVs during tumor progression and identified some distinct breakpoint regions (BPRs) arising more frequently than other BPRs (e.g. fragile sites) in mouse mammary tumor. Our findings indicate that higher numbers of copy number alterations lead to an increased cancer risk [13]. In constrast, a recent work of Stewart et al. [3] supposed that tumor inducing mutations occur by chance and are readily inducible at common fragile sites. In a more recent study, Tomasetti et al. [21] showed that only one third of cancer cases are attributable to environmental factors or inherited predispositions. The evidence suggests that random mutations in regulatory genomic regions during cell division and the faulty repair mechanisms play the predominant role in carcinogenesis. These findings raise intriguing ques-tion regarding causal factors leading to cancer and the predictability of malignant events.
In the present study, we analyzed the influence of CNVs, BPRs and fragile sites on cancer development. In doing so, we investigated copy number altered regions and BPRs in 2,737 tumor samples from eight different tumor entities as well as in 432 normal samples from sev-eral tissue types including brain, gastric, lung, ovarian, prostate and renal tissues. Additionally, we evaluated the occurrences of tumor entity-specific, cancer-specific and common BPRs that would serve as a helpful clue to the mechanisms of tumorigenesis and tumor progression.
Materials and Methods
Data sets
To undertake a comprehensive analysis, a large number of tumor samples from more than one tumor entity with a high resolution must be analyzed. So far, the best resolution of genomic Competing Interests:The authors have declared
data is provided by next-, second- or third-generation sequencing technologies; however, these methods are very expensive and time consuming. A much cheaper and widely used alternative is represented by SNP arrays with a pretty good ratio of physical coverage and evaluating speed [22]. Moreover, there exists a huge pool of freely available data.
Malignant tumor data: The tumor data used for the genome-wide identification of CNVs and BPRs were taken from the publicly accessible Gene Expression Omnibus (GEO) database from the National Center for Biotechnology Information (NCBI) [23]. Specifically, raw CEL files from the Genome-Wide Human SNP Array 6.0 were analyzed in this study. Totally, 2,737 malignant primary tumor samples from 8 different tumor entities were used, including 377 breast tumor, 189 colorectal tumor, 340 gastric tumor, 291 lung tumor, 1,104 pediatric medul-loblastoma, 207 ovarian tumor, 120 prostate tumor and 109 renal tumor samples. For a detailed description of the whole data set seeS1 Table.
Reference data: Reference data were retrieved from the International HapMap Project (Phase 3, Release #3) [24,25]. 990 HapMap samples analyzed by the Genome-Wide Human SNP Array 6.0 were taken into account to build a reference set for comparison (S2 Table).
Normal samples: Additionally, 432 normal samples from the GEO database were included in the study: brain tissue—29 samples, gastric tissue—148 samples, lung tissue—62 samples, ovarian tissue—57 samples, prostate tissue—67 samples, renal tissue—69 samples. These sam-ples serve as the standard set for verification of CNV tumor specificity (S3 Tablefor further details).
Algorithms
The detection of CNVs and tumor entity-specific, cancer-specific and common BPRs using SNP signal intensities proceeded through three steps: (1) preprocessing of SNP array raw data, (2) calculation of the logarithmized ratio (log2ratio) of the signal intensities of the tumor
sam-ple and the reference set for each SNP, and (3) segmentation [26,27]. A pipeline was imple-mented to facilitate these tasks. The preprocessing was carried out using the software Affymetrix Power Tool (APT, Linux version 1.16.0) [28] and the subsequent steps were per-formed within the freely available software R (R version 3.0.2) [29]. The segmentation and sub-sequent detection of CNVs and BPRs were performed for each tumor sample separately. All segments are defined by the respective chromosome, the number of encompassed SNPs and the segmental mean signal intensity. Furthermore, the start and end position of each segment is given as the genomic position of the first and last SNP of the segment. For the determination of the genomic position of each SNP, we used human genome hg19/GRCh37 as a reference.
Building the reference: To identify potential genomic alterations we built a reference set derived from 990 HapMap samples. Firstly we used the APT software package for preprocess-ing the raw data. Then the signal intensities for both SNP alleles were added up and the average signal intensity for all reference samples was calculated.
Preprocessing and calculation of signal intensities: All samples were preprocessed sepa-rately by quantile normalisation and a background correction with the Birdseed v2 algorithm provided by APT [11,30]. The default program settings were used in the current study. The over-all signal intensity of each SNP per sample was obtained by over-allele summation afterwards [31].
Segmentation: To detect genomic alteration in malignant tumors, we determined the seg-mentation profile for each sample. This was carried out by calculation of the log2ratio of the
signal intensities of the tumor sample in relation to the reference intensities for each SNP [26,
32]. The chromosomal segmentation of adjacent SNPs with similar log2ratio values for the 22
[13]. The Bioconductor package DNAcopy (version 1.32.0) implements the circular binary seg-mentation algorithm and was used by setting the significance levelαto 0.001, the standard
deviationSDto 0.5“sd.undo”) and the minimal number of markers per segment (“min.width”) to 4.
Identification of copy number altered genomic regions: The resulting segments (repre-senting the respective continuous genomic regions) of all the tumor samples were then further analyzed. The average value for each segment was accorded to its SNP intensity. The SNP intensities for all the samples belonging to each tumor entity were averaged and a mean value for each chromosome was calculated. The difference between each actual SNP intensity value and the chromosomal mean represents an altered copy number. We defined genomic regions with copy number alteration as segments exhibiting a difference of0.1 or-0.1,
respectively.
Determination of genes localized in regions with copy number alteration: The results of the determined regions with copy number alteration were used to discover if any gene could be affected by deleted or amplified genomic regions. The examination was done using the Bio-maRt package (version 2.24.0) [34] in R, which offers access to several data sources including HapMap, HGNC, Ensembl, InterPro and Reactome. In the present study, gene detection was performed with Ensembl (version GRCh37.p13/ release 82).
Breakpoint detection: To detect chromosomal BPRs, we considered the regions of adjacent segments whose segment mean difference was>0.6 (corresponding to 1 copy number based on the log2transformation). A potential BPR was defined as the genomic stretch between the
last SNP position of a segment and the first SNP position of its successive adjacent segment. The actual breakpoint lies somewhere between these two genomic positions, but could not be detected exactly due to the layout of microarrays. For identification of specific BPRs, the num-ber of detected BPRs was counted.
Determination of the different BPR classes: Taking into consideration the occurrence fre-quency of BPRs and whether a BPR appeared also in normal samples, we devided BPRs into four BPR recurrency classes: tumor entity-specific BPR (occurrence is1% in exclusively one tumor entity with or without being found in healthy samples) (1), cancer-specific BPR (occur-rence is1% in more than 25% of the entities and in normal samples<0.5%) (2) and com-mon BPR (occurrence is1% in25% of the entities and0.5% in normal samples) (3), and no cancer-specific BPR (occurrence are<1% in all tumor entities) (4).
Results
Identified BPRs
For all 2,737 tumor samples from eight tumor entities, 64,720 different BPRs were identified, and 7,324 of them in more than one tumor entity. On average, the BPRs span 6,831 bp and the size ranges from 10 bp to 22,757,511 bp. 127 BPRs were detetected in more than 1% of all the samples, 47 BPRs in at least 2% (Table 1) and 10 BPRs in 5% or more of the tumor samples. Furthermore, 8,853 BPRs were found exclusively in the normal samples and 7,695 BPRs in both the tumor and the normal samples (S7 Fig). A list of all the identified BPRs is given inS4
Table.
Tumor entity-specific, cancer-specific and common BPRs
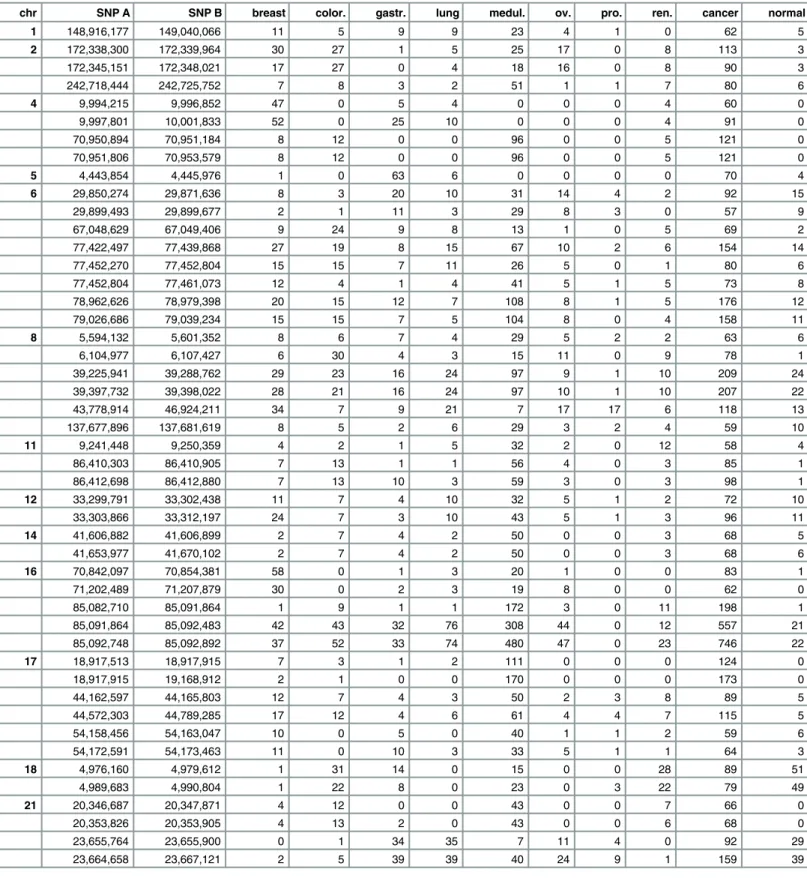
Table 1. 47 Breakpoint regions (BPRs) determined in over 2% of all sample sets.
chr SNP A SNP B breast color. gastr. lung medul. ov. pro. ren. cancer normal
1 148,916,177 149,040,066 11 5 9 9 23 4 1 0 62 5
2 172,338,300 172,339,964 30 27 1 5 25 17 0 8 113 3
172,345,151 172,348,021 17 27 0 4 18 16 0 8 90 3
242,718,444 242,725,752 7 8 3 2 51 1 1 7 80 6
4 9,994,215 9,996,852 47 0 5 4 0 0 0 4 60 0
9,997,801 10,001,833 52 0 25 10 0 0 0 4 91 0
70,950,894 70,951,184 8 12 0 0 96 0 0 5 121 0
70,951,806 70,953,579 8 12 0 0 96 0 0 5 121 0
5 4,443,854 4,445,976 1 0 63 6 0 0 0 0 70 4
6 29,850,274 29,871,636 8 3 20 10 31 14 4 2 92 15
29,899,493 29,899,677 2 1 11 3 29 8 3 0 57 9
67,048,629 67,049,406 9 24 9 8 13 1 0 5 69 2
77,422,497 77,439,868 27 19 8 15 67 10 2 6 154 14
77,452,270 77,452,804 15 15 7 11 26 5 0 1 80 6
77,452,804 77,461,073 12 4 1 4 41 5 1 5 73 8
78,962,626 78,979,398 20 15 12 7 108 8 1 5 176 12
79,026,686 79,039,234 15 15 7 5 104 8 0 4 158 11
8 5,594,132 5,601,352 8 6 7 4 29 5 2 2 63 6
6,104,977 6,107,427 6 30 4 3 15 11 0 9 78 1
39,225,941 39,288,762 29 23 16 24 97 9 1 10 209 24
39,397,732 39,398,022 28 21 16 24 97 10 1 10 207 22
43,778,914 46,924,211 34 7 9 21 7 17 17 6 118 13
137,677,896 137,681,619 8 5 2 6 29 3 2 4 59 10
11 9,241,448 9,250,359 4 2 1 5 32 2 0 12 58 4
86,410,303 86,410,905 7 13 1 1 56 4 0 3 85 1
86,412,698 86,412,880 7 13 10 3 59 3 0 3 98 1
12 33,299,791 33,302,438 11 7 4 10 32 5 1 2 72 10
33,303,866 33,312,197 24 7 3 10 43 5 1 3 96 11
14 41,606,882 41,606,899 2 7 4 2 50 0 0 3 68 5
41,653,977 41,670,102 2 7 4 2 50 0 0 3 68 6
16 70,842,097 70,854,381 58 0 1 3 20 1 0 0 83 1
71,202,489 71,207,879 30 0 2 3 19 8 0 0 62 0
85,082,710 85,091,864 1 9 1 1 172 3 0 11 198 1
85,091,864 85,092,483 42 43 32 76 308 44 0 12 557 21
85,092,748 85,092,892 37 52 33 74 480 47 0 23 746 22
17 18,917,513 18,917,915 7 3 1 2 111 0 0 0 124 0
18,917,915 19,168,912 2 1 0 0 170 0 0 0 173 0
44,162,597 44,165,803 12 7 4 3 50 2 3 8 89 5
44,572,303 44,789,285 17 12 4 6 61 4 4 7 115 5
54,158,456 54,163,047 10 0 5 0 40 1 1 2 59 6
54,172,591 54,173,463 11 0 10 3 33 5 1 1 64 3
18 4,976,160 4,979,612 1 31 14 0 15 0 0 28 89 51
4,989,683 4,990,804 1 22 8 0 23 0 3 22 79 49
21 20,346,687 20,347,871 4 12 0 0 43 0 0 7 66 0
20,353,826 20,353,905 4 13 2 0 43 0 0 6 68 0
23,655,764 23,655,900 0 1 34 35 7 11 4 0 92 29
23,664,658 23,667,121 2 5 39 39 40 24 9 1 159 39
BPRs are provided with their related chromosome (chr), start (SNP A) and end (SNP B) positions, absolute occurrence probability in the tumor entities (breast, color., lung, gastr., medul., ov., pro., ren.), and the total occurrence over all tumor samples (cancer) and in healthy tissue samples (normal), respectively.
Abbreviations: color.—colorectal; gastr.—gastric; medul. -pediatric medulloblastoma; ov.—ovarian; pro.—prostate; ren.—renal
BPRs could be determined 207 times in over 25% of the tumor entities. In addition, 32 BPRs were found to exhibit a dinstinct entity specificity. The noticeable occurrence frequency BPRs (NOF-BPRs) occurred in at least 10% of all the samples of the individual entities.
Common BPRs: Two of common BPRs appeared very frequently in seven out of eight tumor entities: one localized on chromosome 16 between 85,091,864 bp and 85,092,483 bp and the other on the same chromosome from 85,092,748 bp to 85,092,892 bp. The former BPR exists in 9.41 up to 27.90% of all the samples for each entity, but only in 4.86% of all the normal samples. The latter even ranges from 9.71 to 43.48% per tumor entity and was found only in 22 out of 432 normal samples. Other two adjacent interesting BPRs on chromosome 8 (chr8: 39,225,941 bp to 39,288,762 bp and 39,397,732 bp to 39,398,022 bp) were found to occur in all the tumor entities with a frequency up to 12.17% (S4 Table).
Cancer-specific BPRs: One of two cancer-specific BPRs occurring in more than 75% of the tumor entities could be identified in chromosome 8 (6,104,977 bp to 6,107,427 bp) with a fre-quency up to 15.87%. Two BPRs were detected in chromosome 4 (9,994,215 bp to 9,996,852 bp and 9,997,801 bp to 10,001,833 bp) at a mean frequency of 4.75 and 7.06%, respectively, and each in 50% of the tumor entities (S4 Table).
Tumor entity-specific BPRs: However, most BPRs were found to occur frequently in only one tumor entity. For example, a BPR on chromosome 17 (18,917,915 bp to 19,168,912 bp) was detected in 15.40% of all the medulloblastoma samples, but in less than 0.6% of all the sam-ples of the other individual tumor entities (S4 Table).
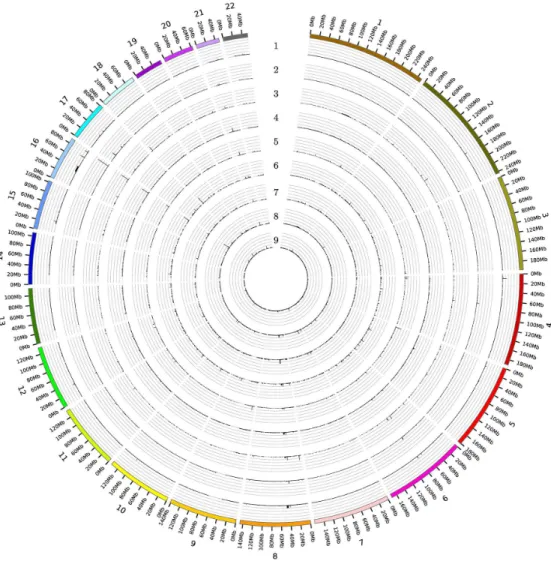
BPRs in healthy tissues: Eight out of the 31 NOF-BPRs were also found in the normal sam-ples with a frequency of 5% (common BPRs), but this amount is in all cases lower than those in the tumor samples. Only two BPRs from the NOF-BPRs set were found on chromosome 18 (4,976,160 bp to 4,979,612 bp and 4,989,683 bp to 4,990,804 bp) at a frequency greater than 10%, but more often detected in the renal and colorectal than the other tumor samples (Fig 1
andTable 2).
Comparison of altered genomic regions within different tumor entities
To recognize a possible influence of genomic alterations on tumorigenesis and progression, the patterns of genomic regions featuring an alteration in copy number were examined to deter-mine if they are overlapped with certain genes. Therefore, the average segment mean for each tumor entity was determined and the genomic regions with an abnormal number of copies were identified. We detected both cancer-specific and tumor entity-specific regions for altered copy number. One genomic region on chromosome 16 (85,091,864 bp to 85,092,748 bp) seemed to be deleted in seven out of eight tumor entities (S1andS2Figs). In six tumor entities (breast, colorectal, lung, ovarian, prostata and renal) the genomic region was between 161,222 bp to 39,397,732 bp on chromosome 8 deleted, in dependence of entity. Additionally, the geno-mic region from 6,689 bp to 18,917,915 bp on chromosome 17 is deleted in malignant tumor tissue by a factor of 0.6, whereas this segment was only slightly reduced (by a factor of 0.1) in breast, colorectal and ovarian tumor samples (S1andS3Figs). In all cases, the copy number is less altered in the normal tissue samples than in at least one type of tumor samples (S5–S13
Tables).
Distribution of BPRs and segments of altered copy number in intragenic
and intergenic regions
(S4 Fig). It is remarkable that the majority of BPRs is completely located within intragenic regions (25%) or within regions overlapping genes and non-coding segments (35-40%) of the human genome. However, the fact that nearly one third of the BPRs occupies intergenic regions indicates altered DNA structures within regulatory or functionally important regions as well as in regions of unknown functionality. The number of affected intergenic regions is very high in breast, gastrointestinal and renal tissues. (S4andS5Figs).
Affected genes in regions of altered copy number
To identify genes localized within the copy number altered regions, 564 (mostly short) seg-ments with continuous and concordant SNP signal intensity alterations were examined. Most of these segments (147) were derived from the ovarian tumor samples and the fewest (16) from the brain (pediatric medulloblastoma) tumor samples. By contrast, only 10 were found in the normal samples. On chromosome 8, longer genomic regions were affected in five different Fig 1. The occurrence of all the BPRs identified for the respective tumor entities and the healthy tissue samples over the full genome.Each circle corresponds to one tissue type (1- brain cancer (pediatric medulloblastoma), 2- breast cancer, 3- colorectal cancer, 4- gastric cancer, 5- lung cancer, 6- ovarian cancer, 7- prostate cancer, 8- renal cancer, 9- healthy tissue). Each gridline correlate to 10%.
tumor entities, but only very short segments in the normal tissues. In renal tumor a remarkably increased number (127) of short (mostly deleted) regions could be observed. It is noticeable that in breast cancer the p-arm of chromosome 1 was mainly amplified and the q-arm almost completely deleted (Fig 2).
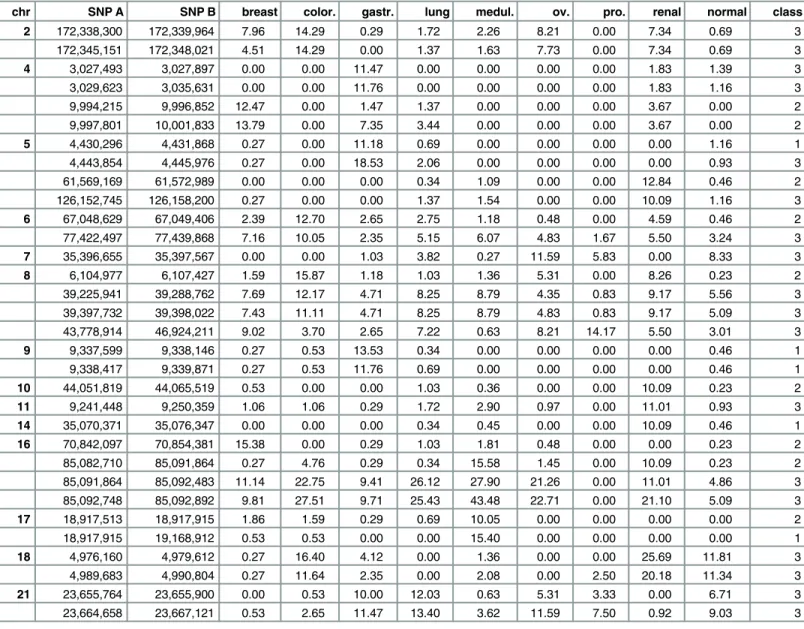
In all the eight tumor entities 20,062 genes within copy number altered regions were identi-fied and 169 of them are described as tumor-associated. The majority of genes was found in Table 2. 32 noticeable occurrence frequency breakpoint regions (NOF-BPRs), which was found in at least 10% of all samples in the single tumor entities and/or the healthy tissues.
chr SNP A SNP B breast color. gastr. lung medul. ov. pro. renal normal class
2 172,338,300 172,339,964 7.96 14.29 0.29 1.72 2.26 8.21 0.00 7.34 0.69 3
172,345,151 172,348,021 4.51 14.29 0.00 1.37 1.63 7.73 0.00 7.34 0.69 3
4 3,027,493 3,027,897 0.00 0.00 11.47 0.00 0.00 0.00 0.00 1.83 1.39 3
3,029,623 3,035,631 0.00 0.00 11.76 0.00 0.00 0.00 0.00 1.83 1.16 3
9,994,215 9,996,852 12.47 0.00 1.47 1.37 0.00 0.00 0.00 3.67 0.00 2
9,997,801 10,001,833 13.79 0.00 7.35 3.44 0.00 0.00 0.00 3.67 0.00 2
5 4,430,296 4,431,868 0.27 0.00 11.18 0.69 0.00 0.00 0.00 0.00 1.16 1
4,443,854 4,445,976 0.27 0.00 18.53 2.06 0.00 0.00 0.00 0.00 0.93 3
61,569,169 61,572,989 0.00 0.00 0.00 0.34 1.09 0.00 0.00 12.84 0.46 2
126,152,745 126,158,200 0.27 0.00 0.00 1.37 1.54 0.00 0.00 10.09 1.16 3
6 67,048,629 67,049,406 2.39 12.70 2.65 2.75 1.18 0.48 0.00 4.59 0.46 2
77,422,497 77,439,868 7.16 10.05 2.35 5.15 6.07 4.83 1.67 5.50 3.24 3
7 35,396,655 35,397,567 0.00 0.00 1.03 3.82 0.27 11.59 5.83 0.00 8.33 3
8 6,104,977 6,107,427 1.59 15.87 1.18 1.03 1.36 5.31 0.00 8.26 0.23 2
39,225,941 39,288,762 7.69 12.17 4.71 8.25 8.79 4.35 0.83 9.17 5.56 3
39,397,732 39,398,022 7.43 11.11 4.71 8.25 8.79 4.83 0.83 9.17 5.09 3
43,778,914 46,924,211 9.02 3.70 2.65 7.22 0.63 8.21 14.17 5.50 3.01 3
9 9,337,599 9,338,146 0.27 0.53 13.53 0.34 0.00 0.00 0.00 0.00 0.46 1
9,338,417 9,339,871 0.27 0.53 11.76 0.69 0.00 0.00 0.00 0.00 0.46 1
10 44,051,819 44,065,519 0.53 0.00 0.00 1.03 0.36 0.00 0.00 10.09 0.23 2
11 9,241,448 9,250,359 1.06 1.06 0.29 1.72 2.90 0.97 0.00 11.01 0.93 3
14 35,070,371 35,076,347 0.00 0.00 0.00 0.34 0.45 0.00 0.00 10.09 0.46 1
16 70,842,097 70,854,381 15.38 0.00 0.29 1.03 1.81 0.48 0.00 0.00 0.23 2
85,082,710 85,091,864 0.27 4.76 0.29 0.34 15.58 1.45 0.00 10.09 0.23 2
85,091,864 85,092,483 11.14 22.75 9.41 26.12 27.90 21.26 0.00 11.01 4.86 3
85,092,748 85,092,892 9.81 27.51 9.71 25.43 43.48 22.71 0.00 21.10 5.09 3
17 18,917,513 18,917,915 1.86 1.59 0.29 0.69 10.05 0.00 0.00 0.00 0.00 2
18,917,915 19,168,912 0.53 0.53 0.00 0.00 15.40 0.00 0.00 0.00 0.00 1
18 4,976,160 4,979,612 0.27 16.40 4.12 0.00 1.36 0.00 0.00 25.69 11.81 3
4,989,683 4,990,804 0.27 11.64 2.35 0.00 2.08 0.00 2.50 20.18 11.34 3
21 23,655,764 23,655,900 0.00 0.53 10.00 12.03 0.63 5.31 3.33 0.00 6.71 3
23,664,658 23,667,121 0.53 2.65 11.47 13.40 3.62 11.59 7.50 0.92 9.03 3
BPRs are provided with their related chromosome (chr), start (SNP A) and end (SNP B) positions, absolute occurrence probability in the tumor entities (breast, color., gastr., lung, medul., ov., pro., renal), and the total occurrence over all tumor samples (cancer) and in healthy tissue samples (normal), respectively, and the related classification of the BPRs (tumor entity-specific (1)—occurrence is1% in exclusively one tumor entity with or without being found in healthy samples, cancer-specific (2)—occurrence is1% in more than 25% of the entities and in normal samples<0.5%, common (3)—
occurrence is1% in25% of the entities and0.5% in normal samples.
Abbreviations: color.—colorectal; gastr.—gastric; medul.—pediatric medulloblastoma; ov.—ovarian; pro.—prostate; ren.—renal
breast and ovarian cancer (10,979 and 9,982, respectively) and the same holds true for associated genes (99 and 86, respectively). The fewest number of impacted genes and tumor-associated genes was encounted in gastric cancer with 66 and 6 genes, respectively. Only seven affected genes were found in the normal samples, but to the best of our knowledge none are associated with cancer (S6 FigandS16 Table). Only one genomic region on chromosome 8, where theADAM(a disintegrin and metalloproteinase)32gene is located, was found to be affected by copy number alteration in all the tumor entities as well as in the normal samples. In seven out of eight tumor entities, the geneKIAA0513was found to be concerned. 12 regions on chromosome 8 and one stretch on chromosome 21 were repeatedly found in six tumor entities. The same 838 gene regions were affected in five tumor entities. 826 of them are located on chromosome 8 and two on chromosome 17 (S14andS15Tables).
Fig 2. All segments with altered copy number over the full genome for the respective tumorentities and the healthy tissue samples.Each circle corresponds to one tissue type (1- brain cancer red(pediatric medulloblastoma), 2- breast cancer, 3- colorectal cancer, 4- gastric cancer, 5- lung cancer, 6- ovarian cancer, 7-prostate cancer, 8- renal cancer, 9- healthy tissues). Alterations are shown with red inner bar for a loss
(deletion) and blue outer bar for a gain (amplification). The bars are localized to the respective genomic positions.
Discussion
Comparison of BPRs and copy number altered segments between
tumor and normal samples
The genome-wide analysis show that the number of the identified BPRs ascertained together with the regions subject to copy number changes in tumor is approximately equal to the num-ber in healthy genomes. But the occurrence of certain BPRs is higher in the tumor entities, while the distribution of BPRs, detected in healthy tissues, are nearly homogeneously distrib-uted over the genome. For the copy number altered segments, the single tumor entities show a higher altered copy number than the healthy tissue. These results are in line with those of pre-vious studies [11,35]. On average, 70 segments per tumor entity were detected and only 10 in the normal samples. The equal number of BPRs in normal tissues in comparison with tumor samples supports the idea that genomic variations, especially CNVs, likely amount to 4.8-9.5% in healthy genomes [36]. In addition to the lower appearance of copy number altered segments in the normal samples we identified within those segments a very low number of affected genes. These affected genes would probably not alter the phenotypic outcome [36] and these are not known as being cancer-associated.
Comparison of identified BPRs and copy number altered segments
between different tumor entities
In the current study, many of the BPRs and copy number altered segments could be repeatedly found in multiple tumor samples and entities. To further investigate whether BPRs and seg-ments with alteration in copy number are tumor entity-specific, cancer-specific or common genomic alterations, we evaluated the differences of these alterations between the eight tumor entities. We were able to find seemingly existing patterns in the genome-wide detected alter-ations as well as BPRs.
Tumor entity-specific BPR: By comparison of three cancer relevant classes, we found that most of the BPRs are tumor entity-specific. Each tumor entity exhibited an individual BPR-pat-tern to a certain extent, possibly indicating that tumorigenesis and tumor progression are par-tially due to individual genomic variations. A possible explanation for this might be the distinct differentiation of cells from various tissue sources. The difference in the activation of genomic regions across multiple tissue types could induce varying replication frequencies between dif-ferent types of tissues [37]. For example, the probability of the incidence of a malignant heart tumor is very low, because the cardiomyocytes are postmitotic cells [38]. Consequently, the dif-ferentiation of a cell could have a crucial influence on the individual BPR-patterns and there-fore also on the tumorigenesis and tumor progression.
Cancer-specific BPR: The cancer-specific BPR class is in the second place among the detected BPRs. The cancer-specific BPRs appeared only in the tumor and not in the healthy genomes. This class could be substantial for clarification of the common cancer risk factors associated with certain genomic positions, which promote the tumorigenesis.
of replication of cancer cells, the probability of further breaks in those areas is very high. Such an event might account for the increasing occurrence of the common BPRs in the particular tumor entities. Similar findings were also reported in the literature [41].
Presence of hotspot-regions
In this research, we observed an increased occurrence of several adjacent BPRs by comparison of the detected structural alterations. Also, we noted an overlapping of segments with similar copy number alterations, referred to as“hotspot-areas”. The presence of these areas are likely due to either technical or biological conditions. The technical reason might be the resolution and the layout of the detection method (SNP 6.0 Datasheet) [42]. These regions could also be exhibit a high gene activity with the result that the DNA strand is longer unwind. Within that areas the DNA cut randomly easier because of a minor stability [40]. On the other hand, sto-chastic effects related to DNA replications may contribute to cancer incidence [21]. Taken together, it is imaginable that the breakage would occur randomly. But in a few but important regions, they frequently arise due to genomic instability.
Importance of the NOF-BPRs
To illustrate the importance of the NOF set of BPRs, we assessed the colocalization of these BPRs, the associated CNV segments and the potentially involved genes. Thereby, we found that these variants were related to both protein-coding and non-coding genes (e.g. lncRNA). About 0.8% of the identified genes are related to cancer. Most of the 31 NOF-BPRs fall into the common class (55%). Specifically, the most frequently detected BPR is located within the pro-tein-coding geneKIAA0513(chr16: 85,061,374 bp to 85,127,836 bp). It is well known that this gene plays an important role in immunologic, synaptic and apoptotic signal pathways. Thus, a deletion within the gene, as we detected in 7 of 8 tumor entities and the normal samples, could disturb the gene expression and induce a loss of function as a signal molecule in apoptosis [10], consequently promoting the tumorigenesis.
Two other interesting common BPRs were found on chromosome 8. Between these regions theADAM32gene is located (chr8: 39,308,564 bp to 39,380,371 bp). Additionally, in all 8 tumor entities and the normal samples there was a deletion within this gene. Previous studies [43–45] have reported that members of the ADAM family of proteins such as ADAM8, ADAM9, ADAM10, ADAM12, ADAM15, ADAM17, ADAM19, ADAM28 are overexpressed in human malignant tumors. ADAM proteins participate in mediating ectodomain-shedding of several proteins, including tumor necrosis factor-α(TNF), transforming growth factor
(TGF)-αand heparin-binding-epidermal growth factor (HB-EGF) [43,45,46]. Dysregulation
of TNF production has been linked to a variety of human diseases including Alzheimer’s dis-ease, major depression and cancer [47]. Up to now, several pathways have been postulated to account for the mediation of ADAM in cancer cell proliferation and progression. One of them is the ectodomain-shedding of growth factors TGF-αand HB-EGF. This process perhaps alter
signaling on the surfaces of cancer cells, inducing amplified cell proliferation through autocrine and paracrine mechanism [43]. According to our data, we speculate that like many of the
ADAMs,ADAM32may have importance in cancer cell proliferation and progression. 29% of the set of NOF-BPRs were classified as cancer-specific. The geneRP11-115C21.2
appear as either oncogene or tumor suppressor gene by alteration in the structure of chromatin [48–50] and also affect the transcription of protein-coding genes [51]. Based on our analyses, it could be suggested that the regulation of cell cycle and apoptosis were disturbed because of the deleted segments and theRP11-115C21.2gene operated as tumor suppressor gene.
By contrast, only 16% of the NOF-BPRs were found to be tumor entity-specific. This allows for the assumption that higher entity-specific BPRs could be detected preferably in multiple tumor entities. A similar idea has also been proposed by a study of somatic copy number alter-ations [35]. In this manner, it could be supposed that the genomic alterations, which promote a cancer disease, are common in multiple tumor entities. Only a few of individual alterations are associated with single tumor entities.
One out of this set of BPRs is located on chromosome 17 between 18,917,915 bp and 19,168,912 bp and was only detectable in brain tumor tissues with sufficient frequencies. By contrast, the complete region of 6,689 bp to 18,917,915 bp were deleted in three other tumor entities and in the brain cancer. In this section, several tumor-associated genes are coded, and therefore being affected. Among these, the most known gene coded for the tumor suppressor p53 (TP537,565,097 bp—7,590,856 bp) is important for cycle arrest, apoptosis, senescence, DNA repair and evokes changes in metabolism [52,53].
Conclusion
In conclusion, our analysis of genetic variations ties CNV detection, evaluation of BPR occur-rence frequency, identification of CNV-affecting genes and functional annotation. By studying a large number of tumor and healthy samples of diverse tissue origins, we have found that BPRs tended to occur more frequently in certain genomic regions in the tumor samples whereas being genome-wide dispersed in the normal samples. In general, therefore, it seems that some regions are preferential targets for the underlying mutations, suggesting the non-randomness of CNV mutations in tumor genomes. The higher recurrency of the tumor entity-specific BPRs could also suggests that there are several tissue-entity-specific mechanisms of tumori-genesis and progression. The strongly enhanced occurrence of specific BPRs in tumors may be due to increased cell proliferation; however, several known tumor-associated genes were colo-calized in the same genomic regions, and thus supporting common progression mechanism that explains the increasing fragmentation of DNA along with tumor progression. A majority of the identified tumor-relevant BPRs are either tumor entity-specific or associated with multi-ple-entities (termed‘cancer-specific’). A small part of these BPRs (termed‘common BPRs’) exhibited also a noticeable occurrence frequency in the normal samples. Further we observed hotspots at which segments with similar alterations in copy number were overlapped along with BPRs adjacently clustered. The presence of those hotspots and common BPRs imply that frequently affected mutations at fragile sites loci might also be responsible for cancer-gene alteration. Colocalization assessment and functional annotation revealed that not only protein-coding genes but also long intergenic non-protein-coding RNAs were affected by CNV genomic regions, suggesting that both protein-coding and non-coding genes with a broad range of bio-logical functions might play a causative or functional role in tumor biology. The findings of the present study with larger sets of samples of diverse tissue origins would serve as viable clues to the interpretation of the mechanisms for carcinogenesis.
be undertaken before the asscociation between BPR classification and tumor phenotypes is more rationally established. This study showed that tumor genomes exhibit a large set of BPRs. There are many factors contributing to DNA breakpoints, for example, increased cell prolifera-tion, failed DNA repair mechanism, or vulnerability to specific processes or damages and his-tone modifications. In particular, interest in hishis-tone modifications has grown over the last decade because alterations in the function of histone-modifying lead to oncogenic transforma-tion. With the methods in the present study, however, it is not possible to address the influence of this causual variant on cancer development and progression. Note that genes interact with other genes in complex signaling or regulatory networks, and pathways are more likely to cooperate together, it would be desirable to incorporate information about different pathways possibly involved in cancer cell proliferation and progression.
Supporting Information
S1 Table. Tumor Samples.List of GEO accession (GSM) numbers for all used tumor samples. (CSV)
S2 Table. Reference Samples.List of all used sample names from HapMap Project (Phase 3, Release #3) for the pooled reference dataset.
(TXT)
S3 Table. Normal Samples.List of GEO accession (GSM) numbers for all used samples from healthy tissue.
(CSV)
S4 Table. Overview over all detected breakpoint regions (BPRs) (tumor and healthy tissue samples).Data presented here include the related chromosome, start and end positions, rela-tive occurrence probability in the particular tissues, the total occurrence over all samples and the related classification of the BPR.
(CSV)
S5 Table. Segments of copy number alteration in brain cancer (pediatric medulloblas-toma).Averagedlog2ratios copy number alterations were evaluated for brain cancer tissues.
Additional information presented in the table includes chromosome number, types of alter-ations (deletion—loss, amplification -gain), start and end positions.
(TXT)
S6 Table. Segments with altered copy numbers in breast cancer.Altered averagedlog2ratios
from chromosomal average in breast cancer tissues were given, together with chromosome number, types of alterations (deletion—loss, amplification -gain), start and end positions. (TXT)
S7 Table. Segments with altered copy numbers in colorectal cancer.Averagedlog2ratios
from chromosomal average in colorectal cancer tissues are presented, together with additional information including chromosome number, types of alterations (deletion—loss, amplification -gain), start and end positions.
(TXT)
S8 Table. Segments with altered copy numbers in gastric cancer.Averagedlog2ratios from
chromosomal average in gastric cancer tissues were calculated. Additional results obtained include chromosome number, types of alterations (deletion—loss, amplification -gain), start and end positions.
S9 Table. Segments with altered copy numbers in lung cancer.Averagedlog2ratios from
chromosomal average in lung cancer tissues are given together with information including chromosome number, types of alterations (deletion—loss, amplification -gain), start and end positions.
(TXT)
S10 Table. Segments with altered copy numbers in ovarian cancer.Averagedlog2ratios from
chromosomal average in ovarian cancer tissue are presented together with additioinal informa-tion including chromosome number, types of alterainforma-tions (deleinforma-tion—loss, amplification -gain), start and end positions.
(TXT)
S11 Table. Segments with altered copy numbers in prostate cancer.Averagedlog2ratios
from chromosomal average in prostate cancer tissues are given, together with additioinal infor-mation including chromosome number, types of alterations (deletion—loss, amplification -gain), start and end positions.
(TXT)
S12 Table. Segments with altered copy numbers in renal cancer.Averagedlog2ratios from
chromosomal average in renal cancer tissues are shown together with additional information including chromosome number, types of alterations (deletion—loss, amplification -gain), start and end positions.
(TXT)
S13 Table. Segments with altered copy numbers in healthy tissues.Data presented here are
log2ratios from chromosomal average in healthy tissues, chromosome number, types of
alter-ations (deletion—loss, amplification—gain), start and end position. (TXT)
S14 Table. Overview over all detected potentially affected genes due to segments with altered copy number.For the potentially affected genes, Ensembl IDs are given together with additional information, including gene names (if known), the related chromosome, the start and end positions of the genes, whether a gene is affected at least 1 time in the respective tissue (1—0 if not) and the total number of potentially affected tissues.
(CSV)
S15 Table. Potentially affected tumor-associated genes.Only those genes which are known as tumor-associated due to segments with altered copy number were summarized. The affected genes are demonstrated with the Ensembl IDs, gene names (if known), the related chromo-some, the start and end positions of the genes, whether a gene is affected at least 1 time in the respective tissue (1—0 if not) and the total number of potentially affected tissues.
(CSV)
S16 Table. Potentially affected genes in the healthy tissues.Only those genes which have seg-ments of altered copy number in healthy tissues were summarized. The affected genes are dem-onstrated with the Ensembl IDs, gene name, the related chromosome, the start and end positions of the genes, whether a gene is affected at least 1 time in the respective tissue (1—0 if not) and the total number of potentially affected tissues.
(CSV)
S1 Fig. Circos plot of copy number changes over the full genome.Averagedlog2ratios of
medulloblastoma, 2- breast cancer, 3- colorectal cancer, 4- gastric cancer, 5- lung cancer, 6-ovarian cancer, 7- prostate cancer, 8- renal cancer, 9- healthy tissues).
(PDF)
S2 Fig. Circos plot of copy number changes in chromosome 16.Averagedlog2-ratios of the
tumor entities and the healthy tissue samples in single plots over chromosome 16 are presented with entities numbered (1- brain cancer pediatric medulloblastoma, 2- breast cancer, 3- colo-rectal cancer, 4- gastric cancer, 5- lung cancer, 6- ovarian cancer, 7- prostate cancer, 8- renal cancer, 9- healthy tissues).
(PDF)
S3 Fig. Circos plot of copy number changes in chromosome 17.Averagedlog2-ratios of the
tumor entities and the healthy tissue samples over chromosome 17 are shown with entities numbered (1- brain cancer pediatric medulloblastoma, 2- breast cancer, 3- colorectal cancer, 4- gastric cancer, 5- lung cancer, 6- ovarian cancer, 7- prostate cancer, 8- renal cancer, 9-healthy tissues).
(PDF)
S4 Fig. Bar plot of the occurrence of BPRs within genomic and intergenic regions.The numbers of intragenic and intergenic BPRs are shown as percentages of intragenic (dark green) regions, regions which are overlapping intra- and intergenic regions (light green) and inter-genic region (grey) for every tumor entity and the healthy tissue.
(PDF)
S5 Fig. Bar plot of the occurrence of segments of altered copy number within intragenic and intergenic regions.The number of intragenic and intergenic segments of altered copy number were counted. It is shown the percentages of intragenic (dark green) regions, regions which are overlapping intra- and intergenic regions (light green) and intergenic region (grey) for every tumor entity and the healthy tissue.
(PDF)
S6 Fig. Bar plot of the frequency of possibly affected genes by segments of altered copy number.The following figure illustrates the number of affected genes (grey) compared to the number of affected tumor associated genes (green) for every tumor entity and the healthy tis-sue.
(PDF)
S7 Fig. Number of breakpoints per sample.The sorted numbers of breakpoints identifed per sample are plotted. The abscissa gives the index of the sample and the ordinate the counted breakpoints. The samples are grouped in tissue types.
(PDF)
Author Contributions
Conceived and designed the experiments: HP. Analyzed the data: SM BB. Contributed reagents/materials/analysis tools: SM BB. Wrote the paper: CW HP.
References
1. Mahfouz EM, Sadek RR, Abdel-Latief WM, Mosallem FAH, Hassan EE. The role of dietary and lifestyle factors in the development of colorectal cancer: case control study in Minia, Egypt. Cent Eur J Public Health. 2014 Dec; 22(4):215–222. doi:10.21101/cejph.a3919PMID:25622477
3. Stewart BW, Wild CP. In: World Cancer Report 2014. World Health Organization; 2014.
4. Hanahan D, Weinberg RA. The Hallmarks of Cancer: The Next Generation. Cell. 2011 Mar; 144 (5):646–674. doi:10.1016/j.cell.2011.02.013PMID:21376230
5. Bernstein C, Prasad AR, Nfonsam V, Bernstein H. DNA Damage, DNA Repair and Cancer. In: Clark Chen Prof, editor. New Research Directions in DNA Repair. InTech; 2013.
6. Redon R, Ishikawa S, Fitch KR, Feuk L, Perry GH, Andrews TD, et al. Global variation in copy number in the human genome. Nature. 2006 Nov; 444(7118):444–454. doi:10.1038/nature05329PMID: 17122850
7. Malhotra D, Sebat J. CNVs: Harbingers of a Rare Variant Revolution in Psychiatric Genetics. Cell. 2012 Mar; 148(6):1223–1241. doi:10.1016/j.cell.2012.02.039PMID:22424231
8. Zhang F, Khajavi M, Connolly AM, Towne CF, Batish SD, Lupski JR. The DNA replication FoSTeS/ MMBIR mechanism can generate genomic, genic and exonic complex rearrangements in humans. Nat Genet. 2009 Jul; 41(7):849–853. doi:10.1038/ng.399PMID:19543269
9. Gratias S, Rieder H, Ullmann R, Klein-Hitpass L, Schneider S, Bölöni R, et al. Allelic loss in a minimal region on chromosome 16q24 is associated with vitreous seeding of retinoblastoma. Cancer Res. 2007 Jan; 67(1):408–416. doi:10.1158/0008-5472.CAN-06-1317PMID:17210724
10. Lauriat TL, Dracheva S, Kremerskothen J, Duning K, Haroutunian V, Buxbaum JD, et al. Characteriza-tion of KIAA0513, a novel signaling molecule that interacts with modulators of neuroplasticity, apopto-sis, and the cytoskeleton. Brain Res. 2006 Nov; 1121(1):1–11. doi:10.1016/j.brainres.2006.08.099 PMID:17010949
11. Yang R, Chen B, Pfutze K, Buch S, Steinke V, Holinski-Feder E, et al. Genome-wide analysis associ-ates familial colorectal cancer with increases in copy number variations and a rare structural variation at 12p12.3. Carcinogenesis. 2014 Feb; 35(2):315–323. doi:10.1093/carcin/bgt344PMID:24127187
12. McCarroll SA, Kuruvilla FG, Korn JM, Cawley S, Nemesh J, Wysoker A, et al. Integrated detection and population-genetic analysis of SNPs and copy number variation. Nat Genet. 2008 Oct; 40(10):1166–
1174. doi:10.1038/ng.238PMID:18776908
13. Standfuss C, Pospisil H, Klein A. SNP microarray analyses reveal copy number alterations and pro-gressive genome reorganization during tumor development in SVT/t driven mice breast cancer. BMC Cancer. 2012 Aug; 12:380. doi:10.1186/1471-2407-12-380PMID:22935085
14. Albertson DG, Collins C, McCormick F, Gray JW. Chromosome aberrations in solid tumors. Nat Genet. 2003 Aug; 34(4):369–376. doi:10.1038/ng1215PMID:12923544
15. Shlien A, Tabori U, Marshall CR, Pienkowska M, Feuk L, Novokmet A, et al. Excessive genomic DNA copy number variation in the Li-Fraumeni cancer predisposition syndrome. Proc Natl Acad Sci USA. 2008 Aug; 105(32):11264–11269. doi:10.1073/pnas.0802970105PMID:18685109
16. Silva AG, Krepischi ACV, Pearson PL, Hainaut P, Rosenberg C, Achatz MI. The profile and contribution of rare germline copy number variants to cancer risk in Li-Fraumeni patients negative for TP53 muta-tions. Orphanet J Rare Dis. 2014 Apr; 9:63. doi:10.1186/1750-1172-9-63PMID:24775443
17. Bougeard G, Sesboüé R, Baert-Desurmont S, Vasseur S, Martin C, Tinat J, et al. Molecular basis of the Li-Fraumeni syndrome: an update from the French LFS families. J Med Genet. 2008 Aug; 45(8):535–
538. doi:10.1136/jmg.2008.057570PMID:18511570
18. Ruijs MW, Verhoef S, Rookus MA, Pruntel R, van der Hout AH, Hogervorst FB, et al. TP53 germline mutation testing in 180 families suspected of Li-Fraumeni syndrome: mutation detection rate and rela-tive frequency of cancers in different familial phenotypes. J Med Genet. 2010 Jun; 47(6):421–428. doi: 10.1136/jmg.2009.073429PMID:20522432
19. Bose P, Hermetz KE, Conneely KN, Rudd MK. Tandem Repeats and G-Rich Sequences Are Enriched at Human CNV Breakpoints. PLoS ONE. 2014 Jul; 9(7). doi:10.1371/journal.pone.0101607
20. Li Y, Zhang L, Ball RL, Liang X, Li J, Lin Z, et al. Comparative analysis of somatic copy-number alter-ations across different human cancer types reveals two distinct classes of breakpoint hotspots. Hum Mol Genet. 2012 Nov; 21(22):4957–4965. doi:10.1093/hmg/dds340PMID:22899649
21. Tomasetti C, Vogelstein B. Variation in cancer risk among tissues can be explained by the number of stem cell divisions. Science. 2015 Jan; 347(6217):78–81. doi:10.1126/science.1260825PMID: 25554788
22. Zhao X, Li C, Paez JG, Chin K, Janne PA, Chen TH, et al. An integrated view of copy number and allelic alterations in the cancer genome using single nucleotide polymorphism arrays. Cancer Res. 2004 May; 64(9):3060–3071. doi:10.1158/0008-5472.CAN-03-3308PMID:15126342
23. Gene Expression Omnibus;. Available from:http://www.ncbi.nlm.nih.gov/geo/.
25. Altshuler DM, Gibbs RA, Peltonen L, Altshuler DM, Gibbs RA, Peltonen L, et al. Integrating common and rare genetic variation in diverse human populations. Nature. 2010 Sep; 467(7311):52–58. doi:10. 1038/nature09298PMID:20811451
26. Li W, Olivier M. Current analysis platforms and methods for detecting copy number variation. Physiol Genomics. 2013 Jan; 45(1):1–16. doi:10.1152/physiolgenomics.00082.2012PMID:23132758
27. Karimpour-Fard A, Dumas L, Phang T, Sikela JM, Hunter LE. A survey of analysis software for array-comparative genomic hybridisation studies to detect copy number variation. Hum Genomics. 2010 Aug; 4(6):421–427. doi:10.1186/1479-7364-4-6-421PMID:20846932
28. Affymetrix Power Tools;. Available from:http://www.affymetrix.com/estore/partners_programs/ programs/developer/tools/powertools.affx#1_1.
29. R Development Core Team. R: A Language and Environment for Statistical Computing. Vienna, Aus-tria; 2013. Available from:http://www.R-project.org/.
30. de Andrade M, Atkinson EJ, Bamlet WR, Matsumoto ME, Maharjan S, Slager SL, et al. Evaluating the influence of quality control decisions and software algorithms on SNP calling for the affymetrix 6.0 SNP array platform. Hum Hered. 2011 Sep; 71(4):221–233. doi:10.1159/000328843PMID:21734406
31. Neuvial P, Bengtsson H, Speed T. In: Horng-Shing Lu H, Schölkopf B, Zhao H, editors. Statistical Anal-ysis of Single Nucleotide Polymorphism Microarrays in Cancer Studies. Springer Handbooks of Computational Statistics. Springer Berlin Heidelberg; 2011. p. 225–255.
32. Le Scouarnec S, Gribble SM. Characterising chromosome rearrangements: recent technical advances in molecular cytogenetics. Heredity (Edinb). 2012 Jan; 108(1):75–85. doi:10.1038/hdy.2011.100
33. Olshen A, Venkatraman E, Lucito R, Wigler M. Circular binary segmentation for the analysis of array-based DNA copy number data. Biostatistics. 2004 Oct; 5:557–572. doi:10.1093/biostatistics/kxh008 PMID:15475419
34. Durinck S, Moreau Y, Kasprzyk A, Davis S, De Moor B, Brazma A, et al. BioMart and Bioconductor: a powerful link between biological databases and microarray data analysis. Bioinformatics. 2005 Aug; 21 (16):3439–3440. doi:10.1093/bioinformatics/bti525PMID:16082012
35. Beroukhim R, Mermel CH, Porter D, Wei G, Raychaudhuri S, Donovan J, et al. The landscape of somatic copy-number alteration across human cancers. Nature. 2010 Feb; 463(7283):899–905. doi: 10.1038/nature08822PMID:20164920
36. Zarrei M, MacDonald JR, Merico D, Scherer SW. A copy number variation map of the human genome. Nat Rev Genet. 2015 Mar; 16(3):172–183. doi:10.1038/nrg3871PMID:25645873
37. Nordman J, Orr-Weaver TL. Regulation of DNA replication during development. Development. 2012 Feb; 139(3):455–464. doi:10.1242/dev.061838PMID:22223677
38. McAllister HA, Fenoglio J. Tumors of the Cardiovascular System. In: Hartmannn WCW, editor. Atlas of Tumor Pathology. Washington, DC: Armed Forces Institute of Pathology; 1978. p. 46–47. (second series, fasc 15).
39. Dillon LW, Burrow AA, Wang YH. DNA Instability at Chromosomal Fragile Sites in Cancer. Curr Geno-mics. 2010 Aug; 11(5):326–337. doi:10.2174/138920210791616699PMID:21286310
40. Gorgoulis VG, Vassiliou LV, Karakaidos P, Zacharatos P, Kotsinas A, Liloglou T, et al. Activation of the DNA damage checkpoint and genomic instability in human precancerous lesions. Nature. 2005 Apr; 434(7035):907–913. doi:10.1038/nature03485PMID:15829965
41. Thys RG, Lehman CE, Pierce LC, Wang YH. DNA secondary structure at chromosomal fragile sites in human disease. Curr Genomics. 2015 Feb; 16(1):60–70. doi:10.2174/1389202916666150114223205 PMID:25937814
42. Data Sheet- Genome- Wide Human SNP Array 6.0. Affymetrix. 2009; 2:1–4.
43. Mochizuki S, Okada Y. ADAMs in cancer cell proliferation and progression. Cancer Science. 2007 May; 98(5):621–628. doi:10.1111/j.1349-7006.2007.00434.xPMID:17355265
44. Brocker C, Vasiliou V, Nebert D. Evolutionary divergence and functions of the ADAM and ADAMTS gene families. Hum Genomics. 2009 Oct; 4(1):43–55. doi:10.1186/1479-7364-4-1-43PMID:19951893
45. Fröhlich C, Klitgaard M, Noer JB, Kotzsch A, Nehammer C, Kronqvist P, et al. ADAM12 is expressed in the tumour vasculature and mediates ectodomain shedding of several membrane-anchored endothelial proteins. Biochem J. 2013 May; 452(1):97–109. doi:10.1042/BJ20121558
46. Weber S, Saftig P. Ectodomain shedding and ADAMs in development. Development. 2012 Oct; 139 (20):3693–3709. doi:10.1242/dev.076398PMID:22991436
48. Gutschner T, Diederichs S. The hallmarks of cancer: a long non-coding RNA point of view. RNA Biol. 2012 Jun; 9(6):703–719. doi:10.4161/rna.20481PMID:22664915
49. Gutschner T, Hämmerle M, Eißmann M, Hsu J, Kim Y, Hung G, et al. The noncoding RNA MALAT1 is a critical regulator of the metastasis phenotype of lung cancer cells. Cancer Res. 2013 Feb; 73(3):1180–
1189. doi:10.1158/0008-5472.CAN-12-2850PMID:23243023
50. Yan X, Hu Z, Feng Y, Hu X, Yuan J, Zhao S, et al. Comprehensive Genomic Characterization of Long Non-coding RNAs across Human Cancers. Cancer Cell. 2015 Oct; 28(4):529–540. doi:10.1016/j.ccell. 2015.09.006PMID:26461095
51. Huarte M, Guttman M, Feldser D, Garber M, Koziol MJ, Kenzelmann-Broz D, et al. A large intergenic noncoding RNA induced by p53 mediates global gene repression in the p53 response. Cell. 2010 Aug; 142(3):409–419. doi:10.1016/j.cell.2010.06.040PMID:20673990
52. Lane DP. Cancer. p53, guardian of the genome. Nature. 1992 Jul; 358(6381):15–16. doi:10.1038/ 358015a0PMID:1614522
53. Peifer M, Fernández-Cuesta L, Sos ML, George J, Seidel D, Kasper LH, et al. Integrative genome anal-yses identify key somatic driver mutations of small-cell lung cancer. Nat Genet. 2012 Oct; 44(10):1104–