Effects of Acute Supramaximal Cycle Exercise
on Plasma FFA Concentration in Obese
Adolescent Boys
Georges Jabbour1*, Horia-Daniel Iancu1☯, Anne Paulin1☯, Jean-Marc Lavoie2☯, Sophie Lemoine-Morel3☯, Hassane Zouhal3☯
1School of Kinesiology and Leisure, Faculty of Health Sciences and Community Services, Université de Moncton, Moncton, New-Brunswick, Canada,2Department of Kinesiology, University of Montreal, Montreal, QC, H3C 3J7, Canada,3Movement Sport and Health Sciences Laboratory, University of Rennes 2-ENS Cachan, Rennes, France
☯These authors contributed equally to this work.
Abstract
Aims
The aims of the present study are 1) to evaluate the free fatty acid (FFA) profile and 2) to determine the relative anaerobic and aerobic contributions to total energy consumption dur-ing repeated supramaximal cycldur-ing bouts (SCE) in adolescent boys with different body weight statuses.
Materials and Methods
Normal-weight (NW), overweight (OW), and obese (OB) adolescent boys (n =15 per group) completed a SCE sessions consisted of 6 x 6s maximal sprints with 2 min of passive rest between each repetition. Plasma FFA levels were determined at rest, immediately after a 10 min warm-up, and immediately at the end of SCE. The anaerobic and aerobic contribu-tions (%) were measured via repeated SCE bouts. Insulin resistance was calculated using the homoeostatic model assessment (HOMA-IR) index.
Results
The FFA concentrations measured immediately after SCE were higher in the OB group than in the OW and NW (p<0.01 and p<0.01, respectively) groups. Moreover, the anaerobic contributions to SCE were significantly lower in obese adolescents (p<0.01) and decreased significantly during the 2nd, 3rdand 4threpetitions. The FFA levels were significantly associ-ated with the HOMA-IR index and aerobic contribution among adolescent boys (r=0.83 and r=0.91, respectively, p<0.01).
Conclusion
In contrast to the NW and OW groups, there is an increase in lipid mobilization and sift to aerobic energy metabolism during SCE in the OB group.
OPEN ACCESS
Citation:Jabbour G, Iancu H-D, Paulin A, Lavoie J-M, Lemoine-Morel S, Zouhal H (2015) Effects of Acute Supramaximal Cycle Exercise on Plasma FFA Concentration in Obese Adolescent Boys. PLoS ONE 10(6): e0129654. doi:10.1371/journal.pone.0129654
Academic Editor:Antonio Gonzalez-Bulnes, INIA, SPAIN
Received:December 21, 2014
Accepted:May 12, 2015
Published:June 15, 2015
Copyright:© 2015 Jabbour et al. This is an open access article distributed under the terms of the Creative Commons Attribution License, which permits unrestricted use, distribution, and reproduction in any medium, provided the original author and source are credited.
Data Availability Statement:All relevant data are within the paper.
Funding:This work was funded by the Faculty of Superior Studies and Research and the Leadership Institute of the École de kinésiologie et de Loisir of the Universté de Moncton (to GJ).
Competing Interests:The authors have declared
Introduction
High-intensity exercise such as supramaximal exercise is gaining popularity in the context of obesity management. Based on data provided by post intervention metabolic measures, this model of exercise appears to be a valuable approach for managing obesity. Indeed, Whyte et al. [1] demonstrated that very high-intensity sprint interval training improved several metabolic risk factors such as an increase in resting fat oxidation rate in the fasted state and a decrease in resting carbohydrate oxidation in the fasted state compared with baseline. This high-intensity training also decreased waist and hip circumferences in overweight and obese sedentary men and illustrated the potential of this alternative exercise model to improve lipid utilization in individuals with excess body weight. However, no information describing true metabolic adap-tations (e.g. fat and carbohydrate oxidation), during exercise is available.
Previous studies reported that in response to supramaximal exercise in normal-weight indi-viduals, a progressive decline in plasma free fatty acid (FFA) was accompanied by increased blood glucose turnover responsible for energy yield [2]. In fact, supramaximal exercise is a brief event, and in order to meet the high ATP demand (e.g., adenosine diphosphate [ADP]), phosphorylation from PCr hydrolysis and glycolysis is necessary [3]. This is reflected by high anaerobic contributions to total energy expenditure [4]. In the context of obesity, several fac-tors such as reduced motor-unit activation [5], premature fatigue and reduced activation of type II muscle fibers [6] may affect the metabolism profile. Indeed, anaerobic capacity, which is the determinant factor of performance during such exercise, is affected by obesity [7]; high-intensity training enhances anaerobic capacity in overweight and obese men [1]. The mecha-nism(s) underlying these adaptations are likely the result of skeletal muscle adaptations involv-ing marked increases in skeletal muscle capacity for glycolytic enzyme content [8], increases in anaerobic fitness, and increases insulin sensitivity [9].
Given that glycolytic activity may be altered by obesity, it seems interesting to address lipids, as an alternative energy nutrient to working muscles during supramaximal exercise. Lipid utili-zation is modulated by the availability of FFA in circulating blood. In lean healthy humans greater hydrolysis of adipose tissue triglycerides to FFA suggests that the availability of circulat-ing FFA can potentially meet the oxidative needs of workcirculat-ing muscles durcirculat-ing submaximal exer-cise [10]. Additionally, simultaneous evaluation of the maximal activation of both energetic systems (e.g., anaerobic vs. aerobic) during supramaximal exercise may allow us to better understand anaerobic/aerobic interactions and provide information regarding the metabolic adaptation in obese individuals during such exercise.
As such, the present work aims to evaluate plasma FFA as well as anaerobic and aerobic pro-files in response to supramaximal cycling exercise in overweight, obese and normal-weight adolescent boys.
Materials and Methods
Forty-five healthy adolescent boys were recruited from several high schools in Lebanon. To prevent any maturation variability between them, we chose children in the age range of 13–14 years, who were all at the same Tanner stage (Stage 3) [11]. Written informed consent was obtained from the parents of each subject before the study, and the survey was approved by the Ethical Committee on Human Research (ECHR) of the University of Balamand (Lebanon). The inclusion criteria for participation were sedentary (participating in<1 h per week of
was conducted on 4 different days (D1, D2, D3 and D4), each separated by a period of 8 days. Subjects were asked to rest the day before all testing and to be well hydrated.
Anthropometric measurements
Body mass was measured to the nearest 0.1 kg with the subject in light clothing without shoes using an electronic scale (Kern, MFB 150K100). Height was determined to the nearest 0.5 cm with a measuring tape fixed to the wall. The body mass index (BMI) was calculated as the ratio of mass (kg) to height2(m2). The percent of body fat was estimated from 3 skinfold thicknesses (biceps, triceps and sub-scapular) as previously described [13]. After the determination of body composition, the participants were separated into three groups based on the criteria previously described [14]: the normal-weight (NW) (n = 15; body fat %<22) group, the overweight
(OW) (n = 15; body fat % = 22–25) group and the obese group (OB) (n = 15; body fat %>26).
The fat free mass was calculated by subtracting the fat mass from the body mass.
Maximal Test
On D1 subjects performed a maximal test on an upright cycle ergometer (Monark ergomedic 839E electronic test cycle, Sweden) to determine their maximal oxygen consumption (VO2max) and to ensure that groups were matched for fitness level. The initial power was set at 60 Watts and progressively increased by 20 Watts every 2 min until exhaustion with a maintained pedal-ing rate of 60 revolutions/min (rpm). A breath-by-breath automated metabolic system (CPX, Medical Graphics, St. Paul, Minnesota, USA) was used to determine the VO2max. Achievement of VO2maxwas accepted when subjects fulfilled at least three of the following criteria: a plateau in VO2despite an increase in exercise intensity, a respiratory exchange ratio greater than 1.1, a maximal HR above 90% of the predicted maximal theoretical HR (220-age in years), a blood lactate concentration higher than 8.0 mmolL-1and the apparent exhaustion of the subject [15].
Submaximal test
On D2, we measured steady state VO2 uptakeat a constant submaximal power (below the VO2max) using a breath-by-breath automated metabolic system (CPX, Medical Graphics, St. Paul, Minnesota, USA). After a 3-min resting baseline period, subjects started pedaling at the established power, which was maintained for 10 min at a pedaling rate of 60 revolutions/ min (rpm). The 10-minute exercise bouts were completed 6 times for each subject at powers of 30%, 40%, 50%, 60%, 70% and 80% of their individual VO2maxpower and were separated by 5 minutes resting period, and the measurements for each subject were plotted separately and visually checked for linearity as described elsewhere [16]. This demonstrates that our measured VO2 uptakefor a 10-min exercise was a steady-state value equaling VO2 demand(total rate of energy release). We therefore conclude that VO2 demandincreased linearly with power for all subjects in the examined range. This analysis allowed for the calculation of the accumulated oxygen deficit (AOD) (measured in ml O2equivalents per kg) for each cycling interval by cal-culating the difference between VO2 demandfor the respective power (from extrapolation of the calculated relationship) and measured O2 cost. The linear relationship between steady state VO2values and cycling power was extrapolated and used to estimate energy demand during supramaximal cycling exercise (SCE).
Force-Velocity Test (F/V)
technique adapted from a previous study [17]. This test consists of a succession of supramaxi-mal bouts of approximately 6 seconds in duration with a starting load of 2 kg and with the exercise loads increasing by 2 kg after each bout until exhaustion. A passive recovery (5 min) was allowed between successive bouts. The velocity for each bout was recorded every two sec-onds. Only the highest velocity (V) was recorded for each load using an electronic counter (MEV 2000). Power output was calculated by multiplying the load and speed, and a power curve was then compiled for each bout. The optimal load (F) corresponding to the maximal power was used for the SCE performed on D4.
Supramaximal cycling exercise (SCE)
On D4, each subject performed a repeat sprint cycling test (6-repetitions of 6-second maximal sprints with 2 min of passive rest between each repetition). Each SCE bout lasted six seconds, and participants were asked to pedal at maximal velocity against the load determined during D3. The SCE began with a 5 minute warm-up of continuous cycling at moderate intensity (40% of their individual VO2maxpower) followed by 2 minutes of recovery. The repeat sprint cycling test was conducted under the supervision of a member of the research team, and veloci-ties (in RPM) were recorded for each second of the bout in order to ensure that said velociveloci-ties were constant. This form of very short supramaximal sprint exercise was tolerated by all of our participants and may be more relevant to their physical activity behaviors. During SCE, the mean of all power (POmean) exerted by the participants was calculated.
The experimentation started at approximately 9 am, 3 hours after a standardized breakfast (10 kcal/kg, 55% carbohydrate, 33% lipid and 12% protein). In the present study we controlled whether all participants ate a breakfast. Venous blood samples from an antecubital vein were drawn at rest, and then, the adolescents warmed-up for 10 min at a submaximal power between 55–65 watts (W) (corresponding to ~ 60% of VO2max). Venous blood samples were drawn again immediately after the warm-up period and immediately after the end of the test. Subse-quently, the repeated cycling sprint test was performed, and the subjects were asked to cycle as fast as possible with 2 min of passive rest between each repetition.
Blood analyses
At each extraction, the blood was collected in a vacutainer tube containing Ethylene Diamine Tetra Acetic Acid(EDTA). Hematocrit (Ht) was measured three times for each blood sample by micro-centrifugation(JOUAN-HEMAC). Plasma from the venous blood samples was sepa-rated by centrifugation at 3000 g for 20 min (4°C) (ORTO ALRESA mod.Digicen.R,Spain). Ali-quots were immediately frozen and stored at -80°C for use in subsequent chemical analyses. The blood lactate concentrations obtained at rest, after the warm-up and at the end of SCE were determined enzymatically using a lactate analyzer(Microzym,Cetrix,France). Rest plasma insulin concentrations were measured in the centralized laboratory by a radio-immu-noassay procedure (Phaadebas Insulin Kit; Pharmacia Diag-nostics AB, Piscataway, NJ). Plasma FFA was determined using a kit from Roche Diagnostics (Mannheim, Germany) by enzymatic colorimetric assay according to the manufacturer’s instructions. The rest plasma glucose was assayed by the glucose oxidase method (Boehringer kit, Meylan, France). Plasma lactate and FFA values were corrected for plasma volume changes using the equation of Van Beaumont [18]. An estimate of insulin resistance was calculated by the homoeostatic model assessment (HOMA-IR) index as: [insulin (μU/mL) × glucose (mmolL-1)]/22.5. To distinguish
Calculation of relative energy expenditure
The VO2 demandvalues of SCE were estimated individually by extrapolating the linear rela-tionship between the power and the VO2 demandvalues established during the constant sub-maximal power exercises. The accumulated VO2 uptakeand the accumulated VO2 demandwere taken as the VO2 uptakeand the VO2 demandintegrated over the entire supramaximal cycling exercise bout [16]. The accumulated oxygen deficit (AOD) (measured in ml O2equivalents per kg) was equal to the accumulated VO2 demandminus the accumulated VO2 uptake. This allowed for a measurement of anaerobic (AOD) and aerobic (VO2) energy contributions throughout the four SCE repetitions [20]. In this study, results are given only from four supramaximal cycling exercise bout given that some of participants felt discomfort by wearing mask destined for gas analysis. Then, the mask was removed to allow participants to complete the entire session bouts.
Statistical analysis
Data were summarized as the mean and the standard deviation (SD). The data were analyzed using Statistica 7.1 software. After testing for the normal distribution (Kolmogorov—Smirnov test), differences within and between the NW, OW and OB groups were analyzed using a two-way analysis of variance for repeated measurements. After confirming significant group differ-ences over time, the Newman-Keul’s post hoc test was performed. The power of the correlation analyses was calculated using a Pearson test (for parametric data). A value of p<0.01 was
accepted as the minimal level of statistical significance.
Results
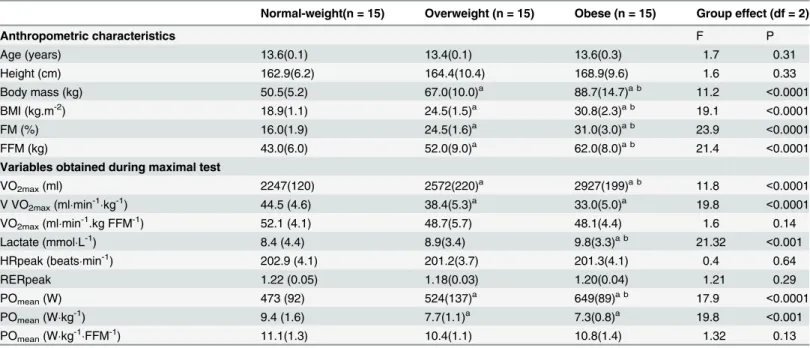
Subject characteristics are displayed inTable 1. Age and height were similar among subjects in the three groups. Mean power and VO2max, expressed per unit of fat free mass, did not signifi-cantly differ among the three groups (Table 1).
The plasma FFA levels at rest were significantly higher in the OB group than in the NW (p<0.01) and OW (p<0.01) groups (Table 2). However, immediately after the warm-up, the
FFA values in the OB group were lower than in the NW and OW groups (p<0.01) and
decreased compared to the resting levels (p<0.01). In the NW and OW groups the FFA
con-centrations after the warm-up were similar to the resting values. After the SCE, the FFA values increased from resting values only in the OB group (+ 0.06 molL-1, p<0.01). The exercise FFA
levels was significantly higher in the OB group than in the OW (p<0.01) and NW (p<0.01)
groups.
Resting insulin and glucose concentrations were significantly higher in the OB group com-pared to the NW and the OW (p<0.01, respectively) groups (Table 2). In addition, the
HOMA-IR (insulin resistance) was significantly higher in OB group compared to the OW and NW groups. For plasma lactate measures, the values obtained after the warm-up period, and the SCE did not differ statistically between groups.
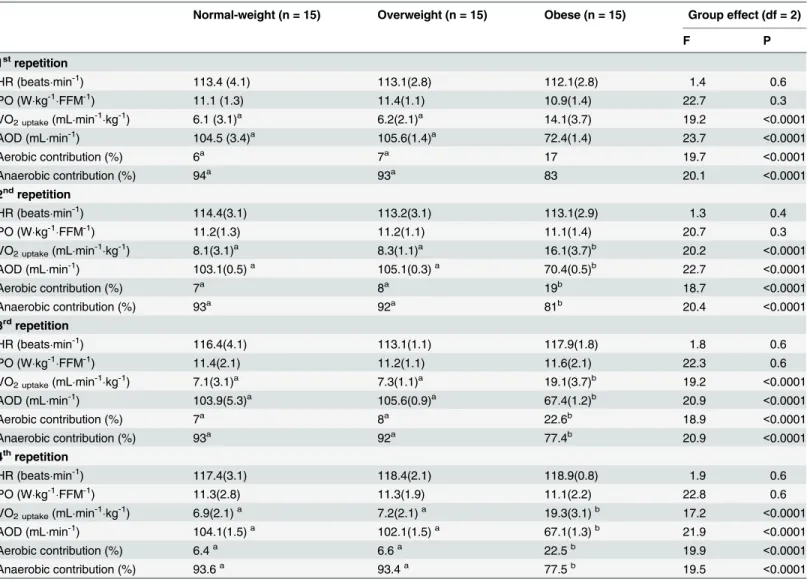
For the OB group, VO2 uptakeincreased significantly during the 2nd, 3rdand 4threpetitions compared with values obtained during the 1strepetition SCE (p<0.01) (Table 3). In contrast,
the AOD decreased for the OB group during the 2nd, 3rdand 4threpetitions (p<0.01). Follow-ing SCE, the NW and OW groups demonstrated significantly higher AOD values compared with the OB group (p<0.01, respectively). In addition, the VO2 uptake, the AOD, and the aerobic
and the aerobic contributions determined during SCE remained constant during all repetition bouts for the NW and OW groups (Table 3).
Table 1. Physiological characteristics.
Normal-weight(n = 15) Overweight (n = 15) Obese (n = 15) Group effect (df = 2)
Anthropometric characteristics F P
Age (years) 13.6(0.1) 13.4(0.1) 13.6(0.3) 1.7 0.31
Height (cm) 162.9(6.2) 164.4(10.4) 168.9(9.6) 1.6 0.33
Body mass (kg) 50.5(5.2) 67.0(10.0)a 88.7(14.7)a b 11.2 <0.0001
BMI (kg.m-2) 18.9(1.1) 24.5(1.5)a 30.8(2.3)a b 19.1 <0.0001
FM (%) 16.0(1.9) 24.5(1.6)a 31.0(3.0)a b 23.9 <0.0001
FFM (kg) 43.0(6.0) 52.0(9.0)a 62.0(8.0)a b 21.4 <0.0001
Variables obtained during maximal test
VO2max(ml) 2247(120) 2572(220)a 2927(199)a b 11.8 <0.0001
V VO2max(mlmin-1kg-1) 44.5 (4.6) 38.4(5.3)a 33.0(5.0)a 19.8 <0.0001
VO2max(mlmin-1.kg FFM-1) 52.1 (4.1) 48.7(5.7) 48.1(4.4) 1.6 0.14
Lactate (mmolL-1) 8.4 (4.4) 8.9(3.4) 9.8(3.3)a b 21.32 <0.001
HRpeak (beatsmin-1) 202.9 (4.1) 201.2(3.7) 201.3(4.1) 0.4 0.64
RERpeak 1.22 (0.05) 1.18(0.03) 1.20(0.04) 1.21 0.29
POmean(W) 473 (92) 524(137)a 649(89)a b 17.9 <0.0001
POmean(Wkg-1) 9.4 (1.6) 7.7(1.1)a 7.3(0.8)a 19.8 <0.001
POmean(Wkg-1FFM-1) 11.1(1.3) 10.4(1.1) 10.8(1.4) 1.32 0.13
Values are mean (standard deviation).BMI: Body Mass Index,FM: Fat Mass,FFM: Fat Free Mass,VO2max: Maximal oxygen consumption,HRpeak: peak heart rate,RER: respiratory exchange ratio,POmean: The mean of all powers developed during the SCE.
Significant difference with NW: (a: p<0.01). Signi
ficant difference with OW (b: p<0.01).
doi:10.1371/journal.pone.0129654.t001
Table 2. Metabolic parameters of adolescent boys.
Normal-weight (n = 15) Overweight (n = 15) Obese (n = 15) Group effect (df = 2)
F P
Rest
Glucose (mmolL-1) 4.3(0.1) 4.3(0.1) 4.8(0.1)a b 18.7 <0.0001
Insulin (μmolmL-1) 12.7(3.2) 13.1(4.2) 22.7(0.3)a b 21.6 <0.0001
FFA (molL-1) 0.04(0.01) 0.05(0.01)a 0.07(0.01)a b 18.2 <0.0001
HOMA-IR 2.2(0.1) 2.3(0.1) 4.7(1.3)a b 21.7 <0.0001
Lactate (mmolL-1) 1.3(0.3) 1.3(0.5) 1.3(0.7) 1.3 0.53
Warm-up
FFA (molL-1) 0.05(0.01) 0.05(0.01) 0.03(0.01)a b c 19.7 <0.0001
Δ1FFA (molL-1) 0.01(0.01) 0.01(0.01)a -0.03(0.01)a b 22.6 <0.0001
Lactate (mmolL-1) 4.4(1.2) 4.5(1.1) 4.5(2.2) 1.2 0.1
Supramaximal cycling exercise
FFA (molL-1) 0.03(0.07) 0.04(0.01) 0.09(0.01)a b c 16.7 <0.0001
Δ2FFA (molL-1) -0.03(0.01) -0.01(0.03) 0.06(0.09)a b 19.6 <0.0001
Lactate (mmolL-1) 11.4(1.2) 11.6(2.3) 11.8(1.3) 3.2 0.5
Values are mean (standard deviation).FFA: Free fatty acid,HOMA-IR: homoeostatic model assessment index,Δ1: the change in analyses measured between warm-up and rest,Δ2: the change in analyses measured between supramaximal cycling exercise and warm-up.
Significant difference with NW (a: p<0.01). Significant difference with OW (b: p<0.01). Significant difference with rest (c: p<0.01).
Discussion
To our knowledge, this study is the first to examine the effect of supramaximal exercise on plasma FFA concentrations in healthy adolescent boys across three body weight status groups. In the present study, the plasma FFA levels determined after SCE were significantly higher in the obese group than in normal-weight and overweight adolescents. Moreover, the relative anaerobic contributions to total energy release during bouts of SCE differed in obese adoles-cents compared with the other groups. Indeed, the anaerobic contributions to energy release decreased significantly in the OB group. These lower anaerobic contributions were accompa-nied by both lower AOD deficits and larger increases in oxygen uptake during SCE repetitions. These results suggest that in obese adolescent boys the energy supply seems to essentially con-sist of lipid mobilization and aerobic oxidation in response to SCE.
Table 3. Variables obtained during the supramaximal cycling exercise.
Normal-weight (n = 15) Overweight (n = 15) Obese (n = 15) Group effect (df = 2)
F P
1strepetition
HR (beatsmin-1) 113.4 (4.1) 113.1(2.8) 112.1(2.8) 1.4 0.6
PO (Wkg-1FFM-1) 11.1 (1.3) 11.4(1.1) 10.9(1.4) 22.7 0.3
VO2 uptake(mLmin-1kg-1) 6.1 (3.1)a 6.2(2.1)a 14.1(3.7) 19.2 <0.0001
AOD (mLmin-1) 104.5 (3.4)a 105.6(1.4)a 72.4(1.4) 23.7 <0.0001
Aerobic contribution (%) 6a 7a 17 19.7 <0.0001
Anaerobic contribution (%) 94a 93a 83 20.1 <0.0001
2ndrepetition
HR (beatsmin-1) 114.4(3.1) 113.2(3.1) 113.1(2.9) 1.3 0.4
PO (Wkg-1FFM-1) 11.2(1.3) 11.2(1.1) 11.1(1.4) 20.7 0.3
VO2 uptake(mLmin-1kg-1) 8.1(3.1)a 8.3(1.1)a 16.1(3.7)b 20.2 <0.0001
AOD (mLmin-1) 103.1(0.5)a 105.1(0.3)a 70.4(0.5)b 22.7 <0.0001
Aerobic contribution (%) 7a 8a 19b 18.7 <0.0001
Anaerobic contribution (%) 93a 92a 81b 20.4 <0.0001
3rdrepetition
HR (beatsmin-1) 116.4(4.1) 113.1(1.1) 117.9(1.8) 1.8 0.6
PO (Wkg-1FFM-1) 11.4(2.1) 11.2(1.1) 11.6(2.1) 22.3 0.6
VO2 uptake(mLmin-1kg-1) 7.1(3.1)a 7.3(1.1)a 19.1(3.7)b 19.2 <0.0001
AOD (mLmin-1) 103.9(5.3)a 105.6(0.9)a 67.4(1.2)b 20.9 <0.0001
Aerobic contribution (%) 7a 8a 22.6b 18.9 <0.0001
Anaerobic contribution (%) 93a 92a 77.4b 20.9 <0.0001
4threpetition
HR (beatsmin-1) 117.4(3.1) 118.4(2.1) 118.9(0.8) 1.9 0.6
PO (Wkg-1FFM-1) 11.3(2.8) 11.3(1.9) 11.1(2.2) 22.8 0.6
VO2 uptake(mLmin-1kg-1) 6.9(2.1)a 7.2(2.1)a 19.3(3.1)b 17.2 <0.0001
AOD (mLmin-1) 104.1(1.5)a 102.1(1.5)a 67.1(1.3)b 21.9 <0.0001
Aerobic contribution (%) 6.4a 6.6a 22.5b 19.9 <0.0001
Anaerobic contribution (%) 93.6a 93.4a 77.5b 19.5 <0.0001
Values are expressed as the mean (standard deviation).HR: heart rate,PO: maximal power output developed during the supramaximal cycling exercise,
VO2 uptake: oxygen uptake during repetition,AOD: accumulated oxygen,%: percentage. Significant difference with OB (a: p<0.01). Signi
ficant difference from the 1strepetition (b: p<0.01).
The performances demonstrated by participants during SCE satisfied the criteria for supra-maximal testing. Indeed, the PO did not change between the sprints in the SCE in any of the three groups. The current knowledge on lipolytic activity in obese persons, especially during childhood, was primarily obtained from indirect calorimetry and indicates that there is reduced fat oxidation in response to acute submaximal and maximal exercise in obese persons [21]. In the present study, the plasma FFA concentrations measured at rest were significantly higher in obese boys than in normal-weight and overweight boys. The same results were also reported in adults showing that excess body fat is associated with an increased basal FFA con-centration [22].
After the warm-up, the plasma FFA levels were similar to the rest values for normal-weight and overweight subjects but decreased significantly in obese boys and were lower than those of the normal-weight and overweight groups. To date, there is no information on the plasma FFA response to submaximal exercise in obese adolescents. Such information may be obtained in the present study if we consider the present warm-up (10 min at a submaximal power between 55–65 watts, corresponding to ~ 60% of VO2max) to be submaximal exercise. According to Pérez-Martin et al. [23], a lower lipid contribution to energy yield during a submaximal exer-cise test may be related to lower oxidative enzymatic activity in obese individuals. In adults, previous results showed a blunted lipolysis in obese women compared to normal-weight ones [24]. For these authors, the combination of heightened plasma insulin and diminished cate-cholamine and other counterregulatory hormone responses may account for subnormal plasma substrate increments in obese women during exercise. Additionally, Lanzi et al. [25] observed a blunted lipolysis in obese adults than in normal-weight during a submaximal incre-mental test reflecting the inhibitory role of increased insulin levels in lipolysis [26]. However, plasma FFA levels were higher probably due to greater adiposity and at high exercise intensities also due to the lower fat oxidation rate. This result suggests that the difference in the fat oxida-tion kinetics is likely linked to impaired muscular capacity to oxidize FFA in obese adults. Unfortunately, in the present work there is no information concerning the lipid oxidation that may be helpful to understand at least why plasma FFA level was lower than that reported in the adult study by Lanzi et al. [25].
The SCE was associated with a significant increase in the plasma FFA concentration only in the obese group. In normal-weight individuals, previous studies have shown that during intense exercise, there is a progressive decline in the plasma FFA response with increased blood glucose turnover responsible for energy yield [2]. However, the obese subjects exhibited higher plasma FFA levels than the normal-weight and overweight subjects. In fact, in both trained and untrained normal weight persons there is a reduction in fat oxidation in response to high inten-sity exercise that may be related to increased glycogen metabolism in muscle [27]. The limita-tion in fat use during high-intensity exercise stems in part from a decline in circulating fatty acids [28] during high-intensity exercise, beside of other contributing factors (e. g. muscle recruitment patterns, enzymatic capacities, substrate deliver) responsible of affecting substrate uptake during exercise [29]. Moreover, increasing FFA availability [30] as well as the differ-ences in lipolysis between visceral and peripheral fat depots [31] constitute as well another fac-tor affecting substrate uptake in obese individuals. In the present work, there is no data regarding the potential role of different fat depots on lipolysis during exercise.
SCE results from anaerobic contributions [3,4] as revealed by both the OW and NW groups. However, contrary to the above findings, the aerobic contributions to SCE performance in OB adolescent boys represent a significant portion of the energy supply which may result in lower rates of anaerobic glycolysis. This tendency, previously reported in normal-weight subjects [32], suggests that this incompatibility between anaerobic energy release and power output during supramaximal exercise is sometimes compensated for by the increased contributions of aerobic metabolism as reflected by the increase in oxygen consumption. Furthermore, the index of insulin resistance was deteriorated in obese adolescents. Indeed, it has been reported that insulin resistance diminished glucose transport and reduced glycogen synthase and pyru-vate dehydrogenase activity [30]. These abnormalities account for disturbances in the two major intracellular pathways of glucose disposal, glycogen synthesis and glucose oxidation [33]. Consequently, the increase in aerobic contribution observed in the current work reflects an increase in oxygen consumption to oxidize substrate which may be derived from FFA metabolites to supply energy for working muscle. This hypothesis is reinforced by the fact that we found a significant positive correlation between aerobic contribution and plasma FFA levels in response to SCE.
However, there are some limits in the current study. Firstly, the missing post-exercise changes in several metabolic and hormonal parameters (ex. insulin) may allow us to better understand the effect of such exercise on metabolic adaptations. Secondly, the standardized breakfast was not directly controlled during the study, then we cannot be sure if our instruc-tions were fully respected. Finally, our study participants were asked to rest the day before all testing. However, no one can assume that the participation to 1.5 hours physical education 36 to 48 hours before our experiment would not have any consequences on our blood
measurements.
Conclusion
The FFA concentrations measured immediately after SCE were higher in the OB group than in the OW and NW groups. Moreover, the aerobic contributions to SCE were significantly higher in obese adolescents and increased significantly during the 2nd, 3rdand 4threpetitions. Despite the general acceptance that higher basal levels of plasma FFAs is an indication of metabolic abnormality in obese individuals, the increase of this metabolite during SCE may reflect higher lipid solicitation to supply energy to working muscles. In addition, the higher aerobic contribu-tion observed in obese adolescent boys compared to normal-weight and overweight groups via SCE may suggest the existence of an alternative approach to deliver energy by FFA oxidation.
Acknowledgments
We are grateful for the cooperation and participation of the adolescents and their parents. We also thank to Émilienne Tudor Ngo Sock for their technical assistance.
Author Contributions
Conceived and designed the experiments: GJ HZ. Performed the experiments: GJ JML SLM. Analyzed the data: GJ HDI AP. Contributed reagents/materials/analysis tools: GJ JML SLM. Wrote the paper: GJ HDI AP JML.
References
1. Whyte LJ, Gill JM, Cathcart AJ. Effect of 2 weeks of sprint interval training on health-related outcomes in sedentary overweight/obese men. Metabolism. 2010; 59(10): 1421–1428. doi:10.1016/j.metabol.
2. Romijn JA, Coyle EF, Sidossis LS, Gastaldelli A, Horowitz JF, Endert E, et al. Regulation of endoge-nous fat and carbohydrate metabolism in relation to exercise intensity and duration. Am J Physiol.1993; 265: 380–391.
3. Greenhaff PL, Campbell-O’Sullivan SP, Constantin-Teodosiu D, Poucher SM, Roberts PA, Roberts PA, et al. An acetyl group deficit limits mitochondrial ATP production at the onset of exercise. Biochem Soc Trans. 2002; 30(2): 275–280. PMID:12023864
4. Fox EL, Mathews DK. Interval Training: Conditioning for Sports and General Fitness. Philadelphia: W. B. Saunders.1974.
5. Blimkie CJ, Sale DG, Bar-Or O. Voluntary strength, evoked twitch contractile properties and motor unit activation of knee extensors in obese and non-obese adolescent males. Eur J Appl Physiol Occup Phy-siol. 1990; 61(3–4): 313–318.
6. Duché P, Ducher G, Lazzer S, Doré E, Tailhardat M, Bedu M. Peak power in obese and nonobese ado-lescents: effects of gender and braking force. Med Sci Sports Exerc. 2002; 34(12): 2072–2078. PMID:
12471318
7. Sartorio A, Agosti F, De Col A, Lafortuna CL. Age and gender-related variations of leg power output and body composition in severely obese children and adolescents. J Endocrinol Invest. 2006; 29: 48– 54. PMID:16553033
8. Nevill ME, Holmyard DJ, Hall GM, Allsop P, van Oosterhout, A Burrin JM, et al. Growth hormone responses to treadmill sprinting in sprint and endurance-trained athletes. European Journal of Applied Physiology and Occupational Physiology. 1996; 72: 460–467. PMID:8925817
9. Trapp EG1, Chisholm DJ, Freund J, Boutcher SH. The effects of high-intensity intermittent exercise training on fat loss and fasting insulin levels of young women. Int J Obes (Lond). 2008; 32(4): 684–691.
doi:10.1038/sj.ijo.0803781PMID:18197184
10. Marker JC, Hirsch IB, Smith LJ, Parvin CA, Holloszy JO, Cryer PE. Catecholamines in prevention of hypoglycemia during exercise in humans. Am J Physiol. 1996; 260 (23): 705–712.
11. Tanner J. Growth at adolescence. Oxford: Blackwell Scientific Publications; 1962.
12. Craig CL, Marshall AL, Sjöström M, Bauman AE, Booth ML, Ainsworth BE, et al. International physical activity questionnaire: 12- country reliability and validity. Med Sci Sports Exerc. 2003; 35: 1381–1395. PMID:12900694
13. Slaughter MH, Lohman TG, Boileau RA, Horswill CA, Stillman RJ, Van Loan MD, et al. Skinfold equa-tions for estimation of body fatness in children and youth. Hum Biol. 1988; 60: 709–723. PMID:
3224965
14. McCarthy HD, Cole TJ, Fry T, Jebb SA, Prentice AM. Body fat reference curves for children. Int J Obes (Lond). 2006; 30: 598–602. PMID:16570089
15. Spiro SG. Exercise testing in clinical medicine. Br J Dis Chest. 1997; 71: 145–172.
16. Ramsbottom R, Nevill AM, Nevill ME, Newport S, Williams C. Accumulated oxygen deficit and short-distance running performance. J Sports Sci. 1994; 12(5): 447–453. PMID:7799473
17. Vandewalle H PG, Heller J, Monod H. Interests and limits of the speed-force relation in human. Science and Movement. 1988; 4: 38–46.
18. Van Beaumont W. Evaluation of hemoconcentration from hematocrit measurements. J Appl Physiol. 1972; 32: 712–713. PMID:5038863
19. Annunzio G, Vanelli M, Meschi F, Pistorio A, Caso M, Pongigline C, et al. The SIEDP Study Group. Valori normali di HOMA-IR in bambini e adolescenti: studio multicentrico italiano. Quad Pediatr. 2004; 3: 44.
20. Gastin PB, Costill DL, Lawson DL, Krzeminski K, McConell GK. Accumulated oxygen deficit during supramaximal all-out and constant intensity exercise. Med Sci Sports Exerc. 1995; 27(2): 255–263. PMID:7723650
21. Lazzer S, Busti C, Agosti F, De Col A, Pozzo R, Sartorio A. Optimizing fat oxidation through exercise in severely obese Caucasian adolescents. Clin Endocrinol (Oxf). 2007; 67: 582–588. PMID:17590171
22. Jensen MD, Haymond MW, Gerich JE, Cryer PE, Miles JM. Lipolysis during fasting. Decreased sup-pression by insulin and increased stimulation by epinephrine. J Clin Invest. 1987; 79: 207–213. PMID:
3540009
23. Perez-Martin A, Dumortier M, Raynaud E, Brun JF, Fédou C, Bringer J, et al. Balance of substrate oxi-dation during submaximal exercise in lean and obese people. Diabetes Metab. 2001; 27: 466–474. PMID:11547220
25. Lanzi S, Codecasa F, Cornacchia M, Maestrini S, Salvadori A, Brunani A, et al. Fat oxidation, hormonal and plasma metabolite kinetics during a submaximal incremental test in lean and obese adults. PLoS One. 2014;11; 9(2). doi:10.1371/journal.pone.0088707
26. Campbell PJ, Carlson MG, Hill JO, Nurjhan N. Regulation of free fatty acid metabolism by insulin in humans: role of lipolysis and reesterification. Am J Physiol. 1992; 263: 1063–1069.
27. Horowitz JF, Klei S. Lipid metabolism during endurance exercise. Am J Clin Nutr. 2000; 72: 558–563. PMID:10919960
28. Romijn JA, Coyle EF, Zhang X-J, Sidossis LS, Wolfe RR. Fat oxidation is impaired somewhat during high-intensity exercise by limited plasma FFA mobilization. J Appl Physiol. 1995; 79: 1939–1945. PMID:8847257
29. Egan B1, Zierath JR. Exercise metabolism and the molecular regulation of skeletal muscle adaptation. Cell Metab. 2013;5; 17(2): 162–184. doi:10.1016/j.cmet.2012.12.012PMID:23395166
30. Martin ML, Jensen MD. Effects of body fat distribution on regional lipolysis in obesity. J Clin Invest. 1991; 88(2): 609–613. PMID:1864970
31. Jensen DM. Lipolysis: Contribution from Regional Fat. Annual Review of Nutrition. 1997; 17: 127–139. PMID:9240922
32. Bogdanis GC, Nevill ME, Boobis LH, Lakomy HK. Contribution of phosphocreatine and aerobic metab-olism to energy supply during repeated sprint exercise. J Appl Physiol. 1996; 80(3): 876–884. PMID:
8964751