Comparison of three sets of reference equations
for spirometry in children and adolescents with
distinct body mass indices*
Comparação entre três equações de referência para a espirometria em crianças e adolescentes com diferentes índices de massa corpórea
Sarah Costa Drumond, Maria Jussara Fernandes Fontes, Irmgard de Assis, Marco Antônio Duarte, Joel Alves Lamounier, Luciana de Carvalho Lopes Orlandi,
Maria da Glória Rodrigues Machado
Abstract
Objective: To compare FEV1 and FVC, calculated using three sets of reference equations (devised by Polgar & Promadhat, Hsu et al. and Mallozi in 1971, 1979 and 1995, respectively), and to determine whether the three are similar in predicting lung function in children and adolescents with distinct body mass indices (BMIs). Methods: The
individuals were separated into four groups in accordance with the reference standards of the National Center for Health Statistics: underweight (UW), normal weight (NW), overweight (OW), and obese (OB). All were then submitted to spirometry. Results: We evaluated 122 healthy children and adolescents, aged 7-14 years. The FVC
values predicted for NW females and UW males through the use of the Hsu et al. equation were significantly higher than the measured values, as were the FEV1 values for UW females and males predicted via the Polgar & Promadhat and Hsu et al. equations. In NW females, the FEV1 values predicted via the Polgar & Promadhat equation were significantly higher than were the measured values. Conclusions: In individuals with distinct BMIs, the measured
FVC and FEV1 values were not equivalent to those predicted via the Polgar & Promadhat and Hsu et al. equations. The same was not true for the Mallozi equations. The BMI was not a relevant factor for the predictive index of these equations; therefore, the Mallozi equations can be used without alteration for children and adolescents with distinct BMIs.
Keywords: Spirometry; Reference values; Body mass index; Child; Adolescent.
Resumo
Objetivo: Comparar o VEF1 e a CVF, calculados a partir de três equações de referência (idealizadas por Polgar e
Promadhat, Hsu et al. e Mallozi em 1971, 1979 e 1995, respectivamente) e verificar se estas se equivalem ao predizer a função pulmonar em crianças e adolescentes com diferentes índices de massa corpórea (IMC). Métodos: Os
indi-víduos foram divididos em quatro grupos: baixo peso (BP), eutrófico (E), sobrepeso (SP) e obeso (O), de acordo com o padrão de referência do National Center for Health Statistics, e então submetidos ao teste espirométrico.
Resultados: Foram avaliadas 122 crianças e adolescentes saudáveis com idade entre 7-14 anos. Os valores de CVF
previstos pela equação de Hsu et al. nos grupos E (feminino) e BP (masculino), assim como os valores de VEF1 previstos pelas equações de Polgar e Promadhat e Hsu et al. nos grupos BP (feminino e masculino), foram signifi-cativamente superiores aos valores medidos. De acordo com a equação de Polgar e Promadhat, os valores de VEF1 previstos foram significativamente superiores aos valores medidos no grupo E (feminino). Conclusões: Não houve
equivalência dos valores de CVF e VEF1, medidos em indivíduos com diferentes IMC, e os previstos pelas equações de Polgar e Promadhat e de Hsu et al. O mesmo não ocorreu quando as equações de Mallozi foram utilizadas. O IMC não foi um fator importante para o índice preditivo nas equações de Mallozi, podendo ser utilizadas indistin-tamente em crianças e adolescentes com diferentes IMC.
Descritores: Espirometria; Valores de referência; Índice de massa corporal; Criança; Adolescente.
* Study carried out at the Centro Universitário de Belo Horizonte – UNIBH, Belo Horizonte University Center) – and at the Universidade Federal de Minas Gerais – UFMG, Federal University of Minas Gerais – Belo Horizonte, Brazil.
Correspondence to: Sarah Costa Drumond. Rua Muzambinho, 355, apto. 204, Anchieta, CEP 30310-280, Belo Horizonte, MG, Brasil. Tel 55 31 3378-8758. E-mail: [email protected]
Financial support: None.
as an independent variable to predict pulmonary function. However, there are no studies showing that these equations reflect pulmonary function in individuals with distinct BMIs.
The objective of the present study was to
compare FEV1 and FVC, calculated using the
three sets of reference equations mentioned above, and to determine whether the three are similar in predicting lung function in children and adolescents with distinct BMIs and without impairment of the respiratory system or of any other system.
Methods
We evaluated 122 healthy children and adolescents, aged 7-14 years, in three schools in the city of Belo Horizonte, Brazil. The individuals were separated into four groups based on their BMI: underweight, normal weight, overweight and obese.
The appropriate sample size, which was determined to be 122 participants, was calcu-lated using the following equation:
n 1 R R
R
2 2
2
= λ
(
−)
(α = 0.05; R2 = 0.70; λ = control value, which is
equivalent to a power of 80%).
Children and adolescents with acute or chronic respiratory diseases, those in the early postoperative period after thoracic or abdominal surgery and those who used medication regu-larly were excluded from the study, as were those with significant chest deformities, postural alterations, metabolic disorders, heart disease, neuromuscular diseases, genetic syndromes, psychological disorders or cognitive deficits.
The children and adolescents underwent an evaluation of the respiratory system consisting of anamnesis, measurement of vital signs, general assessment (static and dynamic), palpation, percussion and respiratory auscultation.
The International Study of Asthma and
Allergies in Childhood questionnaire,(23) which
comprises 12 questions about signs and symp-toms of asthma, allergies and bronchitis, as well as about smoking, was administered to exclude children and adolescents with asthma.
Pulmonary function was assessed using a Vitatrace VT 130 spirometer (Pró Médico Ltda., Rio de Janeiro, Brazil), according to the ATS
Introduction
Spirometry is a pulmonary function test that helps to prevent, identify and quantify respiratory
disorders.(1-3) In order to analyze the spirometric
measurements of each individual, it is necessary to compare them with normal spirometric values,
designated reference values.(4-6) These values are
derived from equations, obtained through the evaluation of a representative population group, with a sizeable number of nonsmokers without lung disease. Spirometric reference values vary according to gender (being 20% higher in males), age (reaching maximum values at 20 years of age in females and at 25 years of age in males), height (being higher in taller individuals), race
(FEV1 and FVC values being lower in Blacks),
technical factors (measurement instruments, posture/positioning of the individual, observer, procedure, computer programs, temperature and altitude) and weight, obese adults presenting reduced lung volumes (expiratory reserve volume
[ERV], residual volume [RV] and FEV1), reduced
capacities (functional residual capacity [FRC], vital capacity [VC], total lung capacity [TLC] and
FVC) and reduced expiratory flow rates.(7,8)
Due to differences in the reference values for pulmonary function, there are no equa-tions that can be recommended for application
in all patient populations.(9,10) These differences
among the equations in terms of theoretical values are so pronounced that the American Thoracic Society (ATS) recommends the selec-tion of equaselec-tions adapted to the particularities
of each population group.(11)
The nutritional status of individuals is asso-ciated with the integrity of their respiratory
system.(12) Obesity-related abnormalities of the
respiratory system in adults cause a reduction
in lung volumes and capacities (ERV, RV, FEV1,
FRC, VC, TLC and FVC), as well as in
expira-tory flow rates.(13-15) For children, data regarding
these abnormalities are limited and conflicting.
(16) Increases in body mass index (BMI) can
cause a reduction in pulmonary function.(17-19)
However, there are studies showing that there is an increase in spirometric values in overweight
or obese children.(12,20)
The reference equations proposed by Polgar
& Promadhat,(21) Hsu et al.(22) and Mallozi(7) have been used to calculate pulmonary function values
(FEV1 and FVC) in children and adolescents.
Statistics (NCHS), recommended by the World Health Organization.
The BMI for age was used to classify body composition, in accordance with the
NCHS reference standards(25): underweight
(BMI for age < 5th percentile); normal weight
(5th percentile ≤ BMI for age < 85th
percen-tile); overweight (85th percentile ≤ BMI for
age < 95th percentile); and obese (BMI for
age ≥ 95th percentile).
The statistical analysis of the data collected was performed using the program GraphPad Prism 5 (GraphPad Software Inc., San Diego, CA, USA). The data were analyzed through meas-urements of central tendency, and an unpaired Student’s t-test was used to describe the sample. One-way ANOVA was used to compare the FVC
and FEV1 values obtained using the equations
mentioned above,(7,21,22) and Dunnett’s post hoc
test was used for multiple comparisons. The level
of significance was set at 5% (p < 0.05).(26)
This study was approved by the Human Research Ethics Committee of the Federal University of Minas Gerais. The legal guardians of all participating children and adolescents gave written informed consent.
criteria.(11) This device is a bellows spirometer that
makes it possible to outline forced expiratory curves and basal respiratory cycle curves. Based on those curves, the values of the pulmonary function parameters are determined. The device was once considered appropriate, according to the previous ATS criteria, for evaluating pulmo-nary function. However, these spirometers are currently known to lose compliance with repeated use, after which they underestimate
pulmonary function values.(24) In order to avoid
this problem in the present study, the device was periodically calibrated and checked.
The parameters analyzed were FVC, FEV1 and
the Tiffeneau index (FEV1/FVC × 100).
The tests were performed with participants in the orthostatic position, with their heads in a neutral, fixed position. A nose clip was used. The children and adolescents were instructed to perform a maximal inspiratory maneuver followed by a maximal expiratory maneuver at maximal effort. The mouthpiece was prop-erly fitted to the mouth in order to prevent air leaks. All participants were verbally encour-aged to exhale forcefully until the end of the maneuver. Exhalation was interrupted after 6 s, after reaching a plateau. At least three FVC curves were obtained for each participant.
The spirometric data were analyzed using the reference equations devised by the authors
mentioned above(7,21,22) and shown in Table 1. In
order to assess the nutritional status of the chil-dren and adolescents, anthropometric data (age, weight and height) were collected. Weight and height were determined using a scale (Filizola, São Paulo, Brazil) and a tape measure, recorded to the nearest 1 g and to the nearest 1 mm, respectively. The anthropometric reference used was that of the National Center for Health
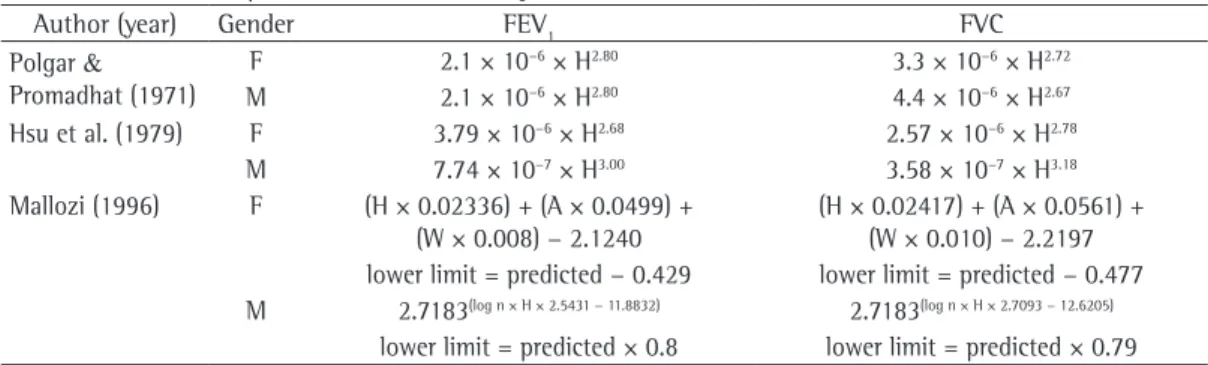
Table 1 - Reference equations used in the study.
Author (year) Gender FEV1 FVC
Polgar &
Promadhat (1971)
F 2.1 × 10⁻⁶ × H2.80 3.3 × 10⁻⁶ × H2.72 M 2.1 × 10⁻⁶ × H2.80 4.4 × 10⁻⁶ × H2.67 Hsu et al. (1979) F 3.79 × 10⁻⁶ × H2.68 2.57 × 10⁻⁶ × H2.78
M 7.74 × 10⁻⁷ × H3.00 3.58 × 10⁻⁷ × H3.18 Mallozi (1996) F (H × 0.02336) + (A × 0.0499) +
(W × 0.008) − 2.1240
(H × 0.02417) + (A × 0.0561) +
(W × 0.010) − 2.2197 lower limit = predicted − 0.429 lower limit = predicted − 0.477
M 2.7183(log n × H × 2.5431 − 11.8832) 2.7183(log n × H × 2.7093 − 12.6205)
lower limit = predicted × 0.8 lower limit = predicted × 0.79 H: height (cm). A: age (years); W: weight (kg). FEV1 and FVC values in liters.
Table 2 - Age and anthropometric data of participants
by gender.
Variable Males (n = 61) Females (n = 61)
Mean SD Mean SD
Age, years 10.3 2.3 10.5 2.3
Weight, kg 40.9 18.2 42.9 19.4
Height, cm 144 10 145 10
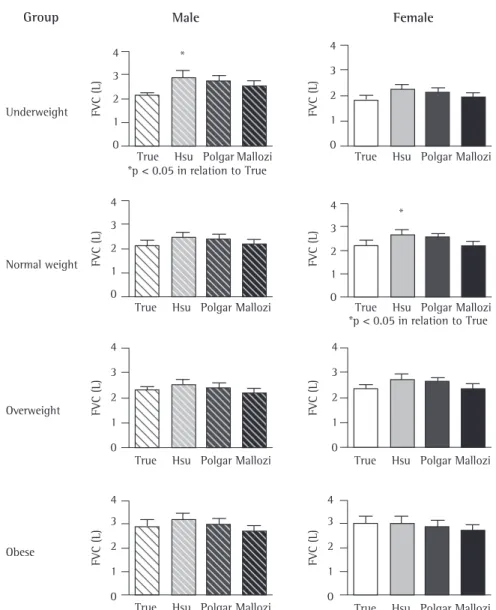
Figures 1 and 2 show the comparison, by BMI group, of the measured values and the values
predicted for FVC and FEV1, respectively, via the
three sets of equations used in this study.(7,21,22)
The FVC values for normal weight females and underweight males predicted via the Hsu
et al. equation(22) were significantly higher than
were the measured values. In normal weight, overweight and obese males, as well as in under-weight, overweight and obese females, there were no differences between the measured FVC values and the FVC values predicted via the three sets of equations.
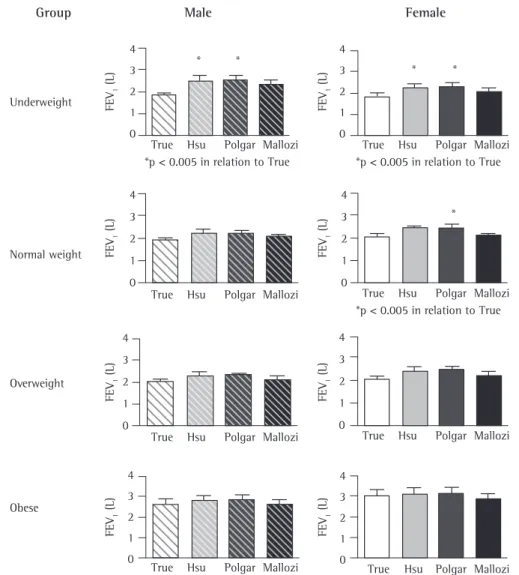
The FEV1 values for underweight males and
females predicted via the Polgar & Promadhat(21)
and Hsu et al.(22) equations were significantly
higher than were the measured values. In normal
weight females, the FEV1 values predicted via the
Polgar & Promadhat equation(21) were
signifi-cantly higher than were the measured values. In normal weight, overweight and obese males, as well as in overweight and obese females, there
were no differences between the measured FEV1
values and the FEV1 values predicted via the
three sets of equations.
Discussion
The results of the present study show that
spirometric values (FVC and FEV1) increase
proportionally in relation to an increase in BMI.
Results
A total of 122 children and adoles-cents—61 males and 61 females (mean age,
10.26 ± 2.26 years and 10.54 ± 2.26 years,
respectively)—were included in the study. The anthropometric characteristics of the sample as a whole are presented in Table 2. There were no differences between males and females in terms of anthropometric parameters.
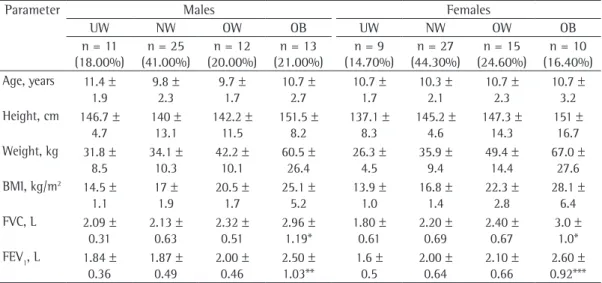
Table 3 presents the mean and standard deviation values for age, height, weight, BMI,
FVC and FEV1 of the population in the distinct
BMI groups by gender. There were no signifi-cant gender-related differences in terms of FVC
or FEV1 values. The FVC and FEV1 values were
found to increase in parallel with increases in BMI. The FVC values, for males and females, were significantly higher in obese participants than in underweight participants (p = 0.0279 and p = 0.0084 for males and females, respectively) and normal weight participants (p = 0.0075 and p = 0.0125 for males and females, respectively).
The FEV1 values were also higher in obese females
than in underweight females (p = 0.0084), as well as being higher in normal weight males than in underweight males (p = 0.0108). Table 3 shows that the obese participants were taller, which could explain the higher pulmonary func-tion values found.
Table 3 - Characterization of age, anthropometric parameters and pulmonary function in children and
adolescents, by gender and body mass index classification.
Parameter Males Females
UW NW OW OB UW NW OW OB
n = 11 (18.00%)
n = 25 (41.00%)
n = 12 (20.00%)
n = 13 (21.00%)
n = 9 (14.70%)
n = 27 (44.30%)
n = 15 (24.60%)
n = 10 (16.40%) Age, years 11.4 ±
1.9
9.8 ± 2.3
9.7 ± 1.7
10.7 ± 2.7
10.7 ± 1.7
10.3 ± 2.1
10.7 ± 2.3
10.7 ± 3.2 Height, cm 146.7 ±
4.7
140 ± 13.1
142.2 ± 11.5
151.5 ± 8.2
137.1 ± 8.3
145.2 ± 4.6
147.3 ± 14.3
151 ± 16.7 Weight, kg 31.8 ±
8.5
34.1 ± 10.3
42.2 ± 10.1
60.5 ± 26.4
26.3 ± 4.5
35.9 ± 9.4
49.4 ± 14.4
67.0 ± 27.6 BMI, kg/m2 14.5 ±
1.1
17 ± 1.9
20.5 ± 1.7
25.1 ± 5.2
13.9 ± 1.0
16.8 ± 1.4
22.3 ± 2.8
28.1 ± 6.4 FVC, L 2.09 ±
0.31
2.13 ± 0.63
2.32 ± 0.51
2.96 ± 1.19*
1.80 ± 0.61
2.20 ± 0.69
2.40 ± 0.67
3.0 ± 1.0* FEV1, L 1.84 ±
0.36
1.87 ± 0.49
2.00 ± 0.46
2.50 ± 1.03**
1.6 ± 0.5
2.00 ± 0.64
2.10 ± 0.66
been used to calculate the predicted spirometric values for children and adolescents.
In 1971, with the objective of devising reference equations for clinical use in
pedi-atric patients, Polgar & Promadhat(21) compiled
data from studies published between 1922 and 1969. These equations are used in Brazil. Those authors summarized the data from 12 studies by different authors and devised a new predic-tive equation that resulted from the mean of the reference equations published previously. These equations are used especially in Europe and the
United States. Hsu et al.(22) described
ventila-tory function in White, African-American and This is in accordance with the findings of some
reports in the literature,(12,14,20) which show a
correlation between BMI and pulmonary
func-tion, except for FEV1/FVC values, in adolescents
of both genders and in overweight children. However, the authors of a study comparing normal weight and obese patients reported
a reduction in FVC and FEV1 values that was
proportional to the increase in BMI.(27) This
discrepancy is probably attributable to meth-odological differences.
The FEV1 and FVC values found in the
present study were calculated using three sets of
reference equations.(7,21,22) These equations have
Group Male Female
Underweight
Normal weight
True Hsu Polgar Mallozi 4
3 2 1 0
FV
C
(L
)
FV
C
(L
)
FV
C
(L
)
FV
C
(L
)
FV
C
(L
)
FV
C
(L
)
FV
C
(L
)
FV
C
(L
)
4
3 2
1
0
*p < 0.05 in relation to True
*p < 0.05 in relation to True *
*
Overweight
Obese
True Hsu Polgar Mallozi
True Hsu Polgar Mallozi True Hsu Polgar Mallozi
True Hsu Polgar Mallozi
True Hsu Polgar Mallozi
True Hsu Polgar Mallozi
True Hsu Polgar Mallozi 4
3 2 1 0
4 3 2 1 0
4
3
2
1
0
4 3
2
1
0
4 3
2
1
0 4
3
2
1
0
Figure 1 - Comparison of the measured FVC values (True) and the FVC values predicted via the Polgar &
Promadhat and Mallozi found comparable
results in all age brackets, in both genders.(28)
There have been no studies comparing the three sets of equations, as proposed in the present study. Some values generated by the
three sets of equations for FVC and FEV1 in
122 children and adolescent with distinct BMI did not differ significantly. However, there were differences in normal weight and underweight
participants. The measured FVC and FEV1 values
were lower than the values predicted via the
Polgar & Promadhat(21) and Hsu et al.(22)
equa-tions. When we applied the Polgar & Promadhat
equation,(21) we found that the FVC and FEV
1 values predicted for normal weight and under-weight females were overestimated, as were the
FEV1 values predicted for underweight males. The
Mexican-American children and young adults, aged 7-20 years, and found that Mexican-Americans presented significantly lower values in comparison with Whites and significantly higher values in comparison with African-Americans.
Whereas those authors(21,22) used only height
as an independent variable, by means of power
models, in a wide pediatric age bracket, Mallozi(7)
used weight, age and height as variables in the models devised. That author proposed refer-ence equations that express the normal standard for a miscegenated and, therefore, genetically differentiated population, as is the case of the Brazilian population. However, Mallozi studied a small sample of the multiracial population in
the state of São Paulo, Brazil.(7) Despite working
with two isolated and distinct groups, Polgar &
Group Male Female
Underweight
Normal weight
True Hsu Polgar Mallozi
True Hsu Polgar Mallozi
True Hsu Polgar Mallozi
True Hsu Polgar Mallozi 4
3 2 1 0
FE
V1
(
L)
FE
V1
(
L)
FE
V1
(
L)
FE
V1
(
L)
FE
V1
(
L)
FE
V1
(
L)
FE
V1
(
L)
FE
V1
(
L)
4 3 2 1 0
4 3 2 1 0
4 3 2 1 0
4 3 2 1 0
4 3 2 1 0 4 3 2 1 0
4 3 2 1 0 *p < 0.005 in relation to True
True Hsu Polgar Mallozi *p < 0.005 in relation to True
True Hsu Polgar Mallozi
True Hsu Polgar Mallozi
True Hsu Polgar Mallozi *p < 0.005 in relation to True
* *
* *
*
Overweight
Obese
References
1. Pereira CA, Oliveira RC, Ribeiro M, Fuzi CE. Aplicações clínicas dos testes funcionais na asma. J Pneumol. 1993;19(7):129-36.
2. Sociedade Brasileira de Pneumologia e Tisiologia. I Consenso Brasileiro sobre Espirometria. J Pneumol. 1996;22(3):105-64.
3. Silva LC, Rubin AS, Silva LM, editors. Avaliação funcional pulmonar. Rio de Janeiro: Revinter; 2000. p. 11-31. 4. Cotes JE. Lung function throughout life; determinants
and references values. In: Cotes JE, editor. Lung function: assessment and application in medicine. Oxford: Blackwell Scientific; 1979. p. 329-88.
5. Dybkaer R, Gräsbeck R. Editorial: Theory of reference values. Scand J Clin Lab Invest. 1973;32(1):1-7. 6. Buist AS. Evaluation of lung function: concepts of
normality. In: Simmons DH, editor. Current pulmonology. Boston: Houghton Mifflin; 1983. p. 141-165.
7. Sociedade Brasileira de Pneumologia e Tisiologia. Diretrizes para Testes de Função Pulmonar. J Pneumol. 2002;28(Suppl 30):S1-S238.
8. Pereira CA, Barreto SP, Simões JG, Pereira FW, Gerstler JG, Nakatani J. Valores de referência para a espirometria em uma amostra da população brasileira adulta. J Pneumol. 1992;18(1):10-22.
9. Clausen JL. Prediction of normal values. In: Clausen JL, Abramson JF, editors. Pulmonary function testing guidelines and controversies: equipment, methods, and normal values. New York: Academic Press; 1982. p.49-59.
10. Crapo RO, Morris AH. Pulmonary function testing: sources of error in measurement and interpretation. South Med J. 1989;82(7):875-9.
11. Lung function testing: selection of reference values and interpretative strategies. American Thoracic Society. Am Rev Respir Dis. 1991;144(5):1202-18.
12. Fung KP, Lau SP, Chow OK, Lee J, Wong TW. Effects of overweight on lung function. Arch Dis Child. 1990;65(5):512-5.
13. Luce JM. Respiratory complications of obesity. Chest. 1980;78(4):626-31.
14. Rubinstein I, Zamel N, DuBarry L, Hoffstein V. Airflow limitation in morbidly obese, nonsmoking men. Ann Intern Med. 1990;112(11):828-32. Erratum in: Ann Intern Med. 1990;113(4):334.
15. Suratt PM, Wilhoit SC, Hsiao HS, Atkinson RL, Rochester DF. Compliance of chest wall in obese subjects. J Appl Physiol. 1984;57(2):403-7.
16. Li AM, Chan D, Wong E, Yin J, Nelson EA, Fok TF. The effects of obesity on pulmonary function. Arch Dis Child. 2003;88(4):361-3.
17. Schoenberg JB, Beck GJ, Bouhuys A. Growth and decay of pulmonary function in healthy blacks and whites. Respir Physiol. 1978;33(3):367-93.
18. Dontas AS, Jacobs DR Jr, Corcondilas A, Keys A, Hannan P. Longitudinal versus cross-sectional vital capacity changes and affecting factors. J Gerontol. 1984;39(4):430-8.
19. Chen Y, Horne SL, Dosman JA. Body weight and weight gain related to pulmonary function decline in adults: a six year follow up study. Thorax. 1993;48(4):375-80. 20. Dockery DW, Berkey CS, Ware JH, Speizer FE, Ferris
BG Jr. Distribution of forced vital capacity and forced
FVC values predicted for normal weight females
and underweight males, as well as the FEV1
values predicted for underweight females, were also found to be overestimated via the Hsu et al.
equation.(22) In contrast, the values predicted via
the equations proposed by Mallozi(7) were closer
to the measured values. The differences found in the present study might be explained by the ethnic differences between the countries and by the different procedures and methods used in selecting the reference sample.
Spirometric reference values are based on the analysis of environmental and personal factors, in healthy populations, according to specified
criteria, which can vary from study to study.(29)
These values should be periodically reviewed due to changes in the populations over time. Therefore, the characteristics of the populations should be observed and monitored. When the
Polgar & Promadhat(21) and Hsu et al.(22)
equa-tions are used in other countries, such as Brazil, in individuals who are different from those composing the original reference sample, this criterion is not met. Consequently, in order to choose a certain equation, the characteristics of the population should be considered so that this equation can represent the pulmonary function parameters more accurately.
The present study revealed that, in the age bracket and BMI range analyzed, in this sample of children and adolescents in the city of Belo
Horizonte, Brazil, the use of the Polgar &
Promadhat(21) and Hsu et al.(22) equations
signifi-cantly overestimated the spirometry results in normal weight and underweight participants. However, no differences were observed between
the FVC and FEV1 values measured in children
and adolescents with distinct BMIs and those
predicted via the Mallozi equations.(7) These
equations are more appropriate for this sample of children and adolescents aged 7-14 years. The BMI was not a relevant factor for the predictive index of these equations; therefore, the Mallozi
equations(7) can be used for children and
adoles-cents with distinct BMIs.
Acknowledgments
25. Kuczmarski RJ, Ogden CL, Grummer-Strawn LM, Flegal KM, Guo SS, Wei R, et al. CDC growth charts: United States. Adv Data. 2000;(314):1-27.
26. Pagano M, Gauvreau K. Princípios de bioestatística. São Paulo: Thomson Pioneira; 2004. 506p.
27. Ladosky W, Botelho MA, Albuquerque JP Jr. Chest mechanics in morbidly obese non-hypoventilated patients. Respir Med. 2001;95(4):281-6.
28. Ladosky W, Andrade RT, Loureiro NG, Botelho MA. Comparação entre os valores teóricos para alguns dados espirométricos em crianças determinados pelas equações de Mallozi e de Polgar. J Pneumol. 2002;28(3):125-30. 29. Becklake MR. Concepts of normality applied to
the measurement of lung function. Am J Med. 1986;80(6):1158-64.
expiratory volume in one second in children 6 to 11 years of age. Am Rev Respir Dis. 1983;128(3):405-12. 21. Polgar G, Promadhat V, editors. Pulmonary function
testing in children: techniques and standards. Philadelphia: Saunders; 1971. 273p.
22. Hsu KH, Jenkins DE, Hsi BP, Bourhofer E, Thompson V, Tanakawa N, et al. Ventilatory functions of normal children and young adults--Mexican-American, white, and black. I. Spirometry. J Pediatr. 1979;95(1):14-23. 23. Worldwide variations in the prevalence of asthma
symptoms: the International Study of Asthma and Allergies in Childhood (ISAAC). Eur Respir J. 1998;12(2):315-35.
24. Pereira CA, Sato T, Rodrigues SC. New reference values for forced spirometry in white adults in Brazil. J Bras Pneumol. 2007;33(4):397-406.
About the authors
Sarah Costa Drumond
Professor. Faculdade de Ciências Médicas de Minas Gerais – FCMMG, Federal University of Minas Gerais School of Medical Sciences – Belo Horizonte, Brazil.
Maria Jussara Fernandes Fontes
Adjunct Professor III. Department of Pediatrics, Universidade Federal de Minas Gerais – UFMG, Federal University of Minas Gerais – School of Medicine, Belo Horizonte, Brazil.
Irmgard de Assis
Pediatric Pulmonologist. Universidade Federal de Minas Gerais – UFMG, Federal University of Minas Gerais – Hospital das Clínicas, Belo Horizonte, Brazil.
Marco Antônio Duarte
Associate Professor I. Universidade Federal de Minas Gerais – UFMG, Federal University of Minas Gerais – School of Medicine, Belo Horizonte, Brazil.
Joel Alves Lamounier
Full Professor. Department of Pediatrics II. Universidade Federal de Minas Gerais – UFMG, Federal University of Minas Gerais – School of Medicine, Belo Horizonte, Brazil.
Luciana de Carvalho Lopes Orlandi
Professor. Faculdade de Ciências Médicas de Minas Gerais – FCMMG, Federal University of Minas Gerais School of Medical Sciences – Belo Horizonte, Brazil.
Maria da Glória Rodrigues Machado