Estimation of the Reliability of Distributed Applications
Marian CRISTESCU1, Laurenţiu CIOVIC 2
1
Lucian Blaga University of Sibiu, Romania
2
Academy of Economic Studies, Bucharest, Romania [email protected], [email protected]
In this paper the reliability is presented as an important feature for use in mission-critical distributed applications. Certain aspects of distributed systems make the requested level of reliability more difficult. An obvious benefit of distributed systems is that they serve the global business and social environment in which we live and work. Another benefit is that they can improve the quality of services, in terms of reliability, availability and performance, for the complex systems. The paper presents results of a study conducted by the students of Economic Informatics at the University "Lucian Blaga" Sibiu, over four months. The studied population was represented by several distributed applications made under the object oriented programming techniques. This study aimed to estimate the reliability of these applications using object-oriented design metrics validation techniques.
Keywords: Distributed Applications, Software Reliability, Software Metrics, Fault, Tolerance
Introduction
Communications software services and distributed applications for the next generation must be reliable, efficient, flexible and extensible. For example, applications such as real time communication between personal computers, and flight surveillance systems must be highly available and scalable to meet the required level of reliability and performance requirements. In addition, these applications must be flexible and expandable to meet their inherent complexity and quickly respond to application requirements changes.
Distributed systems are the foundation of the next-generation communications systems, including electronic commerce, satellite surveillance systems, distribution and medical imaging, real time data processing systems, flights surveillance.
A reliable distributed application is defined in [3] as "a system whose behavior is predictable, in spite of partial failures, asynchrony, and reconfiguration." For example, partial failures are an inherent problem in distributed systems. The average of good working time, for the distributed system components, decreases rapidly as the number of compute nodes and communication links increases.
Distributed systems consist of processes
running in parallel on heterogeneous platforms, and therefore are prone to conditions of "stress", communication errors, failures in communication nodes, and bottlenecks. Thus, distributed systems are often more difficult to develop, manage, and maintained at an appropriate level of performance than centralized systems.
2 Reliability - Major Software Quality Features
The reliability modern approach aims at defining techniques and methods which interacts throughout all the specific development cycle processes ensuring that each stage of software production have a high level of reliability. It is an active mode of increasing the software reliability during the design, coding, respectively during other stages of the development cycle. No changes are expected to be made on a finished product, but occur during the process in order to use such resources that what is obtained is reliable.
Further in the article will be referred to economical applications, dedicated to organizational structures oriented to production and services called Enterprise
vendors, the reliability of informatics systems of organizations is increasing becoming critical for companies, clients and business partners. Because a failure of an application will result in loss of business and the significant costs of repair, and because the Internet environment is always open for business, companies require that the reliability of Enterprise Applications, to be assessed and analyzed continuously. The emergence of the Internet has made from information and directly, from accessing it without the error, the most valuable asset for a company.
Enterprise Applications is a collection of hardware, operating system services, software components, and very often human processes, working together to ensure the expected processing service. Reliability of the entire application is highly dependent on the reliability of each component. Because all components in a system are closely related, a failure of a component will affect the reliability of others, and hence the whole system.
Failures in the operation of distributed applications occur due to many aspects of which are mentioned:
inadequate testing;
issues of changing management;
operations errors
low quality code source;
lack of a coherent process of quality assurance;
interactions with external services or
applications;
different operating conditions - high levels of utilization and overload;
random events - security failures;
hardware failure - hard drives, network equipment, servers, power sources, memory, CPU.
Issues related to the operational environment
Therefore, their reliability refers to how well a distributed application assures the service which has been defined in functional specifications, accurately and without error. In addition to how much an application runs without errors, the software reliability refers to how well it delivers accurate data and to error detection and recovery in order to avoid failures.
The reliability of a distributed application is considered in [4] as "a measure of the ability of an application to operate as long as possible without recording any failures". Depending on the type of application, it is possible that long-term reliability may not be a concern for those who develop them. For the analysis, we take, for example, the flight surveillance systems. The system availability requirement is high – it must be available when a landing request is received.
On the other hand, the reliability requirement is quite low since the system does not remain operational for a long period of time. The system reliability is often measured as being the mean time until an error appears (Mean Time to Failure), and is expressed by:
MTTF = Working hours / Number of failures (1)
According to [6], an important approach to software reliability is one that says: “an error will occur only when the application is available and running”. Consequences of errors apparitions vary from: not providing the service to providing an incorrect service and to generate incorrect data and affect the stability of the system. Meanwhile some defects are just inconvenient, others vary from interruptions caused by loss of time, when the bought system is not too much requested to respond to a new acquisition
request, until serious inconveniences like: a stock system that has no resources to accept a new authentication or a major disaster when a ship's navigation system fails.
3 Reliability Analysis of Components and a Whole System
component during the test, etc. However, it is difficult for conventional methods of reliability assessment to estimate the established parameters for each component. If it is taken into account the reliability of each component on overall system reliability, it is necessary to specify the size of each component, how to report and correct errors during the development of components and the number of links between components, etc.
Software reliability growth models have been used as conventional methods for evaluating
software reliability management process and quality control and testing process. Among others, inhomogeneous Poisson processes models (NHPP) are taken into account as they can be easily applied in the development of object-oriented software.
As mentioned above, by applying the logarithmic Poisson model of execution time, and relying on the assumption that during the testing processing the number of defects decreases, we obtain the following structure represented by the average value function μ:
(2) Information on the actual number of defects
detected in the system is important for estimating the progress of operational procedures. Because it is a random variable,
in the previously mentioned model for the estimation of its value, the following expressions are used [7]:
(3)
where:
E[S(t)] is the estimated number of detected defects till moment t.
3.1 Correlation Error – Failure Operation
Establishing the meaning of this correlation requires understanding the following terms:
"failure in process" – a deviation operation way of a system of programs from the user requests – the failure can be in a shape of a “fall” which forwards this to the state in which the system does not function anymore, or it can be a simple dysfunction like, for instance, incorrect display of a character to the screen;
“the intensity of failure” – number of failed runs of a system of programs, that appear in a given time schedule – an alternative way of expressing the reliability of the software.
“Error” – a fault in the system of
programs which leads to a “functional failure”.
"operational profile" - the set of functions required for the implementation of a software system - later they may be "damaged" by entering data, they affect the implementation - involving, at all times, the probability of events occurrence.
Of utmost importance to understand the significance of the process for estimating software reliability is, achieving the distinction between "operational failure - malfunction or failure" and "error". Any situation where a program does not work in such a way as to meet the user needs, is regarded as an "operational failure" - malfunction, while the "error" is the current failure of the program code segment that causes an "operational failure."
focused almost exclusively on counting the number of errors occurring in a software program or system, essentially reflecting the meaning of research in this area.
During the system testing phase, the researchers checked the operations executed by a distributed application and compare them with user requirements, performing error correction. This phase is the stage of code writing and testing small program units - modules - that are "made" under the initial "project" by the software engineers who aim to satisfy user requirements determined by the system analysts.
Software Reliability is affected by three factors:
the introduction of errors;
eliminate errors;
use of software systems.
Number of introduced errors depends essentially on the "quantity" of code developed - the number of instructions added or modified through which programmers creates new facilities or eliminate errors. Errors are detected and removed as a software system is running and operational defects appear.
Software reliability models come closer to an average characteristics than to a specific behavior, because the random use of software systems and introduction of defects generates errors generates defects that have an unsystematic-random feature.
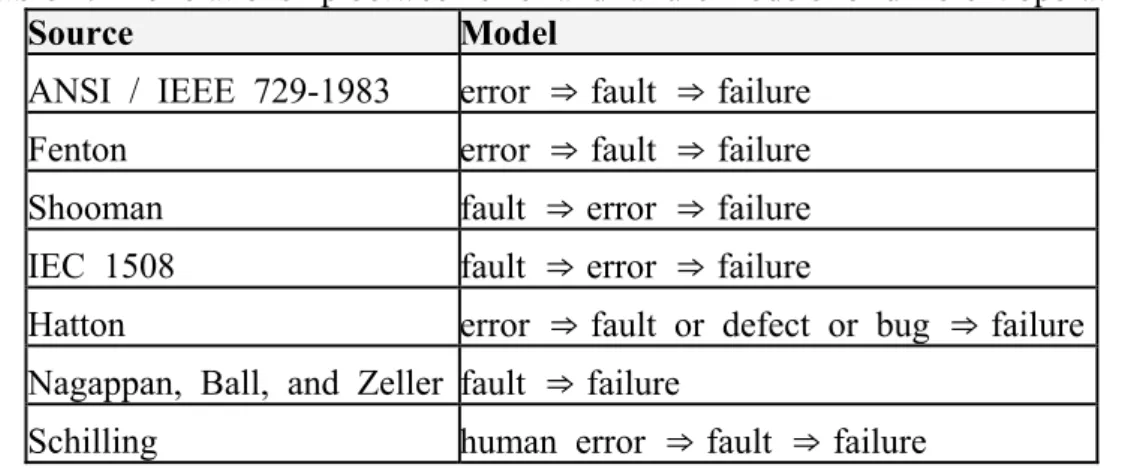
The following table presents the relations between the two concepts in different models of reliability:
Table 1. The relationship between error and failure models for different operating
Source Model
ANSI / IEEE 729-1983 error ⇒ fault ⇒ failure
Fenton error ⇒ fault ⇒ failure
Shooman fault ⇒ error ⇒ failure
IEC 1508 fault ⇒ error ⇒ failure
Hatton error ⇒ fault or defect or bug ⇒ failure
Nagappan, Ball, and Zeller fault ⇒ failure
Schilling human error ⇒ fault ⇒ failure
A software error is a dynamic property and represents an unexpected deviation of a program system from the operational
characteristics. If a software component is not running, then it cannot cause an error.
Operational failures arising from the presence of one or more software errors are activated by a particular set of input stimuli. Any error can cause a failure in a system of programs, but not all errors will result in failures, as shown graphically in Figure 1. This analysis suggests that detection and removal of a large number of errors does not necessarily lead to a higher level of reliability. Instead, it is important to focus on errors associated with a shorter MTTF interval.
4 Estimation of Reliability for Distributed Applications with the Help of Software Design Validation Metrics
Developing distributed applications is an activity that consumes time and resources. Even if the degree of automation of software development activities increased, resources are an important limitation. Software metrics are needed to identify the place where resources are needed; they are an extremely important source of information for decision making.
Testing distributed applications is an example of an activity that consumes time and resources. Applying equally, tests and verification effort to all system components, has become a business point of view of the prohibitive cost involved. It is therefore necessary to identify modules that cause problems such as testing and verification effort to focus on these classes. Thus, metrics availability, for product design, to characterize fault-prone modules is vital.
The introduction of OO technology in the software industry has created new challenges for companies that use metrics as a tool for monitoring, control and improvement in software development or maintenance. Therefore, metrics that reflect the specificity of OO programming paradigm must be defined and validated for use in the software industry. Thus, it was concluded that the "traditional" metrics for product are not sufficient for characterization, evaluation and prediction of quality object-oriented software systems.
4.1 Description of the Study Case
To validate experimentally the proposed object-oriented metrics [2], taking into account their ability to make predictions about the likelihood of defects, a study was conducted during four months (from September to December, 2009). Metrics analyzed are:
The importance (significance) of methods from a class (WMC – Weighted Methods per Class) - measures the complexity of individual classes. If we assume that all class methods are equally complex, then WMC expresses the number of methods defined in each class. However, WMC is defined as "the number of states and operators of all functions defined in every classroom" [2];
Depth of Inheritance Tree of a class (DIT - Depth of Inheritance Tree of a class) – is defined as the maximum depth of the inheritance tree of each class. C++ language allows multiple inheritances and because of that classes can be organized in acyclic directed graphs instead of trees. In some cases is considered that DIT measure “the number of ancestors of a class”. The hypotheses which stands at the foundation of this matrix is the one who starts from the presumption that object oriented programs, well designed, are structured as “forests of classes” instead of an wide inheritance grid. In other words, a class positioned deep in the inheritance grid it presumes to be more prone to error because the class inherited a big number of definitions from the predecessors.
Coupling between object classes (CBO - Coupling between Object classes) – A class is attach to another class if she uses her member function or/and instance variables. CBO defines the number of classes with witch is attach the specified class. The hypothesis witch stand at the foundation of this matrix is, in general, as a class is coupled with many others object classes, the class is more prone to errors. So attaching between classes should be determinate for focusing the testing process and/or for changes made upon those classes.
Response from a class (RFC) determines the number of methods which is possible to be executed as a response to a message received by an object of this class es. RFC is, also, the number of functions called, directly, by the member functions or by the operators of a class. The hypotheses which stand at the foundations of this matrix specify this fact: when the suite of responses of a class increases, then increases the rank of complexity of the class, this being more prone to errors and by default is more difficult to change.
Lack of cohesion on methods (LCOM – Lack of Cohesion on Methods) – specify the numbers of pairs of member functions who do not share instance variables minus the number of pairs of member functions that share instance variables. Anyway the matrix is set to Zero; in any situations in which the decrease functions produce a negative result. A class with low cohesion between its methods suggests an inappropriate design which is probably due to many errors (e.g. encapsulation of unrelated objects and functions of the program states, which should not be combined).
The studied population was represented by several applications made by the students of Economic Informatics section from the University “Lucian Blaga” of Sibiu. Students were not required to have prior experience or training in the application or object oriented
methods. All students have “prior experience” in the programming field in C or C++ and the relational data bases and so they have the necessary skills of doing this kind of experiment. Students were grouped at random, eight in each team, each team has developed a system, medium size, for information control which will allow directing activities conducted in a rental center videotapes and maintenance of databases of customers and videotapes.
The development process was conducted in accordance with the sequential lifecycle model of software engineering, derived from the cascade model. This model includes the following phases: analysis, design, implementation, testing and maintenance. At the end of each of these phases has been synthesized information’s and has been tried compiling. At the end of each of these phases has been synthesized and tried compiling specific information of "document": document analysis, document design, code annexes containing reports on errors, and finally annexes containing the source code changes. Required specifications and design documents have been validated for the purposes of verifying that the match system requirements. Errors discovered in these first two phases have been communicated to students. This was meant to be done to increase the chances of implementation starting with an analysis, a correct concept of OO design.
The testing phase was conducted by an independent group composed of developers with more "experience" in software development. This group tested all systems through similar tests plans and functional test techniques. During the debugging phase, students were asked to correct their system based on errors discovered by an independent testing group.
Students' recommendations were made to use
the following libraries: a) MotifApp - This library provides a set of
through a style object-oriented design and programming.
b) GNU Library - This library comes from C++ programming environment [GNU].Contains functions for manipulating strings, files, lists, etc.. c) Database library C++ - This library provides a C++ implementation of multi-type multi-indexed B-trees.
A minimal training was provided to students on how to use these libraries. Thus, a tutorial type "guide" was offered of how to implement OSF / Motif applications. In addition, a programmer familiar with C++ OSF / Motif applications has been available to them to answer all the questions on the use of mini-systems OSF / Motif and libraries.
4.2 Results Analysis
Below are the results obtained in estimating
whether the OO design metrics defined in [2] estimates are useful for error-prone classes. This is intended to be used to assess these metrics as indicators of quality and to determine how common metrics to compare the code. Attempts to provide empirical validation, a fact which is considered to be necessary before any attempt to use such metrics as indicators of quality primary objective
Table 2 provides descriptive statistics of the distributions of common matrix. These results indicate that inheritance hierarchies are somewhat uniform (DIT), and classes have, in general, few survivors (NOC). In addition, most classes show a lack of cohesion (LCOM) close to 0. This last matrix is not too good differentiates the classes which may impede its way down and not allow any negative position.
Table 2. Descriptive statistics of OO metrics analyzed
WMC DIT RFC NOC LCOM CBO
Maximum 99.00 9.00 105.00 13.00 426.00 30.00
Minimum 1.00 0.00 0.00 0.00 0.00 0.00
Median 9.50 0.00 19.50 0.00 0.00 5.00
Average 13.40 1.32 33.91 0.23 9.70 6.80
Standard Deviation 14.90 1.99 33.37 1.54 63.77 7.56
Descriptive statistics are useful in interpreting the results of the analysis; in addition, they will facilitate actions to compare future results with similar studies.
4.3 Analysis Methodology
The response variable which is used to evaluate OO design metrics is binary. For example, if a class was detected causing problems during the test phase is recommended to use logistic regression to analyze the relationship between metrics and fault-prone classes. Logistic regression is a classification technique used in many scientific experiments based on maximum likelihood estimates. In particular, univariate
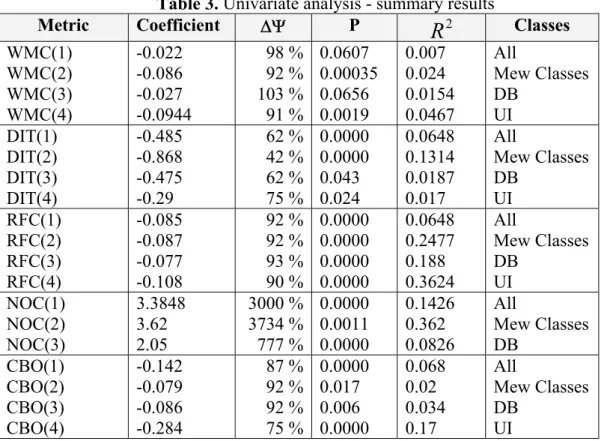
Table 3. Univariate analysis - summary results
Metric Coefficient P 2
R
Classes WMC(1) WMC(2) WMC(3) WMC(4) -0.022 -0.086 -0.027 -0.0944 98 % 92 % 103 % 91 % 0.0607 0.00035 0.0656 0.0019 0.007 0.024 0.0154 0.0467 All Mew Classes DB UI DIT(1) DIT(2) DIT(3) DIT(4) -0.485 -0.868 -0.475 -0.29 62 % 42 % 62 % 75 % 0.0000 0.0000 0.043 0.024 0.0648 0.1314 0.0187 0.017 All Mew Classes DB UI RFC(1) RFC(2) RFC(3) RFC(4) -0.085 -0.087 -0.077 -0.108 92 % 92 % 93 % 90 % 0.0000 0.0000 0.0000 0.0000 0.0648 0.2477 0.188 0.3624 All Mew Classes DB UI NOC(1) NOC(2) NOC(3) 3.3848 3.62 2.05 3000 % 3734 % 777 % 0.0000 0.0011 0.0000 0.1426 0.362 0.0826 All Mew Classes DB CBO(1) CBO(2) CBO(3) CBO(4) -0.142 -0.079 -0.086 -0.284 87 % 92 % 92 % 75 % 0.0000 0.017 0.006 0.0000 0.068 0.02 0.034 0.17 All Mew Classes DB UITable 4. Multivariate analysis of OO design metrics
Coefficient P
Interruption 3.13 0.0000
DIT RFC NOC RFC CBO -0.50 -0.11 -2.01 -0.13 -0.238 0.0004 0.0000 0.0178 0.0072 0.0001
Source -1.84 0.0000
For each metric, the following statistics are available:
Coefficients (presented in Tables 3 and 4) express the estimated regression coefficients. When the absolute value of the coefficient is higher, the impact of explanatory variables on the probability p of detecting errors in a class, is higher;
- (appears only in Table 3) - is based on the notion of odd rate [5] and provides an assessment of the impact of variable
metric response. Odd rate (X) is the ratio between the probability of an error and the probability of not having an error when X is the metric value. For example, if for a given value X, (X) is 2, then is twice more probably that a class to contain errors than that class not to contain errors. The value of (X) is calculated as the average of the following formula:
X X 1
(4)
So (X) expresses the reduction / increase of the odd rate (expressed as a percentage in
intuitive picture of the impact the explanatory variables have.
Statistical significance p (appearing in Tables 3 and 4) provides a more detailed picture of the accuracy of the estimate coefficients. Provides information about the probability that the ratio is different from 0, by accident. From a historical point of view of the significance threshold of p = 0.05 (5% probability) has often been used to determine whether an explanatory variable was a significant predictor. However, choosing a particular level of significance is ultimately a subjective decision and other levels as p = 0.01 or p = 0.1 are normal values. Also, as the significance level is higher, the higher the standard deviation of estimated coefficients is growing and the credibility of the calculated impact of calculated variables is decreasing. Significance test is based on a likelihood ratio test [5], used routinely in logistic regression.
4.4 Univariate Analysis
It is a method of analysis of OO design metrics, on the probability of detecting errors in a class during testing phases. If this analysis is equivalent to the logistic model, with the probability that a single error is detected in a classroom.
Importance (significance) methods of a class (WMC) was presented (see Tables 3 and 4) as somewhat significant (p = 0.06). For new and modified classes extensively, and UI classes (graphical and textual user interface), the results are much better: p = 0.0003 and p = 0.0001 respectively. As expected, the WMC is higher as the greater likelihood of detecting errors. These results can be explained by the following fact: the internal complexity has no impact if the class is reused with minor modifications. In this case, the properties interface class will have a significant impact;
Depth of inheritance tree of a class (DIT) - as shown in Tables 3 and 4 is shown to be highly significant (p = 0.0000). As
expected, as the DIT is higher, the probability of error detection increases. The results are improved again (logistics increases from 0.06 to 0.13) when only the new and modified extensively classes are taken into account;
The response from a class (RFC) was shown, based on data from Tables 3 and 4 that is highly significant (p = 0.0000). The RFC is greater, the greater the likelihood of detecting an error. However, logistic parameter R2 has been significantly adjusted for the classes in November, for the extensively modified classes and user interface – UI (from 0.06 to 0.24 respectively 0.36). The UI classes’ shows a distribution that differs significantly from that of DB classes: average and median are significantly higher. As a result, it can strengthen the impact that RFC has when the analysis was made;
The number of successors of a class (NOC) seems to be very significant (except for UI classes) but the trend (based on data in Tables 3 and 4) is contrary to what is expected. The NOC is higher, the probability of detection error decreases. This surprising trend may be explained by the fact that most classes have more than one heir, and that actual reuse of classes is somehow associated with a higher value for NOC. As it was shown that reuse is an important influencing factor of density errors [1], this explains why the classes that have higher values for NOC are less prone to errors. However, there is some instability among subsets of classes about the impact of NOC metrics on the probability of detecting errors in a class (see Table 3).
Lack of cohesion of methods (LCOM) - the observations made proved to be meaningless for all cases (which is why the results aren’t presented in Table 3), which was expected given that the distribution indicates LOCM lack of variety and few major things;
UI classes (p = 0.0000 and = 0.17). There is no satisfactory explanation for the differences between UI and DB model classes.
It is important to remember, when the results from table 3 are analyzed, that the various metrics have different units. Some of these are “big steps” on each representative measuring scale, while others are “smaller steps”. As a consequence some coefficients shows a little impact (e.g.(X)) when they are compared with others. However, this is not a criterion for validation to evaluate predictive utility of these metrics.
More important is the fact that, excepting metrics NOC, all other metrics seem to have a very stable impact on different categories of classes (DB, UI, etc.), and this is encouraging because it allows extracting a conclusion on the fact that the type’s variables are generally comparable. If it had been taken into account various types of defects separately, the results would have been different.
5 Conclusions
In this experiment, were collected data on the errors encountered in object-oriented classes. Based on these data was examined how much the predisposition to form internal features was influenced (e.g. size and cohesion) and external (e.g. coupling) of OO classes. From the results presented above, five of the six metrics used to estimate appear to be useful to make the prediction about error-prone classes in primary phases of the life cycle. This empirical validation shows that most of these metrics can be used as indicators of quality. In addition, many of these metrics appear to be complementary indicators that are relatively independent of the others.
Also it can be said that OO matrix used appear to be better predictors than the best set of "traditional" matrix for code that can be applied to the collected data set, and which, moreover, can only be collected in the final stages of the process of developing OO software systems.
Through this case study was aimed at
obtaining a better understanding of the impact of OO design strategies (e.g. simple than that multiple inheritance) on the density of errors and reprocessing, but because of "difficulties" encountered in data collection it wasn’t possible to analyze the ability to make predictions of OO matrix related to reprocessing. It should be noted that this obstacle could be overcome by "improving" the process of collecting data to determine how much effort was made to every class. Studying the differences between the various OO languages, in accordance with the definitions of metrics and with the experimental results represents another deserve factor worth mentioning. Thus, the predictive capabilities of the propensity to errors of the set of metrics, analyzed in this experiment may be different, depending on the programming language used. To assess this capability set of OO design, metrics must be validated within OO programming languages (e.g. C + +, Java, etc.).
References
[1] V. R. Basili, L. Briand, W. Melo, “Measuring the Impact of Reuse on Quality and Productivity in Object-Oriented System”, Technical Report, University of Maryland, January 2005, CS-TR-3395.
[2] G. Barnes, B. Swim, “Inheriting Software Metrics”, Journal of Object-Oriented Programming, November-December, 2003, pp.27-34.
[3] K. P. Birman, R. van Renesse, Reliable Distributed Computing with the Isis Toolkit, IEEEComputer Society Press, 2004.
[4] E. Gamma, R. Helm, R. Johnson, J. Vlissides, Design Patterns: Elements of Reusable Object-Oriented Software, Reading, MA: Addison-Wesley, 2005. [5] D. Hosmer, S. Lemeshow, Applied
Logistic Regression, Wiley-Intersciences, 1999, pp.56-92.
[7] D. C. Schmidt, A. Gokhale, T. Harrison, G. Parulkar, “A High-Performance Architecture for Real-time CORBA”, IEEE Communications Magazine, vol.
14, February 2007.
[8] D. A. Young, Object-Oriented Programming with C++ and OSF/MOTIF, Prentice-Hall, 2002.
Marian-Pompiliu CRISTESCU has graduated the Faculty of Planification and Economic Cybernetics in 1985, he holds a PhD diploma in Economics from 2003, obtained at the Faculty of Cybernetics, Statistic and Economic Informatics from the Academy of Economic Studies in Bucharest. Between 1985 and 1991 he worked as an analyst – programmer at the I.A.C.M Computation Office in Olt – Slatina and at the Electronic Computation Territorial Center in Sibiu. In 1991 he joined the university teaching system. Presently, he is a full assistant professor in Economic Informatics at the Faculty of Economic Sciences - “Lucian Blaga” University of Sibiu. He is the author of 8 books and over 60 scientific articles in the field of software quality, programming environments, data bases and economic informatics systems. He is equally focused on software development, being the author or co-author of over 25 programming systems for economic management. He has participated as a project director or as a leading team member at 8 research contracts. He is an active member of the scientific and editing committee for the following magazines and journals: Economic Informatics, Journal of Applied Quantitative Methods, The Economic Magazine edited by the Academy of Economic Studies of Moldavia – Chişin u and the „Lucian Blaga” University of Sibiu. He has participated in the scientific committee of over 10 national and international conferences, for the Informatics section and has coordinated the editing of 2 volumes with the projects of some international scientific conferences.