Vol-7, Special Issue-Number2-April, 2016, pp1049-1055 http://www.bipublication.com
Case Report
The relationship between monetary policy and bank lending behavior and
the influence of bank specific features on this relationship in the banks listed
on the Tehran Stock Exchange
1
Ayub Ghasemian and 2Seyed Alireza Moosavi*
1
MA Student, Department of Management, Firoozabad Branch, Islamic Azad University, Firoozabad, Iran.
2
. Phd in Financial Management, Member of scientific board, Department of Management, Firoozabad Branch,
Islamic Azad University, Firoozabad, Iran *Corresponding Author Email: [email protected]
ABSTRACT
This paper is trying to investigate how monetary policy affects the banks’ loan portfolios and answer the question of whether special bank’s features influence the lending response to a monetary policy. To this end, we use Iran’s bank loan aggregated series and bank’s size and capital structure data. We use the growth rate of M2 as the indicators of Irans' monetary policy. Using Vector error correction model (VECM) and quarterly data for the period 2007:Q1 to 2014:Q4, the main hypothesis be examined. The result show that there is a bidirectional causal relationship between the M2 (as monetary policy index) and lending behavior of banks listed on the Tehran Stock Exchange. It was also observed that the banks' capital structure as one of the banks specific feature variables have a negative impact on bank lending behavior in accepted banks in Tehran Stock Exchange.
Keywords: Monetary policy, VECM models, bank lending behavior, money transmission mechanism, liquidity money JEL Classification: E40, E52, G21
1- INTRODUCTION
The importance of financial intermediation role of banks is not only because of resources transfer between depositors and investors. Banks are at the heart of Money multiplier. The most important function of the bank, which gives it a unique role, is facilitating the information problems that exist between lenders and investors. Banks because of specialization and large-scale activity can be more highly effective than individual in customers control activities, Acquisition credit information and Credit Measurement. Due to the special role of banks in modern economies, the nature of the monetary transmission mechanism in any
economy would be incomplete without
considering the role of banks. Financial crisis in 2008 in the US and Europe showed how a bank failure could bringing the world into a deep recession. Different Special features of banks
caused the financial crisis impacts be different in various countries.
According to Bernanke and Gertler (1995), the credit channel is not an independent or parallel channel compared with the traditional one, but rather a set of factors that amplify and propagate the conventional interest rate effect. However, identifying empirically the monetary policy transmission mechanism in an economy is not an easy task. According to Gertler and Gilchrist (1993a), it is surprisingly difficult to find convincing time series evidence of the basic prediction of macroeconomic theory that tightening of monetary policy should reduce bank lending. Since the outbreak of the financial crisis in 2007, a growing number of policy debates have focused on how to recover banks’ lending activities. In particular, governments in
developed countries have conducted an
capital injection into the banks. These policy initiatives were primarily aimed at restoring the functioning of the financial system and recovering banks’ lending activities, thereby mitigating the adverse feedback loop of the crisis.
The empirical properties of the monetary transmission mechanism are often characterized using impulse response functions of an estimated vector autoregressive system (VAR). This paper is trying to investigate how monetary policy affects the banks’ loan portfolios and answer the question of whether special bank’s features influence the lending response to a monetary policy. To this end, we use Iran’s bank loan aggregated series and bank’s size and capital structure data. The remainder of the paper is organized as follows: Section 2 reviews literature. Section 3 describes our empirical methodology, and Section 4 explains data. Section 5 reports empirical results, and Section 6 concludes.
2- literature reviews
In Iran, there have been several independent pieces of empirical evidence of the Importance of loan supply effects. Taghavi and Lotfi (2005) in their research showed that the required reserve ratio negatively affect growth rate of bank deposits and credit facilities. They confirmed the existence of monetary policy transmission in Iran, but due to the poor performance of credit channel of monetary policy and it can be said, is actually inefficient. Heidari et al (2012) examined the effect of macroeconomic shocks on delayed loans in the period from 2000 to 2008. Using ARDL and VAR model, they showed that the impact of economic shocks that arise from monetary and fiscal policy, such as inflation, growth of non-oil GDP, liquidity, loan interest rates have the highest influence on the banking system's delayed loans.
Using the VAR model and data for period 1983 to 2012, Adeli Nick (2014) has examined Non-Current loan topics. The result of this study show that 67 percent of dependent variable changes (the ratio of Non-Current to total Receivables credits ratio) can be explained by
its past value. Oil revenue volatility index, non-oil GDP volatility index, government budget deficit are other explanatory variables.
Several studies have already revealed that economic responses to monetary policy differ across banks’ sizes and capital structure. For example, Gertler and Gilchrist (1994) analyze economic responses such as sales and bank loans to a monetary policy shock for small and large manufacturing firms. They find that small firms account for a disproportionate share of the manufacturing decline in response to monetary policy tightening. Den Haan and Yamashiro (2007, 2009) analyze the responses of disaggregated bank loans for different types of borrowers to a monetary policy shock in U.S. and Canadian economies. They report that monetary tightening decreases real estate and consumer loans, while it increases commercial and industrial loans. Mora and Logan (2010) show that, based on the U.K. data, the negative bank capital shock leads to a decrease in bank loans to non-financial firms and an increase in bank loans to households. Hirakata, Sudo, and Ueda (2009) incorporate credit constraints of both banks and non-financial firms into an otherwise standard DSGE model and discuss the role of bank capital shocks in explaining U.S. business cycles. In this study we are trying to investigate how monetary policy affects the banks’ loan portfolios and answer the question of whether special bank’s features influence the lending response to a monetary policy. To this end, we use Iran’s bank loan aggregated series and bank’s size and capital structure data. We use the growth rate of M2 as the indicators of Iran’s' monetary policy
3. Empirical Methodology
3.1 Vector auto regression models
In this study, we examines the impact of specific features of banks and monetary policy index (M2) on bank lending behavior using VAR models.Vector auto regression (VAR) was introduced by Sims (1980) as a technique that
could be used by macroeconomists to
underlying structural parameters. It has become a prevalent method of time-series modeling .A VAR system contains a set of m variables, each
of which is expressed as a linear function of p
lags of itself and of all of the other m – 1
variables, plus an error term. With two variables, x and y, an order-p VAR would be the
two equations:
We adopt the subscript convention that βxyp represents the coefficient of y in the equation for x at lag p.
If we were to add another variable z to the system, there would be a third equation for zt and terms
involving p lagged values of z, for example, βxzp, would be added to the right-hand side of each of the
three equations.
3.2 Vector Error-Correction Model
When the variables of a VAR are cointegrated, we use a vector error-correction model (VECM). A VECM for two variables might look like
Where is the long-run
cointegrating relationship between the two variables and λy and λx are the error-correction
parameters that measure how y and x react to deviations from long-run equilibrium. When we
apply the VEC model to more than two variables, we must consider the possibility that more than one cointegrating relationship exists among the variables.
3.3 Granger causality
One of the first, and undeniable, maxims that every econometrician or statistician is taught is that “correlation does not imply causality.” Correlation or covariance is a symmetric, bivariate relationship, cov(x,y)=cov(y,x). We cannot, in general, infer anything about the existence or direction of causality between x and y by observing non-zero covariance. Even if our statistical analysis is successful in establishing that the covariance is highly unlikely to have occurred by chance, such a relationship could occur because x causes y, because y causes x, because each causes the other, or because x and y are responding to some third variable without any causal relationship between them. However, Clive Granger defined the concept of Granger causality, which, under some controversial assumptions, can be used to shed light on the direction of possible causality between pairs of variables. The formal definition of Granger causality asks whether past val-ues of x aid in the prediction of yt, conditional on having already accounted for the effects on yt of past
values of y (and perhaps of past values of other variables). If they do, the x is said to “Granger cause” y. The VAR is a natural framework for examining Granger causality. In this study, we construct a VAR model comprising four variables including total banks’ loan growth, M2 growth, size and capital structure of bank system in Iran. Lags are selected by the AIC.
4. Data
5. Empirical results
5.1. Unit roots and cointegration tests
To test if the variables are stable and to explore the possibility of the existence of cointegration equations, we conduct Augmented Dickey– Fuller and cointegration tests.
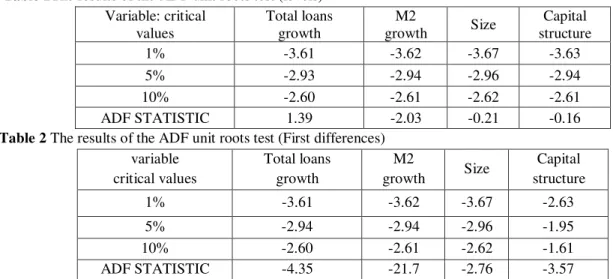
Table 1 and 2 show unit root test result for level and first difference of the variables. The null
hypothesis of a unit root cannot be rejected for any of the level variables, while the test statistics for the first differences are all significantly smaller than zero. This indicates that all variables can be treated as integrated of order one.
Table 1The results of the ADF unit roots test (levels)
Capital structure Size M2 growth Total loans growth Variable: critical values -3.63 -3.67 -3.62 -3.61 1% -2.94 -2.96 -2.94 -2.93 5% -2.61 -2.62 -2.61 -2.60 10% -0.16 -0.21 -2.03 1.39 ADF STATISTIC
Table 2 The results of the ADF unit roots test (First differences)
Capital structure Size M2 growth Total loans growth variable critical values -2.63 -3.67 -3.62 -3.61 1% -1.95 -2.96 -2.94 -2.94 5% -1.61 -2.62 -2.61 -2.60 10% -3.57 -2.76 -21.7 -4.35 ADF STATISTIC
Combining the results of unit roots tests from Tables 1 and 2, we can confirm that all the variables are found to be integrated with I(1); therefore, there may exist some cointegration between the employed variables. Thus, we conduct cointegration tests using Johansen's technique. We present the results of cointegration tests in the Tables3.The results indicate that between these variables during the period 1386-1393 there are at least two cointegration relationship at 5% level. The results of the cointegration tests reflect that the variables have long-run relationships.
Table 3 Result of cointegration test
Prob 0.05 Critical Value Eigenvalue Trace Statistic Hypothesized No. of CE(s) 0.0000 47.8 0.85 117.2 None 0.0001 29.7 0.54 48.3
At most 1
0.0100 15.4
0.36 19.9
At most 2
0.0544 3.84
0.097 3.701
At most 3
5.2 Vecm model estimation
The test for cointegrating relationships in a VAR system is sensitive to the lag length of the variables in the system. In choosing the lag
length one must weigh two opposing
considerations: the course of dimensionality and the correct specification of the model (Canova, 1995). The optimal lag length in this study is based on Schwarz (SC) and Akaike (AIC) criteria, together with misspecification tests for
the error terms. Both the SC and AIC criteria suggest the inclusion of two lag.By imposing restrictions on the cointegrating coefficients, the cointegrating vectors can be identified and the VEC Models can be achieved. Long-run relationship equation is:
Lag(Total loans)=1.28+1.73*lag(M2)-3.68*(size)-3.12*lag(capital structure) (3.46) (-5.48) (-7.2)
Table Capital Structure Size M2
Total Loans Growth
VECM Parameters Estimation
The results of VECM model estimation (Table 4) shows that the relationship between monetary policy and bank lending behavior is positive in the long-term and short-term (first and second lags). One of the internal banking variables (capital structure) shows a negative relationship with the growth of bank loans. This result can be interpreted in this way that the growth of liquidity in the country cause increasing the deposits absorption and subsequently increase lending in the banking system. On the other hand, increasing leverage, banks reduce loans for avoiding liquidity risk.
5.3 causality relationship
In the last, we conduct granger causality test to investigate the relationship between monetary policies and banks’ lending behavior. Table 5 show the result of this test. As it can be observed there is a bidirectional causality between M2 growth and total loans growth. This causality relationship confirm the money transmission mechanism in Iran.
Table 5 Granger causality test result
P-value F- value
Null hypothesis
Df
0.0009 13.9***
TLG ≠» M2G 2
0.0135 8.60 **
M2G≠» TLG 2
* significant at 10%, ** significant at 5% , *** significant at 1%
5. CONCLUSION
This study, using bank aggregate loans, M2, size and capital structure time series data, investigates the lending behavior of banks according to monetary policy and money situation. In this regard, a vector error correction model (VECM) be estimated and long and short run relationship between variables be examined. First of all, ADF unit root be conducted. The results show that the null hypothesis of a unit root cannot be rejected for any of the level variables, while the test statistics for the first differences are all significantly smaller than zero. This indicates that all variables can be treated as integrated of order one. Then we conduct cointegration tests using Johansen's technique. The results indicate that between these variables during the period 2007-2014 there are at least two cointegration relationship at 5% level. The results of the cointegration tests reflect that the variables have long-run relationships. After that we estimated the VECM model. The results show that the relationship between monetary policy and bank lending behavior is positive in the long-run and short-run (first and second lags). And one of the internal banking variables (capital structure) shows a negative relationship with the growth of bank loans. In the last, we conduct granger causality test to investigate the relationship
between monetary policies and banks’ lending behavior. The results of this test show that there is a bidirectional causality between M2 growth and total loans growth. This causality relationship confirm the money transmission mechanism in Iran.
The major conclusions of this study can be presented as follows. First, there is a positive relationship between monetary policy and banks’ loans growth in both long run and short run in Iran. This result can be interpreted in this way that the growth of liquidity in the country cause increasing the deposits absorption and subsequently increase lending in the banking system.Second, one of the internal banking variables (capital structure) shows a negative relationship with the growth of bank loans. This result can be interpreted in this way that increasing leverage, banks reduce loans for avoiding liquidity risk.Another interesting finding is that there is a bidirectional causality between M2 growth and total loans growth. This causality relationship confirm the money transmission mechanism in Iran.
tightening that hold less cash. The central bank can play its role as last lender to avoid reducing these banks’ lending, and provides liquidity the bank's requirements while monetary tightening. In conclusion, our work investigate the impact of monetary policy on banks’ lending behavior in Iran and in this regard we use M2 growth as monetary policy indicator. In can be suggested that in future study other monetary policy indicators be used.
REFERENCES
1. Bayoumi T, Morsink J (2001) A peek inside the black box: the monetary transmission mechanism in Japan. IMF Staff Pap 48(1):22–57
2. BEŅKOVSKIS, K. (2008), Is there a bank lending channel of monetary policy in Latvia? Evidence from bank level data, Latvijas Ban,. 1-45.
3. Bernanke B (1993) Credit in the
macroeconomy. FRBNY Q Rev Spring:50– 70
4. Bernanke B, Blinder A (1988) Credit, money, and aggregate demand. Am Econ Rev 78:435–439
5. Bernanke, B. S. and A. S. Blinder (1992),”The Federal Funds Rate and the
Channels of Monetary Transmission”,
American Economic Review, 82(4), 901-921.
6. Bernanke, B. S. and M. Gertler (1995),” Inside the Black Box: the Credit Channel of Monetary Policy Transmission”, Journal of Economic Perspectives, 9(4), 27-48.
7. Bernanke, B. S., & Blinder, A. S. (1992). The Federal funds rate and the channels of monetary transmission. America Economic Review, 82(4), 901−921.
8. Bichsel, R and Perrez, J. (2005), In Quest of the Bank Lending Channel: Evidence for Switzerland Using Individual Bank Data,
Schweizerische Zeitschrift fur
Volkswirtschaft .
9. Castro, V. (2013). Macroeconomic
determinants of the credit risk in the banking system: The case of the GIPSI. Economic Modelling, 31, 672-683.
10.Chaibi, H., & Ftiti, Z. (2014). Credit risk determinants: Evidence from a cross-country study. Research in International Business and Finance, 33, 1-16.
11.Christiano, Lawrence J., Matin Eichenbaum and Charles L. Evans (1998), Modelling Money, NBER Working Paper 6371.
12.Christiano, Lawrence J., Matin Eichenbaum and Charles L. Evans (1998), Monetary Policy Shocks: What have we learned and to what end?, NBER Working Paper No. 6400. 13.Cochrane, John H. (1995,2005).Time Series
for Macroeconomics and Finance, Book Manuscript, University of Chicago.
14.Fofack, H.L. (2005) ‘Nonperforming Loans in Sub-Saharan Africa: Causal Analysis and Macroeconomic Implications’, World Bank Policy Research Working Paper.
15.Ford, JimL., Agung, J., Ahmed, S. S., & Santoso, B. (2003). Bank behavior and the channel ofmonetary policy in Japan, 1965– 1999. Japanese Economic Review, 54(3), 275.
16.Gambacorta, L and Emilio Mistrulli, P. (2004),”Does bank capital affect lending
behavior?”,Journal of Financial
Intermediation, 13, 436- 457.
17.Gambacorta, L. (2005),” Inside the banklending channel”, European Economic Review, 49, 1737-1759.
18.Gambera, M. (2000). Simple Forecasts of Bank Loan in the Business Cycle. Emerging Issues Series, 3, 1 – 27.
19.Gavin, M. & Haussmann, R. (1996). The
Roots of Banking Crises: The
Macroeconomic Context. Inter-American Bank, Working Paper, 318, 1– 20.
20.Hamilton, James D. (1994). Time series analysis : Princeton University Press.
21.Ivanov, Ventzisla, & Kilian, Lutz (2005). A practitioner's guide to lag order selection for VAR impulse response analysis. Studies in Nonlinear Dynamics and Econometrics, 9(1). 22.Khemraj, Tarron and Sukrishnalall Pasha.
Conference on Banking and Finance. St.Augustine. Trinidad.
23.Khemraj, T. and Pasha, S.R. (2009) ‘The Determinants of Non-Performing Loans: An Econometric Case Study of Guyana‘, 3rd Biennial International Conference on Business, Banking & Finance, The University of the West Indies ST Augustine Campus, Trinidad and Tobago, May 27 to 29, 2009.
24.Louzis, D. P., Vouldis, A. T., & Metaxas, V. L. (2012). Macroeconomic and bank-specific determinants of non-performing loans in Greece: A comparative study of mortgage, business and consumer loan portfolios. Journal of Banking & Finance, 36(4), 1012-1027 .
25.Louzis, D. P., Vouldis, A. T., & Metaxas, V. L. (2012). Macroeconomic and bank-specific determinants of non-performing loans in Greece: A comparative study of mortgage, business and consumer loan portfolios. Journal of Banking & Finance, 36(4), 1012-1027 .
26.Makri, V., & Papadatos, K. (2014). How accounting information and macroeconomic environment determine credit risk? Evidence from Greece. International Journal of Economic Sciences and Applied Research, 1,129-143.
27.Makri, V., & Papadatos, K. (2014). How accounting information and macroeconomic environment determine credit risk? Evidence from Greece. International Journal of Economic Sciences and Applied Research, 1,129-143.
28.Nick Adeli, H. (2014), the impact of fluctuations in macroeconomic variables on Non-Current Receivables banking sector; econometric approach (Working Paper No. 9226) .Tehran: Center for Monetary and Banking.
29.Nkusu, M. (2011). Nonperforming loans and macro financial vulnerabilities in advanced economies (Working Paper No. 11/161). International Monetary Fund.
30.Nkusu, M. (2011). Nonperforming loans and macro financial vulnerabilities in advanced
economies (Working Paper No. 11/161). International Monetary Fund.
31.The Central Bank of the Islamic Republic of Iran, the economic time series database 32.Zabeen, A.S. (2006) ‘An investigation of the
relationship between Non-performing Loans,
Macroeconomic Factors and Financial
Factors in Context of Private commercial
Banks in Bangladesh’, Independent