A Work Project, presented as part of the requirements for the Award of a Masters
Degree in Finance from the NOVA School of Business and Economics.
Bank Capital and Stock Performance
around the Subprime Lending Crisis
Work Project
JORGE DIOGO BARREIROS GONÇALVES #375
A Project carried out on the Masters in Finance, under the supervision
of Prof. Miguel Ferreira
BANK CAPITAL AND BANK STOCK PERFORMANCE AROUND
FINANCIAL SUBPRIME CRISIS
ABSTRACT
This empirical study observes the relationship between bank capital and stock
performance when an unexpected negative shock materializes to bank value. The
analysis covers the three months after the collapse of Lehman Brothers on the 15th September 2008, using the holding period stock return as the dependent variable. With
data from the US largest commercial banking and saving and loans institutions, we
constructed a multiple regression model and performed several estimations using
different definitions of bank capital. Our conclusions are consistent with the premise
that better capitalized banks are in a better position to withstand the negative impacts of
a disruptive financial event, such as the Lehman collapse, and therefore are susceptible
to smaller stock price declines. We also find evidence that simpler and more
conservative capital ratios are perceived by equity market participants as more accurate
measures of bank health relative to regulatory risk based ratios. Therefore, our results
provide support to the inclusion of simpler capital ratios that rely on balance sheet
information to bank regulatory frameworks.
INTRODUCTION
Extensive literature addressing the implications of capital requirements in banks’
risk-taking incentives and performance usually perceives capital requirements as an
effective tool to restrain moral hazard created by deposit insurance1, due to the complexity of computing a risk-weighted insurance premium (Chan, Greenbaum and
Thakor, 1992). The premise is that forcing banks to fund their assets with a larger equity
stake should restrain their incentives for excessive risk-taking (see for instance Keeley
and Furlong, 1989; Furlong and Keeley, 1990)2 and reduce their vulnerability to market disruptions by increasing their capacity to absorb unexpected losses with their own
resources. In the context of the huge losses incurred by banks during the US subprime
lending crisis, our paper tries to make a contribution in understanding this relation. We
search for evidence that better capitalized banks are in a superior position to withstand
unanticipated blows to bank value that materialize during a financial crisis, such as the
subprime lending crisis, by observing the relationship between pre-crisis capital levels
and the stock performance during a crisis period.
One additional issue that we investigate is the quality of capital held by banks.
The “procyclicality” of the Basel II risk-weighted, where fluctuations are amplified by
business cycles3, means Tier 1 and Tier 2 capital may be heavily deteriorated during a crisis period and, therefore, we are interested in understanding whether equity markets
better judged simpler and more conservative ratios that focus on balance sheet
information, as common equity is the component of capital available to absorb bank
losses.
1
See Merton (1977).
2 See also Santos (1999) and Rochet (1992) 3
Our analysis focus on stock returns from the largest listed US commercial banks
and savings and loans institutions during the three months following the Lehman
Brothers Holdings Inc. collapse on the 15th September 2008. We investigate the relationship between different measures of bank capital and stock performance in the
cross section to understand whether bank capital levels prior to the shock had any
influence in banks stock performance after the shock. We control for a series of bank
specific variables that account for bank business model, sources of fund, liquidity, asset
quality, size and standard asset pricing factors.
Our baseline model is inspired by the empirical study of Kunt, Detragiache and
Merrouche (2010) in estimating the relationship between bank capital levels and stock
performance in the cross section. We investigate this relation for the full sample and for
three subsamples separated by bank size. Our measures of bank capital include
risk-weighted ratios – Basel Capital Adequacy Ratio, Tier 1 Ratio and Tier 2 Ratio – and
balance sheet ratios – Tangible Common Equity Ratio, Leverage Ratio and, as
suggested by Estrella, Park and Peristiani (2000), one bank capital measure that
accounts for both on and off-balance sheet activities. We find evidence for our full
sample to support that better capitalized banks suffered a smaller deterioration of their
stock price during the period but only balance sheet ratios were significant in explaining
stock performance. To account for the discrepancies between banks with different size,
we define total assets thresholds similar to the ones used in the empirical work of
Berger and Bowman (2009) and also conduct our analysis for three separate subsamples
according to banks’ total assets. Across the large banks subsample, our conclusions
report that banks with higher risk-weighted ratios are in a better position to absorb the
general, perceived by equity markets as a better measure of resilience and financial
health. Finally, we find no significant relationship between bank capital and stock
performance during the sample period across the mid and small banks subsample. The
rest of the paper is structured as follows: section two provides a brief literature review;
section three provides a description on the data and methodologies used; section four
discusses the empirical results; section five delivers a conclusive statement.
LITERATURE REVIEW
To formulate our hypotheses, we delve on theoretical literature related to deposit
insurance and the roles of bank capital regulation.
Deposit insurance schemes are offered by governments to insure depositors and
insulate banks from runs (Diamond and Dybvig, 1983). However, by modelling deposit
insurance as a put option on the value of the bank’s assets with an exercise price equal
to the promised maturity of its debt commitments, Merton (1977) showed that banks
seeking to maximize the value of their equity will maximize the value of the put by
either shifting to riskier investments or by increasing leverage, creating a moral hazard
issue. Due to the impossibility of determining risk-sensitive insurance premium and
thus charge banks a fair premium for their granted protection (Chan, Greenbaum and
Thakor, 1992), capital regulation is viewed as one of the most crucial tools in dealing
with moral hazard. Furlong and Keeley (1989) and Keeley and Furlong (1990) showed
that publicly listed banks seeking to maximize their equity value will reduce the risk
profile of their investments as a result of higher bank capital requirements because
lower leverage levels are associated with a lower marginal value of the deposit
premium. Additionally, Santos (1999) addressed the principal-agent problem between
banks and borrowing firms and claimed that, due to limited liability, banks have an
incentive to change their contracts’ lending terms to induce borrowers to take on more
risk, a problem that can be solved by increasing the bankruptcy costs of a bank through
higher capital requirements. Still, these previous theories are challenged by a different
set of literature that claims there is room for a positive relationship between capital
standards and risk. Koehn and Santomero (1980) modelled banks as portfolio managers
who maximize their risk-return combination in the efficiency frontier, in which case
introducing a flat capital requirement might create a situation in which the bank
reconfigures its investments to riskier assets to offset the loss of expected return by
being forced to operate with lower leverage. Kim and Santomero (1988) showed that
this issue may be addressed by capital requirements that are risk-based. In addition,
Calem and Rob (1999) used a dynamic model to prove that the relationship between
higher capital requirements and risk taking changes with the level of bank capitalization
– low capitalized and highly capitalized banks increase risk to take advantage of deposit
insurance and low probability of insolvency, respectively, as a result of an increase in
capital requirements.
These two opposing views provide sufficient motivation for empirical research to
be conducted regarding the relationship between stock performance and bank capital.
Kunt, Detragiache and Merrouche (2010) explore whether higher bank capital levels
was associated with better stock performance during the US recent financial crisis (Q3.
2007 – Q1. 2009). The authors use a multi-country panel of banks and provide evidence
that, during the crisis, better capitalized banks experienced smaller decline in their
were more sensitive to a leverage ratio (Tier 1 to total assets) rather than to
risk-weighted ratios. Similarly, Berger and Bowman (2009) look into the relationship
between bank capital and bank performance around normal and crisis periods and found
a meaningful positive relationship between bank capital and stock performance during
crisis periods only for the credit crunch of the early nineties (Q1. 1990 – Q4. 1992) but
not for the subprime lending crisis. Still, the authors do not distinguish between
different measures of bank capital. Our research is also motivated by one last empirical
project. Estrella, Park and Peristiani (2000) explore how bank capital level faired in
predicting bank failures, covering US bank failures from 1989 to 1993. According to the
authors, a good measure of capital adequacy should be very closely related to bank
failure and, therefore, they observe and compare the informative power of different
measures of bank capital about subsequent failures. They look into banks’ Tier I to total
assets ratio (leverage ratio), Tier I risk-weighted capital ratio and Tier I to gross revenue
ratio. The authors find evidence that, over longer term horizons, the risk weighted ratio
is the most effective predictor of bank failure but, over one and two year horizons, the
three capital measures have similar predictive power concerning bank failures. In line
with their conclusions, the authors argue that, over short term horizons, the leverage
ratio and gross revenue ratio can play an important role in bank regulation as they are
simpler and virtually costless to calculate, while the regulatory burden carried in with
risk weighted capital ratios is not offset by a higher explanatory power.
METHODOLOGY – BASELINE MODEL
The methodology used to assess our main goal is a slightly altered approach of the
relation between bank capital and bank stock performance. In particular, the core of this
paper focuses solely on the three month holding period stock return of publicly listed
US banking institutions after an unexpected shock to bank value materialized, such as
the Lehman Brothers’ failure, disregarding the need to account for country and time
specific variables. Our focus is to determine whether better capitalized banks were able
to better resist the unexpected losses that materialized with the collapse of Lehman
Brothers by witnessing a smaller decline in their stock price than that of poorer
capitalized banks. We perform several estimations using the regression model below.
∑
The model is estimated through robust least squares (RLS) to account for
conditional heteroskedasticity inherent to equity prices (French, Schwert and
Stambaugh, 1987) and explanatory variables are lagged nine months to ensure that
information on each bank is incorporated in its stock price (Fama and French, 1992).
is the dependent variable and accounts for the three month holding period4 stock return of each bank comprised in our sample following the Lehman Brothers’
collapse. C stands for the pre-crisis bank capital and represents our key
explanatory variable. In addressing the impact of pre shock bank capital levels on the
after-shock stock returns, we want to understand which form of capital was more
relevant to stock performance. For that purpose, we perform separate estimations of
equation (1) for several different measures of bank capital in order to avoid collinearity
problems between our key predictors. Our first measure of bank capital is the capital
adequacy ratio as defined by the Basel II regulatory framework5. We also examine each
4 From 16/09/2008 to 16/12/2008
constituent of the latter ratio separately – Tier I ratio (composed of common and
preferred stock and disclosed reserves) and Tier II ratio (lower quality capital mostly
composed of subordinated debt) – to account for the quality of its capital instruments. In
addition, we include more conservative approaches to bank capital measured by the
tangible common equity (TCE) ratio, which is obtained by dividing each bank’s
tangible common equity by its tangible assets6, and by the leverage ratio, obtainable by dividing tier 1 capital by total assets. Our goal is to understand whether equity markets
incorporate in their expectations the “procyclicality” of risk-weighted ratios (Ki Young
Park, 2012) and perceive better quality capital as a more accurate measure of bank
health and resilience, as tier 1 capital and, in particular, common equity, are the
components of capital available for banks to absorb unexpected losses. Finally, we
include a proxy for the gross revenue ratio used by Estrella, Park and Peristiani (2000)
in predicting bank failures, which we will from now on refer to as E Ratio. The authors
obtain their ratio by dividing Tier 1 by gross revenue. Our departure from the literature
consists on dividing Tier I capital by total balance and off balance sheet assets instead.
We want to account for the increasing tendency of banks engagement in off-balance
sheet activities as part of the financial innovation and securitization hype and so,
consistent with the authors view, we consider this ratio to be a better risk assessment of
a bank’s uses of funds. In line with this view, we want to observe how equity market
participants perceive this capital measure.
To isolate the explanatory power of bank capital in our cross sectional analysis we
include in our model a set of bank specific explanatory variables. The variable
in equation (1) stands for such bank specific variables that account for bank
6 Tangible common equity was obtained by subtracting intangible assets and preferred equity from
business model, sources of funding, asset quality, liquidity, size, profitability, value and
correlation with the market. A more detailed section explaining these variables is
provided further on this section. We test for the following hypotheses.
Hypothesis 1: Controlling for bank specific variables, it is expected that the stock
price of better capitalized banks does not fall as much as that of poorly capitalized
banks.
Hypothesis 2: Controlling for bank specific variables, it is expected that simpler
and more conservative capital ratios that rely on balance sheet information have a
higher positive impact on stock performance than regulatory risk-weighted capital
ratios.
Over the course of our regressions we also grouped our sample into three different
categories according to bank size measured by total assets. In doing so, our aim is to
alleviate the bank size bias as moral hazard tends to play differently amongst different
sized banks. More information regarding this approach is provided in the paragraph
below. We followed a division similar to the one performed by Berger and Bowman
(2009) and defined large banks with assets exceeding US$ 4 billion, medium banks with
assets exceeding US$ 1.5 billion and up to US$ 4 billion and small banks with assets up
to US$ 1.5 billion.
As previously mentioned, we controlled for bank specific variables that were
considered to be relevant in assessing bank stock performance during our analysis
period. Controlling for size, we accounted for each bank’s total assets7
. We relied on
some existing theory on banking that suggests banks’ diversification and size to be
positively correlated (Diamond, 1984) and that points out to the fact that larger banks
7
have historically used their diversification benefits to operate with higher leverage
levels (Liang and Rhoades, 1991) and invest in riskier assets (Demsetz and Strahan,
Journal of Money, Credit and Banking, 1997) 8. We expect that larger banks are better able to take advantage of “regulatory arbitrage” opportunities, enabling them to find
ways to hide risk and give their balance sheet the appearance of stability – for instance,
through securitizations – in which case they are more vulnerable to unexpected negative
shocks (Kunt, Detragiache and Merrouche, 2010). Controlling for banks’ business
models, we looked into banks total loans (net of unearned income) to total assets ratio.
We find this an accurate approach to capture the extent of bank exposure to credit risk
and potential liquidity shortages and thus expect a negative impact by this ratio on the
stock performance of banks. As a complement, we also look into the quality of banks’
loan portfolios by including in our model the provisions set aside by banks to cover loan
losses as a percentage of total assets. According to Thakor (1987), a change in the
provision for loan losses might be a reflection on the future health of a bank’s loan
portfolio. Also Madura and Zarruk (1992) observed that an increase in banks’
provisions for loan losses related to bad real estate loans is translated in negative stock
performance. Hence, we expect a negative relationship between bank stock performance
and this variable. Controlling for banks’ sources of funds, we assessed their reliance on
deposit funding, by dividing each bank’s total deposits by total assets. Due to the
disruption in the wholesale funding market during the crisis, we consider that banks
funded with a higher portion of deposits were perceived to be in a more stable position,
which would be reflected by a better stock performance. In addition, we controlled for
liquidity by including a ratio that divided total cash due from banks by total assets. Cash
8
due from banks includes cash on hand, cash items in the process of collection and
non-interest deposits with banks. A higher ratio suggests that a bank is in a better position to
manage unexpected cash needs and so we expect a positive relationship with stock
performance. Finally, we included in our set of control variables the price to book ratio,
return on equity and correlation with the market, in order to account for the factors used
in standard asset pricing models (Fama and French, 1992, The Journal of Finance).
DATA
In order to construct explanatory variables at the individual bank level for our
baseline model, we combine accounting data from COMPUSTAT with data from
Bloomberg. Our sample includes all US listed commercial banks and savings and loans
institutions (federally and non-federally chartered), with Standard Industrial
Classification (SIC) 6020, 6035 and 6036, respectively. The following bank capital
variables and control variables, with their respective COMPUSTAT codes, are obtained
for December 2007: total assets (AT), risk adjusted tier 1 capital ratio (CAPR1), risk
adjusted tier 2 capital ratio (CAPR2), risk adjusted capital ratio (CAPR3), cash and due
from banks (CDBT), common equity (CEQ), tangible common equity (CEQT), total
deposits (DPTC), goodwill (GDWL), intangible assets (INTAN), total investment
securities (IST), loans net of unearned income (LG), non-redeemable preferred stock
(PSTKN) and preferred stock liquidation value (PSTKL).
We use Bloomberg to obtain stock prices for the banks in our sample and to fill in
missing balance sheet information unavailable in COMPUSTAT, namely price-to-book
ratios (PX_TO_BOOK_RATIO), return on common equity (RETURN_COM_EQY)
prices for the 16th of September 2008 and for the 16th of December 2008 and compute the holding period return. Our sample is comprised of 320 US listed commercial banks
and savings and loans institutions, separated into 98 large banks, 104 medium banks and
118 small banks.
Summary Statistics
Table A provides a descriptive analysis for the sample period of the variables
included in our baseline model. Regarding bank capital levels, the median for the full
sample capital adequacy ratio is 11.65%, which is in compliance with the minimum
capital requirement of 10% recommended by the Basell II guidelines. The ratio remains
relatively stable when we divide the full sample according to bank size. For the full
sample Tier I and Tier II capital ratios, their respective medians stand at 10.00% and
1.26%. The subsample of larger banks seems to rely less on Tier I capital (9.32%) and
more on lower quality instruments of capital (Tier II of 2.43%) relative to the mid (Tier
I – 9.96%; Tier II – 1.25%) and small subsamples (Tier I – 10.44%; Tier II – 1.20%).
The full sample median for the TCE ratio is 7.03% and the leverage ratio is
9.20%. Larger banks have a slightly higher median for the leverage ratio (9.53%) and
lower median for the TCE ratio (6.14%). Finally, the full sample median for the E ratio
is 7.92% and is somewhat similar across all subsamples (7.87%, 7.92% and 8.00% for
the large, mid and small subsamples, respectively). In conclusion, there is some
evidence to support that larger banks operate with higher leverage levels9 and lower quality of capital. Their median holding period return holding period stock return (HPR)
is approximately minus 24.57%, while the median for the mid and small subsample is
9
minus 20.69% and minus 23.39%. For the full sample, the median holding period stock
return is -23.29%.
In terms of our bank specific control variables, we observe that small banks are
less exposed to market fluctuations, as measured by their market beta (0.51), which
might suggest that small banks were less exposed to economy-wide systemic risk and
better buffered to navigate through the financial crisis. Regarding banks’ sources of
funds, banks within the large group tend to rely less on deposit funding (0.68) than
banks within the mid and small group. In terms of banks’ business models, we observe
that banks within the large group have a lower proportion of loans on their overall asset
base. Finally, we also observe that banks within the large group set aside larger
provisions for loan losses as a percentage of total assets, which might indicate that
larger banks engaged in riskier activities in the past.
BASELINE MODEL RESULTS
The model uses bank capital, balance sheet information and standard asset pricing
factors as explanatory variables, lagged nine months from the dependent variable, to
predict the stock performance of listed US retail banking institutions for the three
months following the Lehman Brothers’ collapse on the 15th
September 2008. We
present estimation results across tables B.
Our results regarding the relationship between bank capital and stock performance
are consistent with the empirical conclusions of Kunt, Merrouche and Detragiache
(2010) and confirm our first hypothesis that higher capitalized banks suffer lower
declines on their stock price after an unexpected disruptive event takes place. In
(2000) in the sense that the regulatory burden of risk weighted capital ratios does not
translate into higher power in explaining bank performance over short term horizons.
For the full sample, the risk weighted capital ratios, as defined by Basel regulatory
framework, are positive but not significant, even after splitting capital into Tier 1 and
Tier 2. The latter result changes for the subset comprising large banks. The capital
adequacy ratio is positive and significant at the 5% level, rewarding stock performance
during the crisis period with a stock return increase of 133 basis points per each
additional percentage point increase in the pre-crisis ratio. Splitting between Tier I and
Tier II, the ratios remain (marginally) significant but with opposing signs. This confirms
that when assessing the capital adequacy ratio, investors are more focused on higher
quality capital instruments, which is reflected by the Tier 1 positive coefficient (1.7).
On the contrary, increasing the proportion of pre-crisis Tier 2 capital by one percentage
point is expected to deteriorate stock performance during the crisis period by
approximately 215 basis points. One possible explanation for such preference is that,
since Tier II capital is mostly comprised of subordinated debt instruments, it is easier to
cut dividends than to default on interest payments when additional cash is needed,
providing equity instruments a higher mobility to deal with unexpected market
fluctuations. The Basel capital ratios are not significant in the subsets comprising mid
and small size banks.
Turning to the leverage ratio, our estimation for the full sample dictates that an
increase in its pre-crisis level by one percentage point is translated into an increased
stock return during a crisis period by 124 basis points. This result is significant for a
99% confidence level. On our subset of large banks, the leverage ratio remains
estimated to increase by 186 basis points per each percentage point increase in the ratio.
The leverage ratio is not significant in the subsets comprising mid and small size banks.
Regarding the tangible common equity ratio, our result for the full sample
estimates stock return to increase roughly by 70 basis points during a crisis period with
each additional percentage point increase in this pre-crisis ratio. This result is only
marginally significant. Still, for the subset of large banks, the magnitude of the
coefficient associated to the TCE ratio is higher (1,347) and significant at the 5% level.
Finally, regarding the E ratio, we find that it had the highest, significant impact on stock
performance during the crisis (1.345) for the full sample. This suggests that equity
markets also placed high value on information regarding off-balance sheet activities,
particularly because during the years that preceded the bust financial firms oversaw the
securitization of real estate mortgages along with many types of consumers loans into
asset backed securities, many of which were “bad loans”. This ratio remains significant
at 5% for the subset comprising the large banks and is still a strong predictor of stock
performance during the crisis (1.347). Both the leverage ratio and the gross revenue
ratio are not significant across the mid and small subsets of banks. 10
Turning to bank controls, our results seem consistent with our initial expectations.
Our full sample results show that banks with a higher proportion of their funds invested
in loans were worse perceived by equity markets, which is a clear reflection of the
increasing exposure of banks’ loan portfolios to subprime borrowers over the years that
preceded the financial crisis. In this sense, the Lehman Brothers’ collapse was an
important catalyst of the crisis as it enhanced the lack of confidence in banks’ portfolios
and enhanced the problem of asymmetry of information between banks and
10 Kunt, Detragiache and Merrouche (2010) provide an explanation based on the Caleb-Rob model for
investors/borrowers. Interestingly, these results hold but are only significant for the
subsets of mid and small size banks, which might reflect the bailout expectations held
by investors for large banks but not so much for mid and small ones. We also find
evidence regarding this issue by observing that, for the full sample, banks with higher
provisions set aside as allowances for “bad loans” suffered a higher negative impact on
their stock price during the months following the Lehman Brothers’ collapse. Again,
this result holds but is significant only for the mid and small subsets of banks. Our
discussion regarding banks’ business model and asset quality is consistent with Cavallo
and Majnoni (2002), who found that banks with higher loan to asset ratios are usually
more exposed to credit risk and thus their provisions for loan losses are higher.
Bank size was also captured by equity markets as an important sign of financial
health. Our full sample estimation suggests that investors perceived larger banks to be
more prone to the subprime and securitization machine and, therefore, much more
exposed to credit risk. As securitization became commonplace during the years that
preceded the crisis, banks shifted to aggressive growth policies that involved credit
expansion at the expense of pervasive managerial practices, which might provide an
explanation to the negative coefficient associated with the size control variable.
In terms of liquidity, our cash position indicator seems to be quite a significant
predictor of bank performance but only for the mid and small subsets, with its
predicting power much stronger in the mid group.
Finally, the only variable viewed positively by investors relates to bank
profitability, with bank return on equity having a positive and significant coefficient
sign for the full sample. This result is significant at 1% level and only holds significant
The coefficients of the control variables previously discussed have minimal
variations across each regression for different measures of bank capital and their
significance remains unchanged. All of the remaining lagged control variables were not
significant in explaining bank stock performance during the crisis period.
CONCLUSION
Our empirical analysis provides some insight to the relationship between bank
capital requirements and equity value. We investigate the 320 largest US listed retail
banking institutions and study the impact of bank capital on each bank’s stock
performance during the three months that followed the Lehman Brothers’ collapse. The
goals of our study are to understand whether higher bank capital provided banks with a
superior capacity to withstand the unexpected shock that materialized to bank value and,
if so, whether better quality capital instruments were better perceived by equity markets.
Our results are strongly consistent with the empirical study of Kunt, Detragiache
and Merrouche (2010) and support the hypothesis that better capitalized banks are in a
superior position to withstand the negative shocks that materialize to bank value during
financial crisis. We find that risk-weighted capital ratios were only significant predictors
of stock performance for large banks but did not outperform cruder bank capital
measures, as stock returns were more sensitive to the TCE ratio, the leverage ratio and
the E ratio. We find that capital ratios do not help explaining stock returns for the small
and mid-size sample of banks.
In terms of policy implications, our results support the argument put forth by
Estrella, Park and Peristiani (2000) that risk-weighted capital ratios do not outperform
horizons. We also provide evidence related to how negatively equity markets perceived
low quality capital (Tier 2) as defined by the Basel framework, which suggests the need
for the revision of the type of instruments eligible for regulatory capital to include
simpler ratios that are easier to implement and to increase the quality of capital that is
used to absorb unexpected losses. This paper provides some motivation for future
research regarding this theme, for instance, by applying a similar empirical analysis on
banks that operate within different regions of the world to infer whether the Basel
framework works similarly across the globe.
REFERENCES
1. Berger, Allen N., and Christa H.S. Bouwman, 2009. “Bank Capital Performance
and Survival around Financial Crisis”. Unpublished manuscript.
2. Berger, Allen N., Richard J. Herring and Giorgio P. Szego. 1995. “The Role of
Capital in Financial Institutions”. Journal of Banking and Finance 19: 393 – 430.
3. Calem, P. and R. Rob. 1999. “The impact of Capital – Based regulation on Bank
Risk –Taking”. Journal of Financial Intermediation 8: 317 – 352.
4. Chan, Y. S., S. I, Greenbaum, and A.V. Thakor. 1992. “Is Fairly Priced Deposit
Insurance Possible?” Journal of Finance 47: 227 – 245.
5. Cooper, Michael J. and William E. Jackson III. 2003. “Evidence of
Predictability in the Cross-section of Bank Stock Returns”. Journal of Banking
and Finance 27: 817 – 850.
6. Demirguc-Kunt, Asli, Detragiache, Enrica and Merrouche, Ouarda. 2010. “Bank
7. Diamond, D. W. and P. H. Dybvig. 1983. “Bank Runs, Deposit Insurance and
Liquidity”. Journal of Political Economy 91: 401 – 419.
8. Diamond, D.W. and R.G. Rajan. 2000. “A Theory of Bank Capital.”
9. Diamond, Douglas W. and Raghuram G. Rajan. “A Theory of Bank Capital”.
Journal of Finance 55: 2431 – 2465.
10.Estrella, A. Park and Peristiani. 2000. “Capital Ratios as Predictors of Bank
Failure”. Federal Reserve Bank of New York.
11.Fama, Eugene F. and Kenneth R. French, 1992. “The Cross-Section of Expected
Stock Returns”. Journal of Finance 47(2): 427-465.
12.Furlong, F.T. and M.C. Keeley. 1989. “Capital Regulation and Bank Risk –
Taking: A Note”. Journal of Banking and Finance 13: 883 – 891.
13.Keeley, M.C. and F.T. Furlong. 1990. “A Re-examination of the Mean-Variance
Analysis of Bank Capital Regulation”. Journal of Banking and Finance 14: 69 –
84.
14.Kim, D. and A.M. Santomero. 1988. “Risk in Banking and Capital Regulation”.
Journal of Finance 43: 1219 – 1233.
15.Koehn, M. and Anthony Santomero. 1980. “Regulation of Bank Capital and
Portfolio Risk”. Journal of Finance 35: 1235 – 1244.
16.Merton, R.C. 1977. “An Analytic Derivation of the Cost of Deposit Insurance
and Loan Guarantees”. Journal of Banking and Finance 1: 512 – 520.
17.Rochet, J.C. 1992. “Capital Requirements and the Behaviour of Commercial
18.Santos, J. A. C 2001. “Bank Capital Regulation in Contemporary Banking
Theory: A Review of the Literature”. Financial Markets, Institutions and
Instruments 10: 41-84.
19.Santos, J. A.C. 1999. “Bank Capital and Equity Investment Regulations”.
Journal of Banking and Finance 23: 1095 – 1120.
APPENDIX
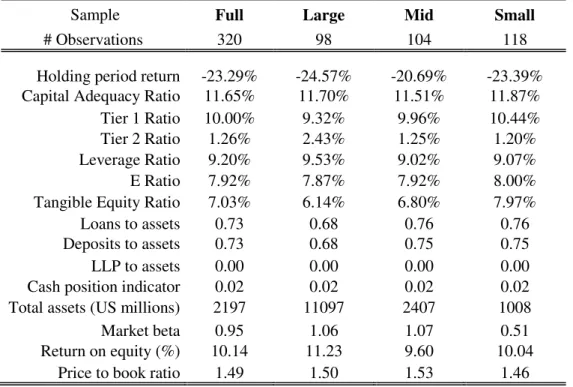
Table A: Descriptive Statistics
Table A provides a statistical description of the variables used in the regression analysis. Information regarding capital ratios and balance sheet variables is obtained from the COMPUSTAT database for December 2007, while information regarding market based variables (P/B ratio, Beta and RoE) is obtained from Bloomberg for December 2007. Information regarding stock prices is obtained from Bloomberg for the 16th September 2008 and 16th December 2008 and the holding period stock return is obtained for each bank. We use the median over the mean, as the latter is not a robust measure of the central tendency due to the existence of very outliers.
Sample Full Large Mid Small
# Observations 320 98 104 118
Holding period return -23.29% -24.57% -20.69% -23.39% Capital Adequacy Ratio 11.65% 11.70% 11.51% 11.87% Tier 1 Ratio 10.00% 9.32% 9.96% 10.44% Tier 2 Ratio 1.26% 2.43% 1.25% 1.20% Leverage Ratio 9.20% 9.53% 9.02% 9.07% E Ratio 7.92% 7.87% 7.92% 8.00% Tangible Equity Ratio 7.03% 6.14% 6.80% 7.97% Loans to assets 0.73 0.68 0.76 0.76 Deposits to assets 0.73 0.68 0.75 0.75
LLP to assets 0.00 0.00 0.00 0.00
Cash position indicator 0.02 0.02 0.02 0.02 Total assets (US millions) 2197 11097 2407 1008
Market beta 0.95 1.06 1.07 0.51
Table B: Baseline model – Regression results- Full Sample
Table B displays the baseline regression results for the entire sample. Results are obtained from robust least squares regressions. The dependent variable is the holding period return during the three months following the Lehman Brothers failure (from 16th September 2008 to the 16th December 2008). Six different estimations of the model are computed for each bank capital measure. The values in parenthesis represent the p-values. The sample is composed of 320 banks and the adjusted r-squared is presented on the bottom of the table.
FULL SAMPLE CAR Tier 1 Tier 2 Leverage TCE E Ratio
Constant 0.139 0.133 0.265 0.107 0.153 0.204 [0.4884] [0.513] [0.133] [0.538] [0.396] [0.224] Bank Capital Ratio 0.415 0.599 0.208 1.244 0.696 1.345
[0.231] [0.223] [0.693] [0.001] [0.079] [0.001] Loans to assets -0.299 -0.286 -0.331 -0.342 -0.345 -0.42
[0.011] [0.012] [0.003] [0.001] [0.001] [0.000] Deposits to assets -0.094 -0.13 -0.119 -0.086 -0.077 -0.097 [0.5347] [0.383] [0.44] [0.56] [0.607] [0.507] LLP to assets -13.054 -12.961 -13.35 -11.268 -12.793 -11.421 [0.000] [0.000] [0.000] [0.000] [0.000] [0.000] Cash to assets -0.167 -0.194 -0.126 -0.431 .0.287 -0.517 [0.737] [0.697] [0.801] [0.382] [0.563] [0.299] Log(size) -0.082 -0.075 -0.091 -0.089 -0.076 -0.095 [0.001] [0.005] [0.000] [0.000] [0.003] [0.000] Market beta 0.052 0.043 0.052 0.044 0.054 0.049
[0.1946] [0.2861] [0.197] [0.261] [0.173] [0.214] Return on equity 0.007 0.006 0.007 0.008 0.007 0.008
[0.004] [0.0063] [0.007] [0.001] [0.003] [0.001] P/B Ratio 0.034 0.038 0.036 0.046 0.029 0.043
[0.262] [0.201] [0.229] [0.121] [0.332] [0.146]
N 320 320 320 320 320 320
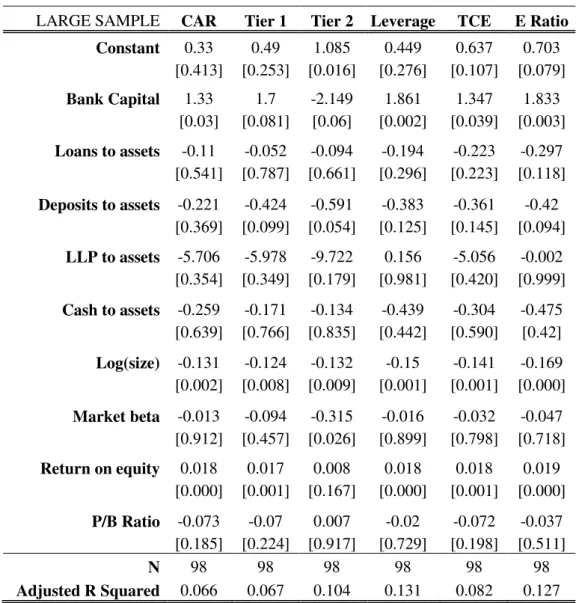
Table B1: Baseline model – Regression results- Large Sample
Table B1 exhibits the baseline regression results for the larger subsample of banks (total assets larger than US$ 4 billion). The subsample is comprised of 98 banks and the adjusted r-squared is presented in the bottom of the table.
LARGE SAMPLE CAR Tier 1 Tier 2 Leverage TCE E Ratio
Constant 0.33 0.49 1.085 0.449 0.637 0.703 [0.413] [0.253] [0.016] [0.276] [0.107] [0.079]
Bank Capital 1.33 1.7 -2.149 1.861 1.347 1.833 [0.03] [0.081] [0.06] [0.002] [0.039] [0.003]
Loans to assets -0.11 -0.052 -0.094 -0.194 -0.223 -0.297 [0.541] [0.787] [0.661] [0.296] [0.223] [0.118]
Deposits to assets -0.221 -0.424 -0.591 -0.383 -0.361 -0.42 [0.369] [0.099] [0.054] [0.125] [0.145] [0.094]
LLP to assets -5.706 -5.978 -9.722 0.156 -5.056 -0.002 [0.354] [0.349] [0.179] [0.981] [0.420] [0.999]
Cash to assets -0.259 -0.171 -0.134 -0.439 -0.304 -0.475 [0.639] [0.766] [0.835] [0.442] [0.590] [0.42]
Log(size) -0.131 -0.124 -0.132 -0.15 -0.141 -0.169 [0.002] [0.008] [0.009] [0.001] [0.001] [0.000]
Market beta -0.013 -0.094 -0.315 -0.016 -0.032 -0.047 [0.912] [0.457] [0.026] [0.899] [0.798] [0.718]
Return on equity 0.018 0.017 0.008 0.018 0.018 0.019 [0.000] [0.001] [0.167] [0.000] [0.001] [0.000]
P/B Ratio -0.073 -0.07 0.007 -0.02 -0.072 -0.037 [0.185] [0.224] [0.917] [0.729] [0.198] [0.511]
N 98 98 98 98 98 98
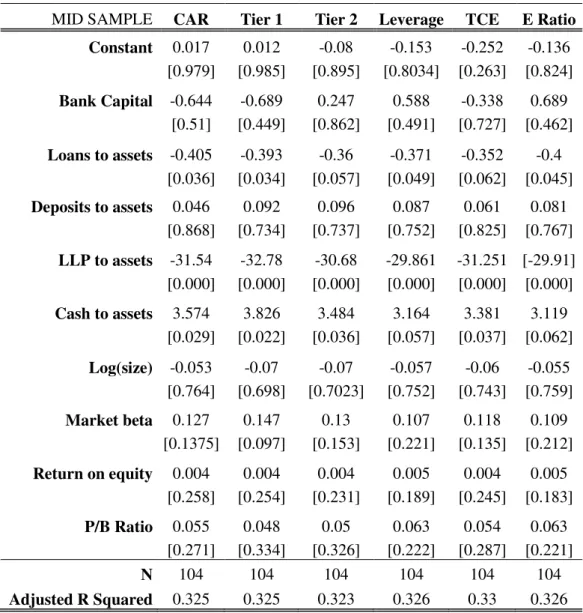
Table B2: Baseline model – Regression results- Mid Sample
Table B2 exhibits the baseline regression results for the mid subsample of banks (total assets in between US$ 1.5 billion and US$ 4 billion). The subsample is comprised of 104 banks and the adjusted r-squared is presented in the bottom of the table.
MID SAMPLE CAR Tier 1 Tier 2 Leverage TCE E Ratio
Constant 0.017 0.012 -0.08 -0.153 -0.252 -0.136 [0.979] [0.985] [0.895] [0.8034] [0.263] [0.824]
Bank Capital -0.644 -0.689 0.247 0.588 -0.338 0.689 [0.51] [0.449] [0.862] [0.491] [0.727] [0.462]
Loans to assets -0.405 -0.393 -0.36 -0.371 -0.352 -0.4 [0.036] [0.034] [0.057] [0.049] [0.062] [0.045]
Deposits to assets 0.046 0.092 0.096 0.087 0.061 0.081 [0.868] [0.734] [0.737] [0.752] [0.825] [0.767]
LLP to assets -31.54 -32.78 -30.68 -29.861 -31.251 [-29.91] [0.000] [0.000] [0.000] [0.000] [0.000] [0.000]
Cash to assets 3.574 3.826 3.484 3.164 3.381 3.119 [0.029] [0.022] [0.036] [0.057] [0.037] [0.062]
Log(size) -0.053 -0.07 -0.07 -0.057 -0.06 -0.055 [0.764] [0.698] [0.7023] [0.752] [0.743] [0.759]
Market beta 0.127 0.147 0.13 0.107 0.118 0.109 [0.1375] [0.097] [0.153] [0.221] [0.135] [0.212]
Return on equity 0.004 0.004 0.004 0.005 0.004 0.005 [0.258] [0.254] [0.231] [0.189] [0.245] [0.183]
P/B Ratio 0.055 0.048 0.05 0.063 0.054 0.063 [0.271] [0.334] [0.326] [0.222] [0.287] [0.221]
N 104 104 104 104 104 104
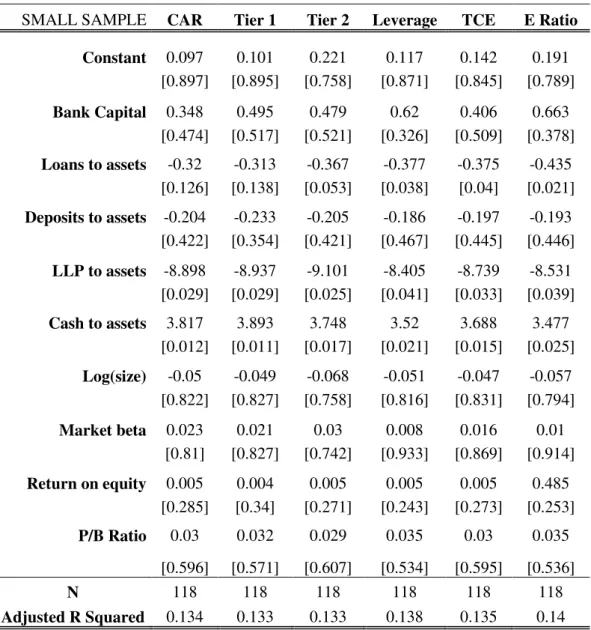
Table B3: Baseline model – Regression results- Small Sample
Table B3 exhibits the baseline regression results for the small subsample of banks (total assets below US$ 1.5 billion). The subsample is comprised of 118 banks and the adjusted r-squared is presented in the bottom of the table.
SMALL SAMPLE CAR Tier 1 Tier 2 Leverage TCE E Ratio
Constant 0.097 0.101 0.221 0.117 0.142 0.191 [0.897] [0.895] [0.758] [0.871] [0.845] [0.789]
Bank Capital 0.348 0.495 0.479 0.62 0.406 0.663 [0.474] [0.517] [0.521] [0.326] [0.509] [0.378]
Loans to assets -0.32 -0.313 -0.367 -0.377 -0.375 -0.435 [0.126] [0.138] [0.053] [0.038] [0.04] [0.021]
Deposits to assets -0.204 -0.233 -0.205 -0.186 -0.197 -0.193 [0.422] [0.354] [0.421] [0.467] [0.445] [0.446]
LLP to assets -8.898 -8.937 -9.101 -8.405 -8.739 -8.531 [0.029] [0.029] [0.025] [0.041] [0.033] [0.039]
Cash to assets 3.817 3.893 3.748 3.52 3.688 3.477 [0.012] [0.011] [0.017] [0.021] [0.015] [0.025]
Log(size) -0.05 -0.049 -0.068 -0.051 -0.047 -0.057 [0.822] [0.827] [0.758] [0.816] [0.831] [0.794]
Market beta 0.023 0.021 0.03 0.008 0.016 0.01 [0.81] [0.827] [0.742] [0.933] [0.869] [0.914]
Return on equity 0.005 0.004 0.005 0.005 0.005 0.485 [0.285] [0.34] [0.271] [0.243] [0.273] [0.253]
P/B Ratio 0.03 0.032 0.029 0.035 0.03 0.035
[0.596] [0.571] [0.607] [0.534] [0.595] [0.536]
N 118 118 118 118 118 118