BGD
6, 8215–8245, 2009Impact of cloudiness on net ecosystem exchange of carbon
dioxide in China
M. Zhang et al.
Title Page
Abstract Introduction
Conclusions References
Tables Figures
◭ ◮
◭ ◮
Back Close
Full Screen / Esc
Printer-friendly Version
Interactive Discussion Biogeosciences Discuss., 6, 8215–8245, 2009
www.biogeosciences-discuss.net/6/8215/2009/ © Author(s) 2009. This work is distributed under the Creative Commons Attribution 3.0 License.
Biogeosciences Discussions
Biogeosciences Discussionsis the access reviewed discussion forum ofBiogeosciences
Impact of cloudiness on net ecosystem
exchange of carbon dioxide in di
ff
erent
types of forest ecosystems in China
M. Zhang1,2, G.-R. Yu1, L.-M. Zhang1, X.-M. Sun1, X.-F. Wen1, S.-J. Han3, and J.-H. Yan4
1
Institute of Geographic Sciences and Natural Resources Research, Chinese Academy of Sciences, Beijing, 100101, China
2
Graduate University of the Chinese Academy of Sciences, Beijing, 100039, China
3
Institute of Applied Ecology, Chinese Academy of Sciences, Shenyang, 110016, China
4
South China Botanical Garden, Chinese Academy of Sciences, Guangzhou, 510650, China Received: 2 June 2009 – Accepted: 7 July 2009 – Published: 14 August 2009
Correspondence to: G.-R. Yu ([email protected])
Published by Copernicus Publications on behalf of the European Geosciences Union.
BGD
6, 8215–8245, 2009Impact of cloudiness on net ecosystem exchange of carbon
dioxide in China
M. Zhang et al.
Title Page
Abstract Introduction
Conclusions References
Tables Figures
◭ ◮
◭ ◮
Back Close
Full Screen / Esc
Printer-friendly Version
Interactive Discussion Abstract
Clouds can significantly affect carbon uptake of forest ecosystems by affecting incom-ing solar radiation on the ground, temperature and other environmental factors. In this study, we analyzed the effects of cloudiness on the net ecosystem exchange of carbon dioxide (NEE) of a temperate broad-leaved Korean pine mixed forest at Changbaishan 5
(CBS) and a subtropical evergreen broad-leaved forest at Dinghushan (DHS) of Chi-naFLUX, based on the flux data obtained during June–August from 2003 to 2006. The results showed that the response of the NEE of forest ecosystem to photosynthetically active radiation (PAR) was different under clear sky and cloudy sky conditions, and this difference was not consistent between CBS and DHS. Compared with clear skies, 10
light-saturated maximum photosynthetic rate (Pec,max) of CBS during mid-growing
sea-son (from June to August) was respectively enhanced by 34%, 25%, 4% and 11% on cloudy skies in 2003, 2004, 2005 and 2006; however,Pec,max of DHS was higher
un-der clear skies than unun-der cloudy skies from 2004 to 2006. NEE of forests at CBS reached its maximum when the clearness index (kt) was between 0.4 and 0.6, and the 15
NEE decreased obviously whenkt exceeded 0.6. Compare with CBS, although NEE of forest at DHS tended to the maximum whenktvaried between 0.4 and 0.6, the NEE did not decrease noticeably whenkt exceeded 0.6. The results indicated that cloudy sky conditions were more beneficial to carbon uptake for the temperate forest ecosys-tem rather than for the subtropical forest ecosysecosys-tem. This is due to the fact that the 20
non-saturating light conditions and increase of diffuse radiation were more beneficial to photosynthesis, and the reduced temperature was more conducive to decreasing the ecosystem respiration in temperate forest ecosystems under cloudy sky conditions. This phenomenon is important to evaluate carbon uptake of temperate forests under climate change conditions.
BGD
6, 8215–8245, 2009Impact of cloudiness on net ecosystem exchange of carbon
dioxide in China
M. Zhang et al.
Title Page
Abstract Introduction
Conclusions References
Tables Figures
◭ ◮
◭ ◮
Back Close
Full Screen / Esc
Printer-friendly Version
Interactive Discussion 1 Introduction
Solar radiation, temperature and moisture are the main environmental factors that con-trol carbon dioxide exchange between terrestrial ecosystems and the atmosphere (Law et al., 2002; Baldocchi, 2008). Changes in cloudiness and aerosol content of the at-mosphere can directly influence solar radiation, direct and diffuse radiation received 5
on the ground, and correspondingly temperature and the vapor pressure deficit can be changed (Gu et al., 1999, 2003). These changes can strongly affect carbon exchange between terrestrial ecosystems and the atmosphere (Letts et al., 2005; Urban et al., 2007). Many studies have shown that an increase in diffuse radiation at the ecosys-tem surface significantly enhances net ecosysecosys-tem exchange of carbon dioxide (NEE) 10
(Goulden et al., 1997; Gu et al., 1999, 2003; Law et al., 2002) and light use efficiency (LUE) of temperate forest ecosystems (Gu et al., 2002; Alton et al., 2007; Farquhar and Roderick, 2008). Currently, global warming has changed the spatial patterns of precip-itation and cloudiness at the global scale (Rind et al., 1990; Kirschbaum and Fischlin, 1995), and air pollution has changed aerosol content of the atmosphere. The changes 15
in cloudiness and aerosol content of the atmosphere will affect the carbon sink function of terrestrial ecosystems in the future.
Annual precipitation has decreased in North and Northeast China and increased in the mid and lower Yangtze River basin since the 1990’s (Wang et al., 2004; Ding et al., 2006) because of climate change. The changes in precipitation patterns can 20
make cloudiness decrease in North and Northeast China, but increase in south of the Yangtze River region. Environmental factors, such as solar radiation received on the ground, temperature, and moisture can also be changed in these regions. Therefore, how these changes may affect carbon uptake of forest ecosystems deserves in-depth exploration in different regions of China (Yu et al., 2003, 2008).
25
A vegetation sequence distributes along the North-South Transect of Eastern China (NSTEC), which includes cold temperate coniferous forests, temperate mixed forests, warm temperate deciduous broadleaf forests, subtropical evergreen coniferous forests,
BGD
6, 8215–8245, 2009Impact of cloudiness on net ecosystem exchange of carbon
dioxide in China
M. Zhang et al.
Title Page
Abstract Introduction
Conclusions References
Tables Figures
◭ ◮
◭ ◮
Back Close
Full Screen / Esc
Printer-friendly Version
Interactive Discussion evergreen broadleaf forests, and tropical rainforests from the cold temperate zone to
the subtropical zone (Yu et al., 2006, 2008). Carbon storage by these forest ecosys-tems plays an important role in the regional and global carbon cycle (Fang et al., 2001; Yu et al., 2008). The temperate broad-leaved Korean pine forest at Changbaishan (CBS) and subtropical evergreen broad-leaved forest at Dinghushan (DHS), which be-5
long to ChinaFLUX, are located in the NSTEC. The two forest ecosystems respectively represent the north temperate natural forest ecosystem and the south subtropical nat-ural forest ecosystem in China. Both of the forests at CBS and DHS are old-growth forests, but they are still acting as strong carbon sink. The annual average values of net ecosystem productivity (NEP) (from 2003 to 2005) at CBS and DHS were 259±19 10
and 434±66 g C m−2yr−1, respectively (Yu et al., 2008).
Previous studies have shown that the responses to environmental factors of carbon exchange in the forest ecosystems were different between CBS and DHS (Guan et al., 2006; Wang et al., 2006; Zhang et al., 2006; Yu et al., 2008). Solar radiation received on the ground and temperature mainly controlled carbon budget of the temperate forest 15
ecosystem at CBS (Zhang et al., 2006; Yu et al., 2008), furthermore, solar radiation received on the ground was the primary factor controlling the daytime CO2 flux of this ecosystem during the growing season (Guan et al., 2006). However, solar radiation re-ceived on the ground was insufficient at DHS due to the heavy precipitation in the rainy season (summer). Thus, the net carbon uptake of this subtropical forest ecosystem 20
attained the highest value at the beginning of the dry seasons (autumn) rather than the rainy seasons (summer) (Zhang et al., 2006; Yu et al., 2008; Wang et al., 2006).
According to previous results, we can deduce that net carbon uptake of the two forest ecosystems responds to environmental factors differently. That is because the adap-tations to climate of carbon exchange processes are different between the two forest 25
BGD
6, 8215–8245, 2009Impact of cloudiness on net ecosystem exchange of carbon
dioxide in China
M. Zhang et al.
Title Page
Abstract Introduction
Conclusions References
Tables Figures
◭ ◮
◭ ◮
Back Close
Full Screen / Esc
Printer-friendly Version
Interactive Discussion 2006) and cause ecosystem respiration to increase in summer. Therefore, net carbon
uptake of temperate forest decreased. According to these results, we assumed that when solar radiation received on the ground and temperature relatively decreased un-der cloudy skies, the environmental condition was probably beneficial to carbon uptake by temperate forest ecosystems in summer. Compared with temperate forest, in the 5
subtropical forest ecosystem, the temperature and moisture reached the maximum, but solar radiation received on the ground insufficient in summer, because of the heavy precipitation and more cloudy days. Under cloudy sky conditions, the higher temper-ature and moisture could make ecosystem respiration increase, but insufficient solar radiation received on the ground could make photosynthesis decrease. Therefore, net 10
carbon uptake of subtropical forest would decrease. Then, we assumed that when solar radiation received on the ground increased under clear skies, this environmental condition was probably beneficial to carbon uptake of the subtropical forest ecosystem in summer. According to these assumptions, when the main environmental factors that control the carbon budget of temperate and subtropical forest ecosystems change with 15
the pattern of precipitation and cloudiness in China, whether net carbon uptake of the two type forest ecosystems may increase or decrease.
In this study, our major objective is to reveal the effects of changes in cloudiness on carbon absorption of the temperate and subtropical forest ecosystem at CBS and DHS in East China, and whether the effects would be different between the temperate 20
forest ecosystem and subtropical forest ecosystem. This study will help us gain a deeper understanding of the control of changed environmental factors with cloudiness to carbon budget processes of natural forest ecosystems in the Asia moon-soon region under climate change conditions.
BGD
6, 8215–8245, 2009Impact of cloudiness on net ecosystem exchange of carbon
dioxide in China
M. Zhang et al.
Title Page
Abstract Introduction
Conclusions References
Tables Figures
◭ ◮
◭ ◮
Back Close
Full Screen / Esc
Printer-friendly Version
Interactive Discussion 2 Methods
2.1 Site descriptions and measurements
The temperate broad-leaved Korean pine forest at Changbaishan (CBS) is located in Jinlin Province of China (41◦41′49′′–42◦25′18′′N, 127◦42′55′′–128◦16′48′′E). It be-longs to the monsoon-influenced, temperate continental climate and its growing sea-5
son is from May to September. The subtropical evergreen broad-leaved forest at Dinghushan (DHS) is located in Guangdong Province of China (23◦09′–23◦11′N, 112◦30′–112◦33′E) and belongs to the subtropical monsoon humid climate. Its rain-fall has a distinct pattern of wet season (from April to September) and dry season (from November to March). Table 1 gives extensive descriptions of the two sites (Guan 10
et al., 2006; Zhang et al., 2006; Yu et al., 2008).
CO2 flux over the two forest ecosystems has been measured with eddy covariance (EC) systems since 2002. The EC system consists of an open-path infrared gas an-alyzer (Model LI-7500, LICOR Inc., Lincoln, NE, USA) and a 3-D sonic anemometer (Model CSAT3, Campbell Scientific Inc., Logan, UT, USA). The signals of the instru-15
ments were recorded at 10 Hz by a CR5000 datalogger (Model CR5000, Campbell Scientific Inc.) and then block-averaged over 30-min intervals for analyses and archiv-ing. The routine meteorological variables were measured simultaneously with the eddy fluxes. Air humidity and air temperature profiles were measured with shielded and aspi-rated probes (HMP45C, Vaisala, Helsinki, Finland) at different heights above and within 20
the canopy. Global radiation and net radiation were measured with radiometers (CM11 and CNR-1, Kipp & Zonen, Delft, The Netherlands). Photosynthetically active radiation (PAR) above the canopy was measured with a quantum sensor (LI-190Sb, LiCor Inc., USA). In order to ensure the accuracy of the radiation measurement, CM11 and LI-190Sb were calibrated and compared with other CM11 and LI-LI-190Sb sensors that were 25
BGD
6, 8215–8245, 2009Impact of cloudiness on net ecosystem exchange of carbon
dioxide in China
M. Zhang et al.
Title Page
Abstract Introduction
Conclusions References
Tables Figures
◭ ◮
◭ ◮
Back Close
Full Screen / Esc
Printer-friendly Version
Interactive Discussion thermocouple probes (105T, Campbell, USA, CS616 L, Compbell, USA) and water
content reflectometers (CS616, Campbell Scientific Inc.), respectively. All meteorolog-ical measurements were recorded at 30-min intervals with dataloggers (Model CR10X & CR23X, Campbell Scientific Inc.) (Guan et al., 2006; Zhang et al., 2006; Yu et al., 2008). Detailed information on routine meteorological variables is summarized in Ta-5
ble 1.
2.2 Data processing
We analyzed the effect of changes in cloudiness on NEE of forests at CBS and DHS, based on 30-min CO2 flux data and routine meteorological data measured during the
growing season (June–August) from 2003 to 2006. Due to lack of continuous measure-10
ments of cloudiness at the two sites, cloudiness is used in a very general sense and refers to the presence, quality, and quantity of clouds in the sky, and we used the clear-ness index (kt) (Gu et al., 1999) to describe the continuous changes in the cloudiness. Based on the clear sky conditions, we analyzed the responses of NEE to photosynthet-ically active radiation (PAR) under clear and cloudy sky, and examined the relationship 15
betweenkt and NEE. These methods, which have been used in many related studies (Gu et al., 1999, 2002; Law et al., 2002; Alton et al., 2007), were simple and direct for judging whether changes in cloudiness could affect NEE of forest ecosystem.
2.2.1 Flux data processing
We used a program to process raw 30-min flux data. The program included that (step 1) 20
3-D coordinate rotation was applied to force the average vertical wind speed to zero and to align the horizontal wind to mean wind direction (Baldocchi et al., 2000; Wilczak et al., 2001), (step 2) flux data was corrected for the variation of air density caused by transfer of heat and water vapor (Webb et al., 1980), (step 3) the storage 25 below EC height was calculated by using the temporal change in CO2 concentration above the 25
BGD
6, 8215–8245, 2009Impact of cloudiness on net ecosystem exchange of carbon
dioxide in China
M. Zhang et al.
Title Page
Abstract Introduction
Conclusions References
Tables Figures
◭ ◮
◭ ◮
Back Close
Full Screen / Esc
Printer-friendly Version
Interactive Discussion filtered and data gaps were filled by using the look-up table method (Falge et al., 2001;
Guan et al., 2006; Zhang et al., 2006).
In this study, we only used the data measured during mid-growing season (June– August) from 2003 to 2006 to eliminate the effect of changing leaf area index (LAI). The LAI of CBS was about 5.3±0.1 m2m−2from June to August in the four years. The
5
broad-leaved forest is evergreen at DHS, and its LAI does not vary much seasonally and intra-seasonally. The LAI was about 4.6±0.2 m2m−2 from June to August in the
four years.
2.2.2 Defining clearness index
The clearness index (kt) is defined as the ratio of global solar radiation (S, W m−2) 10
received at the Earth surface to the extraterrestrial irradiance at a plane parallel to the Earth surface (Se, W m
−2
) (Gu et al., 1999):
kt=S
Se, (1)
Se=Ssc[1+0.033 cos(360td/365)] sinβ, (2)
sinβ=sinϕ·sinδ+cosϕ·cosδ·cosω (3)
15
whereSsc is the solar constant (1370 W m −2
), and td is the day of year,βis the solar elevation angle,φis degree of latitude,δ is declination of the sun,ωis time angle. kt reflects not only sky conditions, but also the degree of influence of cloudiness on solar radiation received at the Earth surface. For a given solar elevation angle, the value of
ktclosing to zero indicates the increase in cloud thickness; solar radiation received by 20
BGD
6, 8215–8245, 2009Impact of cloudiness on net ecosystem exchange of carbon
dioxide in China
M. Zhang et al.
Title Page
Abstract Introduction
Conclusions References
Tables Figures
◭ ◮
◭ ◮
Back Close
Full Screen / Esc
Printer-friendly Version
Interactive Discussion 2.2.3 Defining clear skies
Because CBS and DHS for the rainy season are from June to August, days with no clouds for the whole daytime are rare in the two forest ecosystems. We identified the clear mornings and afternoons based on a half day basis (Gu et al., 1999; Law et al., 2002). We set the two criteria for clear morning and afternoon. First,kt must increase 5
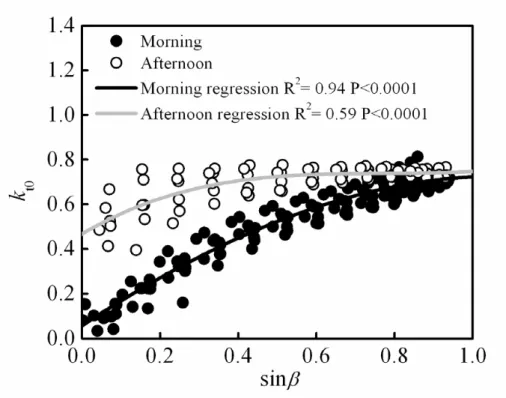
smoothly with solar elevation angle. Second, the curve of the relation between the clear-skykt and sin βmust form an envelope in the lumped scatter plot of kt against sinβ (Gu et al., 1999; Law et al., 2002). Figure 1 showed the relationship between
ktand sin βunder clear skies, which can be fitted by cubic polynomial (Eq. 4) (Gu et al., 1999). Asymmetry existed between the clear mornings and the clear afternoons 10
(Fig. 1).
kt0=asin3β+bsin2β+csinβ+d (4)
wherekt0is clear sky clearness index, a, b, c, d are regression coefficients.
2.2.4 Defining diffuse PAR
For a given solar elevation angle, when sky conditions changed from clear to cloudy, not 15
only total solar radiation received by the ecosystem decrease, but diffuse radiation and direct radiation were changed as well (Gu et al., 2002; Urban et al., 2007). Because diffuse PAR was not measured at CBS and DHS, we usedktand βas the predictors for calculating diffuse PAR. The corresponding equations are as follows (Reindl et al., 1990; Gu et al., 1999).
20
PARdif=PAR×
[1+0.3(1−q2)]q
1+(1−q2) cos2(90◦−β) cos3β (5) q=(Sf
Se)/kt (6)
Interval: 0≤kt≤0.3; Constraint:Sf/Se≤kt
BGD
6, 8215–8245, 2009Impact of cloudiness on net ecosystem exchange of carbon
dioxide in China
M. Zhang et al.
Title Page
Abstract Introduction
Conclusions References
Tables Figures
◭ ◮
◭ ◮
Back Close
Full Screen / Esc
Printer-friendly Version
Interactive Discussion Interval: 0.3<kt<0.78; Constraint: 0.1kt≤Sf/Se≤0.97kt
Sf/Se=kt[1.400−1.749kt+0.177 sinβ] (8) Interval: 0.78≤kt; Constraint: 0.1kt≤Sf/Se
Sf/Se=kt[0.486kt−0.182 sinβ] (9)
where PARdif is the diffuse PAR (µmol quantum m−2s−1), Sf denotes the total diffuse 5
radiation received by a horizontal plane on the Earth surface (W m−2). 2.2.5 The responses of NEE to PAR
The responses of NEE to PAR can be described by Michaelis-Menten equation (Goulden et al., 1997; Aubinet et al., 2001; Wu et al., 2006; Zhang, 2006):
NEE= α PARPec,max
α PAR+Pec,max
+Re, (10)
10
where PAR is the photosynthetically active radiation (µmol quantum m−2s−1), α is the ecosystem apparent quantum yield (mg CO2µmol
−1
quantum),Pec,max is the
light-saturated maximum photosynthetic rate (mg CO2m
−2
s−1),Re is the average daytime ecosystem respiration (mg CO2m
−2
s−1). 2.2.6 Flux partitioning
15
NEE was decided by gross ecosystem photosynthesis (GEP) and ecosystem respira-tion (Re):
GEP=Re−NEE. (11)
BGD
6, 8215–8245, 2009Impact of cloudiness on net ecosystem exchange of carbon
dioxide in China
M. Zhang et al.
Title Page
Abstract Introduction
Conclusions References
Tables Figures
◭ ◮
◭ ◮
Back Close
Full Screen / Esc
Printer-friendly Version
Interactive Discussion this study, we used the Lloyd and Taylor equation (1994) to estimate Re. The
night-time NEE data under turbulent conditions were used to establish theRe-temperature response relationship (Eq. 12):
Re=Rref eE0(1/(Tref
−T0)−1/(T−T0))
(12) whereT is air temperature or soil temperature (◦C). For CBS, soil temperature at 5 cm 5
was used, while air temperature at 4 m above ground was used for DHS (Yu et al., 2005), because it gave better regressions (i.e. higherR2value) than soil temperature (Yu et al., 2005,2008). Rref stands for the ecosystem respiration rate at the reference
temperature (Tref, 10
◦
C).E0 is the parameter that essentially determines the
tempera-ture sensitivity of ecosystem respiration.T0is a constant, set at−46.02
◦
C. Equation 12 10
was also used to estimate daytimeRe.
When we got the whole day Re using Eq. (12), we could calculate GPP using Eq. (11).
2.3 Statistic analysis
The relationship between NEE, GPP, Re and environmental factors were fitted with 15
linear, polynomial and non-linear equations. All analyses were conducted using the Origin package. Statistical significant differences were set with P <0.05 (α=0.05) un-less otherwise stated.
3 Results
Since similar results were found for the two forest ecosystems in the years from 2003 20
to 2006, only 2005 results are shown.
BGD
6, 8215–8245, 2009Impact of cloudiness on net ecosystem exchange of carbon
dioxide in China
M. Zhang et al.
Title Page
Abstract Introduction
Conclusions References
Tables Figures
◭ ◮
◭ ◮
Back Close
Full Screen / Esc
Printer-friendly Version
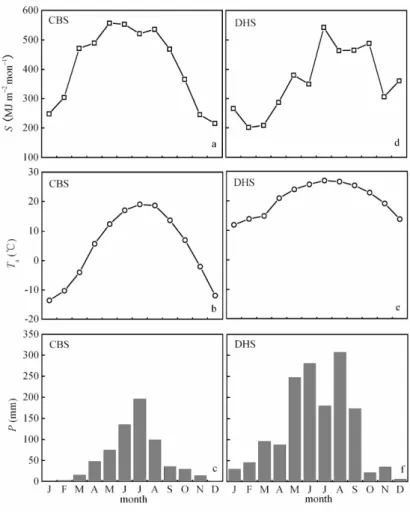
Interactive Discussion 3.1 The seasonal variation of environmental variables
Figure 2 shows the seasonal variations of monthly cumulative global solar radiation received by ecosystem (S), mean monthly air temperature (Ta) and monthly cumulative precipitation (P) at CBS and DHS. The seasonal variations of environmental factors of the two forest ecosystems were not exactly the same. The seasonal pattern of air 5
temperature was in good agreement with precipitation (Fig. 2b and c) at CBS. That is, when maximum precipitation occurred from June to August, air temperature was also highest. By contrast, the seasonal variation ofTadid not completely coincide with precipitation at DHS. The air temperature was at the maximum in July, but precipitation was lower (Fig. 2e and f). TheS from June to August was less than in May at CBS due 10
to the effect of precipitation (Fig. 2a). But, theS was at the maximum in July at DHS (Fig. 2d).
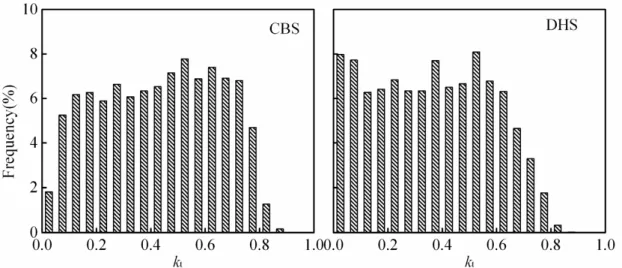
Although precipitation was abundant at the two forest ecosystems from June to Au-gust, the frequency of value ofkt that was less than 0.4, especially less than 0.1, was greater at DHS than at CBS (Fig. 3). The total precipitation from June to August was 15
436.6 mm and 768.6 mm, respectively, at CBS and at DHS. These facts indicated that there were more rainy days and fewer clear days at DHS than at CBS during this pe-riod. As a result, theS was less at DHS than at CBS from June to August (Fig. 2a and d). The totalS was 1610.1 MJ m−2at CBS, but was 1356 MJ m−2at DHS from June to August. Solar radiation was lower at DHS in summer, compared with CBS.
20
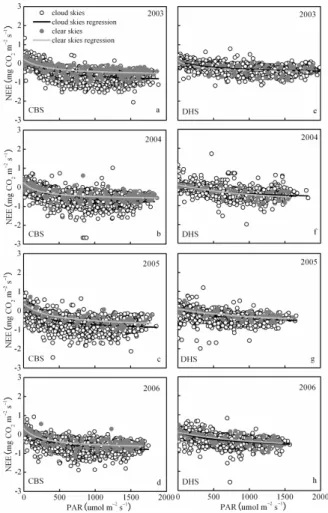
3.2 The responses of NEE to PAR of clear and cloudy skies
The differences in the response of NEE to PAR under clear skies and cloudy skies may directly reflect the effect of changes in cloudiness on carbon absorption of forest ecosystems.
The response of NEE to PAR was different under clear skies from that under cloudy 25
BGD
6, 8215–8245, 2009Impact of cloudiness on net ecosystem exchange of carbon
dioxide in China
M. Zhang et al.
Title Page
Abstract Introduction
Conclusions References
Tables Figures
◭ ◮
◭ ◮
Back Close
Full Screen / Esc
Printer-friendly Version
Interactive Discussion is, the net carbon uptake of this forest ecosystem increased under cloudy condition.
Compared with clear skies, the light-saturated maximum photosynthetic rate (Pec,max)
of CBS during mid-growing season (from June to August) was respectively enhanced by 34%, 25%, 4% and 11% on cloudy skies in 2003, 2004, 2005 and 2006 (Table 2). The NEE was not more negative for cloudy skies than for clear conditions at DHS 5
(Fig. 4e to h). The Pec,max was slightly higher on cloudy skies than on clear skies in
2003, but it was higher on clear skies than on cloudy skies in other three years (Table 2). Therefore, clear conditions were beneficial to increasing the net carbon uptake of the subtropical forest ecosystem at DHS.
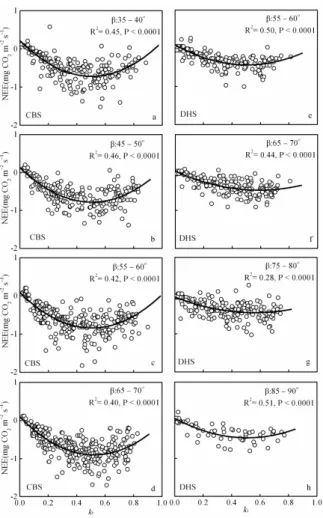
3.3 Changes of NEE with the clearness index 10
In order to further explore the effect of changes in clouds on NEE, we analyzed the response of NEE to changes of the clearness index at CBS and DHS. We grouped the data into 5◦ intervals of solar elevation angles to eliminate the effect of solar elevation angles on the responses of NEE tokt.
For different interval of solar elevation angle, the changes in NEE with the clearness 15
index (kt) in the mid-growing season were conic (the regressional coefficients of this conic equation are shown in Table 3) at CBS (Fig. 5a to d). The NEE reached its max-imum whenkt was between 0.4 and 0.6. The result indicated that net carbon uptake of the temperate forest at CBS was highest in this range of kt. However, the NEE decreased when the value ofkt exceeded 0.6 (Fig. 5a to d). It meant that net carbon 20
absorption was restrained, when the skies became clearer. Although the changes in NEE with the clearness index were conic at DHS during the same period (Fig. 5e to h) (the regressional coefficients of this conic equation were shown in Table 3). The changes in NEE withkt were different for different solar elevation angle intervals. For a lower solar elevation angle interval, when the value of kt varied between 0.4 and 25
0.6, the NEE tended to saturate or increase (Fig. 5e to g). But when the value of kt
exceeded 0.6, the NEE decreased withkt(Fig. 5h) for a higher solar elevation angle in-terval. Therefore, the clear skies condition did not obviously restrain net carbon uptake
BGD
6, 8215–8245, 2009Impact of cloudiness on net ecosystem exchange of carbon
dioxide in China
M. Zhang et al.
Title Page
Abstract Introduction
Conclusions References
Tables Figures
◭ ◮
◭ ◮
Back Close
Full Screen / Esc
Printer-friendly Version
Interactive Discussion of the forest at DHS.
4 Discussion
4.1 The differences in the responses of NEE to cloudiness between the two types of forest ecosystems
The NEE of temperate forest at CBS in North China reached its maximum under cloudy 5
skies, with the kt between 0.4 and 0.6. This result is consistent with the previous studies. The NEE of most temperate forest ecosystems reached their maximum values when the value ofkt is between 0.4–0.7 (Gu et al., 1999; Letts et al., 2005). Alton et al. (2007) found that the NEE of boreal forest had the greatest sensitivity to the changes in shortwave radiation among a sparse, boreal needle-leaf, a temperate broadleaf, 10
and a dense tropical, broadleaf forest ecosystems. These studies suggest that the stronger solar radiation under clear skies can become a restraining condition to net carbon absorption of temperate forests. Similarly, the NEE of temperate forest at CBS decreased under clear sky when the value of kt exceeded 0.6, but this was not the case for the subtropical forest at DHS.
15
The difference of the responses of NEE to cloudiness between temperate forest ecosystem and subtropical forest ecosystem might result from the response of en-vironmental factors to cloudiness are not consistent, and the control of enen-vironmental factors on carbon exchange processes are not different between the two types of forest ecosystems.
BGD
6, 8215–8245, 2009Impact of cloudiness on net ecosystem exchange of carbon
dioxide in China
M. Zhang et al.
Title Page
Abstract Introduction
Conclusions References
Tables Figures
◭ ◮
◭ ◮
Back Close
Full Screen / Esc
Printer-friendly Version
Interactive Discussion 4.2 The effects of changes in cloudiness on environmental factors of the two
types of forest ecosystems
Environmental conditions can change with cloudiness. For a given solar elevation angle interval, not only total solar radiation received on the ground decreased, but diffuse and direct radiation, air temperature changed as well, when the sky conditions changed 5
from clear to cloudy,. Whenkt was between 0.4 and 0.6, diffuse PAR received on the ground reached its maximum at CBS and DHS (Fig. 6a and b). This range ofktwas the same to the range ofktthat caused the NEE to reach the maximum. This indicated that photosynthesis of the two forest ecosystems might increase with the increase of diffuse PAR received by ecosystem.
10
Air temperature decreased linearly with kt at DHS and CBS, and the decrease in air temperature with kt was smaller at DHS than that at CBS (Fig. 6c). Therefore, the changes in air temperature could have more influence on ecosystem respiration at CBS. As a result, the changes in environmental factors with cloudiness might have a larger effect on net carbon uptake at CBS.
15
4.3 The differences of environmental control on GEP and Re between the two types of forest ecosystems
The responses of the carbon exchange process of the two forest ecosystems to envi-ronmental factors may be different, due to the different climate characteristics between CBS and DHS, the different responses of environmental factors to changes in cloudi-20
ness and the different adaptation of forest to climate. Therefore, the responses of NEE of the two forest ecosystems to changes in cloudiness may not be consistent.
The solar radiation received on the ground was stronger at CBS than at DHS from June to August due to heavier precipitation at DHS (Fig. 2 and Fig. 3). Furthermore, the strong solar radiation received on the ground accompanied with higher temperature 25
and a vapor press deficit (VPD) from June to August, this environmental condition resulted in the decreased of photosynthesis at CBS during this period (Guan et al.,
BGD
6, 8215–8245, 2009Impact of cloudiness on net ecosystem exchange of carbon
dioxide in China
M. Zhang et al.
Title Page
Abstract Introduction
Conclusions References
Tables Figures
◭ ◮
◭ ◮
Back Close
Full Screen / Esc
Printer-friendly Version
Interactive Discussion 2006). However, the higher temperature was accompanied by higher moisture at DHS,
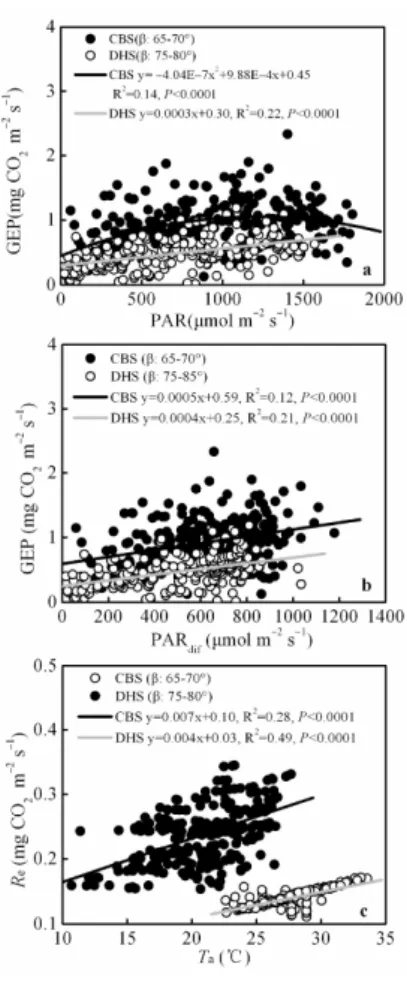
but the solar radiation was relatively low, photosynthesis could decrease under this condition during the same period (Zhang et al., 2006). For a higher solar elevation angle interval, when PAR exceeded 1000µmol quantum m−2s−1, especially when it exceeded 1500µmol quantum m−2s−1, the GEP of the forest ecosystem decreased 5
obviously at CBS (Fig. 7a). This indicated that this light condition was not beneficial to photosynthesis of the ecosystem at CBS. However, because the PAR rarely reached the light saturation threshold value, the GEP of the subtropical forest ecosystem did not decreased with the increase of PAR at DHS (Fig. 7a), Therefore, the stronger light conditions restrained the photosynthesis of the ecosystem at CBS rather than at DHS. 10
The increase in incoming diffuse radiation is one of the important factors that en-hance forest ecosystem photosynthesis (Gu et al., 2002; Urban et al., 2007). Shade leaves occupy a larger proportion at the lower part of forest canopy, and receive less direct radiation, thus they receive mainly diffuse radiation for photosynthesis. There-fore, the photosynthesis of shade leaves is enhanced when the diffuse radiation in-15
creases with cloudiness, and the whole canopy photosynthesis is increased (Urban et al., 2007). For a given solar elevation angle interval, GEP increased linearly with diffuse PAR received by the ecosystems at CBS and DHS from June to August (Fig. 7b), but GEP increased more noticeably with diffuse PAR received by the ecosystem at CBS than at DHS (Fig. 7b). This result might be due to the effect of different LAI and canopy 20
structure on the photosynthesis at CBS and DHS.
Temperature is one of the main environmental factors that control forest ecosystem respiration. The ecosystem respiration (Re) at CBS and DHS varied linearly with tem-perature (Fig. 7c), but the increased rate ofRewith temperature was larger at CBS than that at DHS (Fig. 7c). This is because theRe of the temperate forest at CBS exhibited 25
higher temperature sensitivity than that at DHS (Yu et al., 2008).
BGD
6, 8215–8245, 2009Impact of cloudiness on net ecosystem exchange of carbon
dioxide in China
M. Zhang et al.
Title Page
Abstract Introduction
Conclusions References
Tables Figures
◭ ◮
◭ ◮
Back Close
Full Screen / Esc
Printer-friendly Version
Interactive Discussion respiration for the temperate forests. As a result, NEE of the temperate forest
creased. However, the environmental conditions of cloudy skies, including the de-creased in total radiation, inde-creased diffuse radiation received on the ground and re-duced temperatures, are positive for the temperate forest in North China to achieve maximal NEE in midsummer. However, during the same time, high temperature and 5
high moisture caused ecosystem respiration increase, and insufficient PAR caused reduced photosynthesis under cloudy skies for subtropical forest ecosystem. But, pho-tosynthesis increased with PAR when the cloudiness reduced. Therefore, the clear sky conditions did not restrain NEE of subtropical forest ecosystem.
In this study, The differences of the response of carbon budget processes to environ-10
mental factors between the temperate forest at CBS and the subtropical forest at DHS were discussed, which resulted in different NEE responses to cloudiness between the two forest ecosystems. However, we need to study the response characteristics of car-bon budget of more types of forest ecosystems to cloudiness in different climatic zones in future researches, in order to find a more accurate rule about the response of NEE to 15
cloudiness in different regions. Furthermore, we need to thoroughly explore the effects of changes in the solar spectrum with cloudiness on the carbon budget of different for-est ecosystems, and the influences of transmission rules of direct radiation and diffuse radiation in a complex canopy on carbon budget in different forest ecosystems.
5 Conclusions 20
Similar to most temperate forests in Northern Hemisphere, cloudy sky conditions were beneficial to net carbon uptake of temperate forests in North China, but the too strong solar radiation conditions of clear skies would lead to decline in net carbon uptake. Solar radiation received on the ground increased under clear skies in midsummer, but the diffuse radiation decreased and the temperature increased, these environmental 25
conditions could result in a decrease of photosynthesis and increase of ecosystem respiration in temperate forest. Therefore, NEE of temperate forests would decrease
BGD
6, 8215–8245, 2009Impact of cloudiness on net ecosystem exchange of carbon
dioxide in China
M. Zhang et al.
Title Page
Abstract Introduction
Conclusions References
Tables Figures
◭ ◮
◭ ◮
Back Close
Full Screen / Esc
Printer-friendly Version
Interactive Discussion relatively. However, when the clearness index was between 0.4–0.6, the environmental
factors were optimal and the NEE of the temperate forest reached the highest level on the cloudy skies condition. For subtropical evergreen forests, solar radiation increased certainly with the reduced cloudiness in midsummer could enhance the photosynthesis of the ecosystems. Therefore, the clear sky conditions were not beneficial to net carbon 5
uptake of temperate forest ecosystem rather than subtropical forest ecosystems.
Acknowledgements. This research was supported by Asia 3 Foresight Program
(30721140307), the National Key Research and Development Program (2010CB833500), National Natural Science Foundation of China (Project No. 30590381), the “Hundred Talents” Program of the Chinese Academy of Sciences and the Knowledge Innovation Project of the
10
Chinese Academy of Sciences (KZCX2-YW-432). We acknowledge the researchers of CBS and DHS sites for providing data.
References
Alton, P. B., North, P. R., and Los, S. O.: The impact of diffuse sunlight on canopy light-use efficiency gross photosynthetic product and net ecosystem exchange in three forest biomes,
15
Global Change Biol., 13, 1–12, 2007.
Aubinet, M., Chermanne, B., Vandenhaute, M., Longdoz, B., Yernaux, M., and Laitat, E.: Long term carbon dioxide exchange above a mixed forest in the Belgian Ardennes, Agr. For. Me-teorol., 108, 293–315, 2001.
Baldocchi, D., Finnigan, J., Wilson, K., Paw, U. K. T., and Falge, E.: On measuring net
ecosys-20
tem carbon exchange over tall vegetation on complex terrain, Bound.-Lay. Meteorol., 96, 257–291, 2000.
Baldocchi, D.: “Breathing” of the terrestrial biosphere: lessons learned from a global network of carbon dioxide flux measurement systems, Aust. J. Bot., 56, 1–26, 2008.
Carrara, A., Kowalski, A. S., Neirynck, J., Janssens, I. A., Curiel Yuste, J., and Ceulemans, R.:
25
Net ecosystem CO2 exchange of mixed forest in Belgium over 5 years, Agr. For. Meteorol., 119, 209–227, 2003.
BGD
6, 8215–8245, 2009Impact of cloudiness on net ecosystem exchange of carbon
dioxide in China
M. Zhang et al.
Title Page
Abstract Introduction
Conclusions References
Tables Figures
◭ ◮
◭ ◮
Back Close
Full Screen / Esc
Printer-friendly Version
Interactive Discussion
assessment report of climate change (I): Climate change in China and the future trend, Adv. Climate Change Res., 2(1), 3–8, 2006.
Falge, E., Baldocchi, D., Olson, R., Anthoni, P., Aubinet, M., Bernhofer, C., Burba, G., Ceule-mans, R., Clement, R., Dolman, H., Granier, A., Gross, P., Gr ¨unwald, T., Hollinger, D., Jensen, N. O., Katul, G., Keronen, P., Kowalski, A., Lai, C. T., Law, B. E., Meyers, T.,
Mon-5
crieff, J., Moors, E., Munger, J. W., Pilegaard, K., Rannik, ¨U., Rebmann, C., Suyker, A., Tenhunen, J., Tu, K., Verma, S., Vesala, T., Wilson, K., and Wofsy, S.: Gap filling strategies for defensible annual sums of net ecosystem exchange, Agr. For. Meteorol., 107, 43–69, 2001.
Fang, J. Y., Chen, A. P., Peng, C. H., Zhao, S. Q., and Ci, L. J.: Changes in forest biomass
10
carbon storage in China between 1949 and 1998, Science, 292, 2320–2322, 2001.
Farquhar, G. D. and Roderick, M. L.: Pinatubo, diffuse light, and carbon cycle, Science, 299, 1997–1998, 2008.
Goulden, M. L., Daube, B. C., Fan, S. M., Sutton, D. J., Bazzaz, A., Munger, J. W., and Wofsy, S.: Physiological responses of a black spruce forest to weather, J. Geophys. Res., 102,
15
28987–28996, 1997.
Gu, L. H., Baldocchi, D. D., Verma, S. B., Black, T. A., Vesala, T., Falge, E., and Dowty, P. R.: Advantages of diffuse radiation for terrestrial ecosystem productivity, J. Geophys. Res., 107(D6), 4050, doi:10.1029/2001JD001242, 2002.
Gu, L. H., Baldocchi, D. D., Wofsy, S. C., Michalsky, J., Urbanski, S., and Boden, T.: Response
20
of a deciduous forest to the Mount Pinatubo eruption: Enhanced photosynthesis, Science, 299, 2035–2038, 2003.
Gu, L. H., Fuentes, J. D., and Shugart, H. H.: Responses of net ecosystem exchanges of car-bon dioxide to changes in cloudiness: Results from two North American deciduous forests, J. Geophys. Res., 104, 31421–31434, 1999.
25
Guan, D. X. , Wu, J. B., Zhao, X. S., Han. S. J., Yu, G. R., Sun, X. M., and Jin, C. J.: CO2 fluxes over an old, temperate mixed forest in northeastern China, Agr. For. Meteorol., 137, 138–149, 2006.
Kirschbaum, M. U. F. and Fischlin, A.: Climate Change Impacts on Forests, in: Climate Change 1995: Impacts Adaptations And Mitigation Of Climate Change: Scientific Technical Analysis,
30
edited by: Watson, R. T., Zinyowera, M. C., and Moss, R. H., Cambridge University Press, New York, 95–129, 1996.
Law, B. E., Falge, E., Gu, L. H., Baldocchi, D., Pakwin, P., Berbigier, P., Davis, K., Dolman, A.
BGD
6, 8215–8245, 2009Impact of cloudiness on net ecosystem exchange of carbon
dioxide in China
M. Zhang et al.
Title Page
Abstract Introduction
Conclusions References
Tables Figures
◭ ◮
◭ ◮
Back Close
Full Screen / Esc
Printer-friendly Version
Interactive Discussion
J., Falk, M., Fuentes, J. D., Goldstein, A., Granier, A., Grelle, A., Hollinger, D., Janssens, I. A., Jarvis, P., Jensen, N. O., Katul, G., Mahli, Y., Matteucci, G., Meyers, T., Monson, R., Munger, W., Oechel, W., Olson, R., Pilegaard, K., Paw, K. T., Thorgeirsson, H., Valentini, R., Verma, S., Vesala, T., Wilson, K., and Wofsy, S.: Environmental controls over carbon dioxide and water vapor exchange of terrestrial vegetation, Agr. For. Meteorol., 113, 97–120, 2002.
5
Letts, M. G. and Lafleur P. M.: On the relationship between cloudiness and net ecosystem carbon dioxide exchange in a peatland ecosystem, Ecoscience, 12(1), 53–59, 2005.
Lloyd, J. and Taylor, J. A.: On the temperature dependence of soil respiration, Funct. Ecol., 8, 315–323, 1994.
Reichstein, M., Fagle, E., Baldocchi, D., Palale, D., Aubinet, M., Berbigier, P., Bernhofer, C.,
10
Buchmann, N., Gilmanov, T., Granier, A., Gr ¨unwald, T., Havr `ankov `a, K., Ilvesniemi, H., Janous, D., Knohl, A., Laurila, T., Lohila, A., Loustau, D., Matteucci, G., Meyers, T., Migiletta, F., Ourcival, J. M., Pumpaney, J., Rambal, S., Rotenberg, E., Sanz, M., Tenhunen, J., Seufert, G., Vaccari, F., Vesala, T., Yakir, D., and Valentini, R.: On the separation of net ecosystem ex-change into assimilation and ecosystem respiration: review and improved algorithm, Global
15
Change Biol., 11, 1424–1439, 2005.
Reindl, D. T., Beckman, W. A., and Duffie, J. A.: Diffuse fraction correlation, Sol. Energy, 45, 1–7, 1990.
Rind, D., Goldberg, R., Hansen, J., Rosenzweig, C., and Ruedy, R.: Potential evapotranspira-tion and the likelihood of future drought, J. Geophys. Res., 95(D7), 9983–10004, 1990.
20
Urban, O., Janouˇs, D., Acosta, M., Czern´y, R., Markov ´a, I., Navr ´atil, M., Pavelka, M., Pokorn´y, R., ˇSprtov ´a, M., Zhang, R., ˇSpunda, V., Grace, J., and Marek, M. V.: Ecophysiological con-trols over the net ecosystem exchange of mountain spruce stand, Comparison of the re-sponse in direct vs. diffuse solar radiation, Global Change Biol., 13, 157–168, 2007.
Wang, Z. Y., Ding, Y. H., He, J. H., and Lu, J.: An updating analysis of the climate change in
25
China in recent 50 years, Acta Meteorol. Sin., 62(2), 228–236, 2004.
Webb, E. K., Pearman, G. I., and Leuning, R.: Correction of flux measurement for density effects due to heat and water vapor transfer, Q. J. Roy. Meteor. Soc., 106, 85–100, 1980. Wilczak, J. M., Oncley, S. P., and Stage, S. A.: Sonic anemometer tilt correction algorithms,
Bound.-Lay. Meteorol., 99, 127–150, 2001.
30
BGD
6, 8215–8245, 2009Impact of cloudiness on net ecosystem exchange of carbon
dioxide in China
M. Zhang et al.
Title Page
Abstract Introduction
Conclusions References
Tables Figures
◭ ◮
◭ ◮
Back Close
Full Screen / Esc
Printer-friendly Version
Interactive Discussion
Yu, G. R., Wen, X. F., Li, Q. K., Zhang, L. M., Ren, C. Y., Liu Y. F., and Guan, D. X.: Seasonal patterns and environmental control of ecosystem respiration in subtropical and temperate forests in China, Sci. China Ser. D, 48 (Suppl. I), 93–105, 2005.
Yu, G. R., Zhang, L. M., Sun, X. M., Fu, Y. L., Wen, X. F., Wang, Q. F., Li, S. G., Ren, C. Y., Song, X., Liu, Y. F., Han, S. J., and Yan, J. H.: Environmental controls over carbon exchange
5
of three forest ecosystems in eastern China, Global Change Biol., 14, 2555–2571, 2008. Zhang, L. M.: Ecophysiological controls on seasonal variations of ecosystem carbon exchange
of typical forest ecosystems along NSTEC, PhD dissertation, Institute of Geographic Sci-ences and Natural Resources Research, the Chinese Academy of SciSci-ences, Beijing, 119– 133, 2006.
10
Zhang, L. M., Yu, G. R., Sun, X. M., Wen, X. F., Ren, C. Y., Song, X., Liu, Y. F., Guan, D. X., Yan, J. H., and Zhang, Y. P.: Seasonal variation of carbon exchange of typical forest ecosystems along the eastern forest transect in China, Sci. China Ser. D, 36 (Suppl. I), 45–59, 2006.
BGD
6, 8215–8245, 2009Impact of cloudiness on net ecosystem exchange of carbon
dioxide in China
M. Zhang et al.
Title Page
Abstract Introduction
Conclusions References
Tables Figures
◭ ◮
◭ ◮
Back Close
Full Screen / Esc
Printer-friendly Version
Interactive Discussion Table 1.Site information.
Sites CBS DHS
Location 42◦
24′
N, 128◦
05′
E 23◦
10′
N, 112◦
34′
E Elevation (m) 738 300
Topography Flat Hilly Mean annual temperature (◦
C) 3.6 20.9 Annual precipitation (mm) 695 1956
Soil type Montane dark brown forest Lateritic red soil, yellow
soil soil
Canopy height (m) 26 17
Predominant species Pinus koriaensis, Tilia Castanopis chinensis,
amurensis, Quercus Schim asuperba, Pinus
mongolica, Fraxinus massonian
mandshurica, Acer mino
Leaf area index (LAI) (m2m−2) 6.1 (the maximum in the 4.0 (average) growing season)
Biomass (kg m−2) 36.23 14.14 Stand age (year) 200 100 Height of eddy covariance 41.5 27 system (m)
Height of radiation (m) 32 36 Precipitation (m) 70 36
Profiles of air temperature 2.5, 8, 22, 26, 32, 50, 60 4, 9, 15, 21, 27, 31, 36 and humidity (m)
BGD
6, 8215–8245, 2009Impact of cloudiness on net ecosystem exchange of carbon
dioxide in China
M. Zhang et al.
Title Page
Abstract Introduction
Conclusions References
Tables Figures
◭ ◮
◭ ◮
Back Close
Full Screen / Esc
Printer-friendly Version
Interactive Discussion Table 2. Parameter values of light response curve of CBS and DHS on clear skies and cloudy
skies from June to August in the years from 2003 to 2006.
Site Parameter values 2003 2004 2005 2006
Cloudy Clear Cloudy Clear Cloudy Clear Cloudy Clear skies skies skies skies skies skies skies skies
α
(mg CO2µmol−1)
−0.0036 −0.0027 −0.0037 −0.0041 −0.0039 −0.0032 −0.0039 −0.0044
Pec,max
CBS (mg CO2m−2s−1)
−1.309 −0.864 −1.210 −0.902 −1.307 −1.253 −1.213 −1.079
Re
(mg CO2m−2s−1) 0.281 0.217 0.278 0.257 0.244 0.369 0.244 0.337
R2 0.67 0.50 0.55 0.50 0.60 0.66 0.62 0.56
α
(mg CO2µmol−1)
−0.0012 −0.0019 −0.0011 −0.0009 −0.0012 −0.0007 −0.0012 −0.0008
Pec,max
DHS (mg CO2m−2s−1)
−0.682 −0.647 −0.839 −1.208 −0.81 −0.946 −0.9362 −1.155
Re
(mg CO2m−2s−1) 0.116 0.129 0.106 0.095 0.051 0.084 0.081 0.08
R2 0.50 0.39 0.44 0.59 0.45 0.54 0.52 0.50
BGD
6, 8215–8245, 2009Impact of cloudiness on net ecosystem exchange of carbon
dioxide in China
M. Zhang et al.
Title Page
Abstract Introduction
Conclusions References
Tables Figures
◭ ◮
◭ ◮
Back Close
Full Screen / Esc
Printer-friendly Version
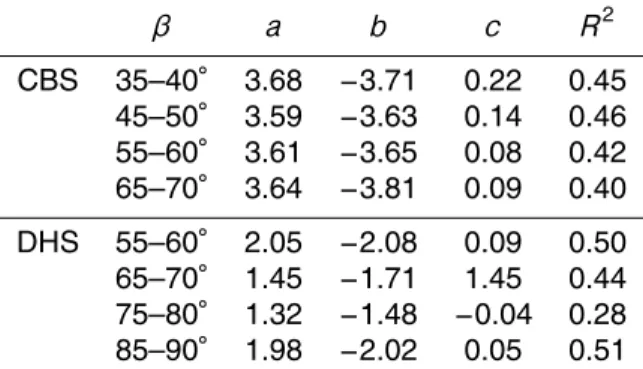
Interactive Discussion Table 3. Regressional Coefficients of the conic equation NEE=akt2+bkt+cfor CBS and DHS
in 2005.
β a b c R2
CBS 35–40◦ 3.68 −3.71 0.22 0.45 45–50◦ 3.59 −3.63 0.14 0.46 55–60◦ 3.61 −3.65 0.08 0.42 65–70◦ 3.64 −3.81 0.09 0.40 DHS 55–60◦ 2.05 −2.08 0.09 0.50
65–70◦
1.45 −1.71 1.45 0.44
75–80◦
1.32 −1.48 −0.04 0.28
85–90◦
BGD
6, 8215–8245, 2009Impact of cloudiness on net ecosystem exchange of carbon
dioxide in China
M. Zhang et al.
Title Page
Abstract Introduction
Conclusions References
Tables Figures
◭ ◮
◭ ◮
Back Close
Full Screen / Esc
Printer-friendly Version
Interactive Discussion Fig. 1. The relationship between clear sky clearness index (kt0) and sine of solar elevation
angles for the CBS site from June to August in 2003.
BGD
6, 8215–8245, 2009Impact of cloudiness on net ecosystem exchange of carbon
dioxide in China
M. Zhang et al.
Title Page
Abstract Introduction
Conclusions References
Tables Figures
◭ ◮
◭ ◮
Back Close
Full Screen / Esc
Printer-friendly Version
Interactive Discussion Fig. 2.The seasonal variation of global solar radiation (S), air temperature (Ta) and precipitation
BGD
6, 8215–8245, 2009Impact of cloudiness on net ecosystem exchange of carbon
dioxide in China
M. Zhang et al.
Title Page
Abstract Introduction
Conclusions References
Tables Figures
◭ ◮
◭ ◮
Back Close
Full Screen / Esc
Printer-friendly Version
Interactive Discussion
β
Fig. 3. Histograms of the frequency distribution of the variation of the clearness index (kt) for solar elevation anglesβ>20◦ at CBS and DHS from June to August in the years from 2003 to 2006.
BGD
6, 8215–8245, 2009Impact of cloudiness on net ecosystem exchange of carbon
dioxide in China
M. Zhang et al.
Title Page
Abstract Introduction
Conclusions References
Tables Figures
◭ ◮
◭ ◮
Back Close
Full Screen / Esc
Printer-friendly Version
Interactive Discussion Fig. 4. Light response curves of the forests at (a∼d) CBS and (e∼h) DHS on clear skies and
BGD
6, 8215–8245, 2009Impact of cloudiness on net ecosystem exchange of carbon
dioxide in China
M. Zhang et al.
Title Page
Abstract Introduction
Conclusions References
Tables Figures
◭ ◮
◭ ◮
Back Close
Full Screen / Esc
Printer-friendly Version
Interactive Discussion Fig. 5. Relationship between NEE and the clearness index (kt) at CBS and DHS for different
intervals of solar elevation angles from June to August in 2005.
BGD
6, 8215–8245, 2009Impact of cloudiness on net ecosystem exchange of carbon
dioxide in China
M. Zhang et al.
Title Page
Abstract Introduction
Conclusions References
Tables Figures
◭ ◮
◭ ◮
Back Close
Full Screen / Esc
Printer-friendly Version
Interactive Discussion Fig. 6. Changes of(a, b)diffuse PAR (PARdif) and(c)air temperature (Ta) with the clearness
BGD
6, 8215–8245, 2009Impact of cloudiness on net ecosystem exchange of carbon
dioxide in China
M. Zhang et al.
Title Page
Abstract Introduction
Conclusions References
Tables Figures
◭ ◮
◭ ◮
Back Close
Full Screen / Esc
Printer-friendly Version
Interactive Discussion Fig. 7.Changes of GEP with(a)PAR,(b)diffuse PAR (PARdif), and Changes of(c)Rewith air
temperate (Ta) for selected intervals of solar elevation angles at CBS and DHS from June to August in 2005.