BGD
11, 9421–9449, 2014Typhoon impact on CO2flux of mangrove
ecosystem
H. Chen et al.
Title Page
Abstract Introduction
Conclusions References
Tables Figures
◭ ◮
◭ ◮
Back Close
Full Screen / Esc
Printer-friendly Version
Interactive Discussion
Discussion
P
a
per
|
Discus
sion
P
a
per
|
Discussion
P
a
per
|
Discussion
P
a
per
|
Biogeosciences Discuss., 11, 9421–9449, 2014 www.biogeosciences-discuss.net/11/9421/2014/ doi:10.5194/bgd-11-9421-2014
© Author(s) 2014. CC Attribution 3.0 License.
This discussion paper is/has been under review for the journal Biogeosciences (BG). Please refer to the corresponding final paper in BG if available.
Typhoons exert significant but di
ff
erential
impact on net carbon ecosystem
exchange of subtropical mangrove
ecosystems in China
H. Chen1,2, W. Lu1,2, G. Yan1,2, S. Yang1, and G. Lin2,3
1
Key Laboratory of the Ministry of Education for Coastal and Wetland Ecosystems, School of Life Sciences, Xiamen University, Xiamen, Fujian 361005, China
2
Division of Ocean Science and Technology, Graduate School at Shenzhen, Tsinghua University, Shenzhen 518055, China
3
Ministry of Education Key Laboratory for Earth System Modelling, Center for Earth System Science, Tsinghua University, Beijing 100084, China
Received: 15 April 2014 – Accepted: 28 May 2014 – Published: 17 June 2014
Correspondence to: G. Lin ([email protected])
BGD
11, 9421–9449, 2014Typhoon impact on CO2flux of mangrove
ecosystem
H. Chen et al.
Title Page
Abstract Introduction
Conclusions References
Tables Figures
◭ ◮
◭ ◮
Back Close
Full Screen / Esc
Printer-friendly Version
Interactive Discussion
Discussion
P
a
per
|
Discus
sion
P
a
per
|
Discussion
P
a
per
|
Discussion
P
a
per
|
Abstract
Typhoons are very unpredictable natural disturbances to subtropical mangrove forests in Asian countries, but litter information is available on how these disturbances af-fect ecosystem level carbon dioxide (CO2) exchange of mangrove wetlands. In this study, we examined short-term effect of frequent strong typhoons on defoliation and
5
net ecosystem CO2 exchange (NEE) of subtropical mangroves, and also synthesized
19 typhoons during a 4-year period between 2009 and 2012 to further investigate the regulation mechanisms of typhoons on ecosystem carbon and water fluxes following typhoon disturbances. Strong wind and intensive rainfall caused defoliation and local cooling effect during typhoon season. Daily total NEE values were decreased by 26–
10
50 % following some typhoons (e.g. W28-Nockten, W35-Molave and W35-Lio-Fan), but were significantly increased (43–131 %) following typhoon W23-Babj and W38-Megi. The magnitudes and trends of daily NEE responses were highly variable following different typhoons, which were determined by the balance between the variances of gross ecosystem production (GEP) and ecosystem respiration (RE). Furthermore,
re-15
sults from our synthesis indicated that the landfall time of typhoon, wind speed and rainfall were the most important factors controlling the CO2 fluxes following typhoon
events. These findings not only indicate that mangrove ecosystems have strong re-silience to the frequent typhoon disturbances, but also demonstrate the damage of in-creasing typhoon intensity and frequency on subtropical mangrove ecosystems under
20
future global climate change scenarios.
1 Introduction
Although mangrove ecosystems only cover a small fraction of world forests, they are highly important component in coastal and global carbon cycle (Bouillon et al., 2008a; Kristensen et al., 2008; Donato et al., 2011). They could provide numerous ecological
25
BGD
11, 9421–9449, 2014Typhoon impact on CO2flux of mangrove
ecosystem
H. Chen et al.
Title Page
Abstract Introduction
Conclusions References
Tables Figures
◭ ◮
◭ ◮
Back Close
Full Screen / Esc
Printer-friendly Version
Interactive Discussion
Discussion
P
a
per
|
Discus
sion
P
a
per
|
Discussion
P
a
per
|
Discussion
P
a
per
|
nutrient cycling (Tomlinson, 1986; Gilbert and Janssen, 1998). But due to aquaculture, urbanization and other human activities, the global mangrove area has been reduced by 1–2 % per year, and the mangrove areas in China has greatly lost since 1980s with only 22 700 ha remained (Alongi, 2002; Duke et al., 2007; Chen et al., 2009). Changes in tropical cyclone activities are one important component of global climate change,
5
and the characteristics of tropical cyclones will change in a warming climate (Webster et al., 2005; Emanuel, 2007; IPCC, 2007; Knutson et al., 2010). Knutson et al. (2010) predicted that the global mean maximum wind speed of tropical cyclones would in-crease by 2–11 % in 2100, and the frequency likely to dein-crease by 6–34 %. Coastal mangrove ecosystems are especially vulnerable to tropical cyclones due to their
loca-10
tion along coastlines (Kovacs et al., 2004; Milbrandt et al., 2006; Amiro et al., 2010; Barr et al., 2012). Although mangrove ecosystems exhibit a high degree of ecology stability to these disturbances, the increased intensity and frequency of storms may increase damage to mangroves through defoliation and tree mortality (Alongi, 2008; Gilman et al., 2008). Dietze and Clark (2008) investigated the detailed dynamics of
15
vegetation to hurricane disturbance using designed experimental gaps, and found that sprouts which constitute 26–87 % of early gap regeneration played important role in the maintenance of diversity. However, litter information is available on how these dis-turbances affect carbon dioxide (CO2) exchange of mangrove ecosystem, partly due
to few direct measurements of canopy level CO2fluxes of mangrove ecosystem before
20
and after tropical cyclone disturbances (Amiro et al., 2010; Barr et al., 2010, 2012). A synthesis of FLUXNET underscored the importance of stand-replacing distur-bance regulation on carbon budgets of ecosystem (Baldocchi, 2008). Running (2008) also illustrated the less extreme disturbances should be incorporated in future climate change studies. Disturbances such as tropical cyclones (typhoons, hurricanes or
cy-25
BGD
11, 9421–9449, 2014Typhoon impact on CO2flux of mangrove
ecosystem
H. Chen et al.
Title Page
Abstract Introduction
Conclusions References
Tables Figures
◭ ◮
◭ ◮
Back Close
Full Screen / Esc
Printer-friendly Version
Interactive Discussion
Discussion
P
a
per
|
Discus
sion
P
a
per
|
Discussion
P
a
per
|
Discussion
P
a
per
|
(Kovacs et al., 2004; Milbrandt et al., 2006; Li et al., 2007; Barr et al., 2012). Defolia-tion not only could greatly reduce LAI (leaf area index) and the daytime carbon uptake, but also increase litter decomposition and result in large ecosystem respiration (RE) following this disturbance (Ostertag et al., 2003; Ito, 2010).
In recent years, several studies examined possible impact of typhoon or hurricane
5
disturbances on net ecosystem CO2exchanges (NEE) (Li et al., 2007; Ito, 2010; Barr
et al., 2012). After 10 typhoons struck Japan, the canopy carbon gain of forests was decreased by 200 g C m−2yr−1(Ito, 2010). Li et al. (2007) reported a 22 % decrease of GPP (gross primary production) and a 25 % decrease of RE of a scrub-oak ecosystem after Hurricane France, resulted in no significant change in NEE. Stand-replacing
hurri-10
cane disturbances generally cause large defoliation and tree mortality, and hence large reduction in CO2 uptake over a long time period (Amiro et al., 2010; Barr et al., 2012),
whereas less extreme disturbances that do not have significant damage to stems have negligible effects on NEE (Li et al., 2007; Powell et al., 2008).
The complex variations of NEE depend on the balance between two interactive
pro-15
cesses, GEP (gross ecosystem production) and RE (Valentini et al., 2000; Wen et al., 2010; Zhang et al., 2010). GEP is mainly controlled by PAR (photosynthetically active radiation), and high VPD (vapor pressure deficit) and Ta (air temperature) limit daily photosynthetic rates (Goulden et al., 2004; Powell et al., 2008; Keith et al., 2012). GEP and RE respond independently to microclimate, but Re is regulated byTs(soil
tempera-20
ture), soil water content and debris on the forest floor (Li et al., 2007; Kwon et al., 2010; Barr et al., 2012). Kwon et al. (2010) observed that NEE depression is produced with different timing, magnitude and mechanism in a deciduous forest and farmland during Asian monsoon. These results indicate that the relative effects of these microclimatic factors determine the balance between GEP and RE, and hence the different trends
25
BGD
11, 9421–9449, 2014Typhoon impact on CO2flux of mangrove
ecosystem
H. Chen et al.
Title Page
Abstract Introduction
Conclusions References
Tables Figures
◭ ◮
◭ ◮
Back Close
Full Screen / Esc
Printer-friendly Version
Interactive Discussion
Discussion
P
a
per
|
Discus
sion
P
a
per
|
Discussion
P
a
per
|
Discussion
P
a
per
|
it is essential to investigate typhoon characteristics regulations (including wind speed, landfall point, frequency and duration) on CO2exchange of mangrove ecosystem.
The main objective of this study was to examine short-term effects of frequent strong typhoon on microclimate, defoliation and net ecosystem CO2exchange of two subtrop-ical mangroves in China. We also synthesize 19 typhoons during a four year period
5
between 2009 and 2012 to further investigate possible mechanisms for the regula-tions of typhoon characteristics on variaregula-tions of ecosystem carbon dynamics following typhoon disturbances.
2 Materials and methods
2.1 Site description
10
The measurements were made in two subtropical mangrove ecosystems located in Gulei Gulf, Fujian Province and Yingluo Bay, Guangdong Province, south of China. The first site, Yunxiao mangrove study site (thereafter YX), is situated in Zhangjiangkou Na-tional Mangrove Nature Reserve (23◦55′14.59′′N, 117◦25′4.9′′E). This nature reserve was established in 1997 as a provincial nature reserve, and has been include into the
15
Ramsar List in 2008. This site was dominated byKandelia obovata,Avicennia marina
and Aegiceras corniculatum, with the canopy height of 3–4 m. Based on China Me-teorological Administration, the 1981–2011 mean annual temperature and precipita-tion were 21.1◦C and 1285 mm, respectively. For YX, tides were irregular semidiurnal and the high tides can reach up to 1.0 m above the sediment, with tide water
salin-20
ity range between 1–22 ppt. The second site, Gaoqiao mangrove study site (there-after GQ), is located in Zhanjiang National Mangrove Nature Reserve (21◦34′3.04′′N, 109◦45′22.33′′E). This nature reserve is the largest mangrove nature reserve in China, and it also has been include into the Ramsar List in 2002. This site was dominated byBruguiera gymnorrhiza,A. corniculatumandA. marina, and the canopy height was
25
BGD
11, 9421–9449, 2014Typhoon impact on CO2flux of mangrove
ecosystem
H. Chen et al.
Title Page
Abstract Introduction
Conclusions References
Tables Figures
◭ ◮
◭ ◮
Back Close
Full Screen / Esc
Printer-friendly Version
Interactive Discussion
Discussion
P
a
per
|
Discus
sion
P
a
per
|
Discussion
P
a
per
|
Discussion
P
a
per
|
and 1 770 mm, respectively. Tides of GQ were regular diurnal and the high tides can reach up to 1.8 m above the sediment, with tide water salinity range between 1–30 ppt.
2.2 Eddy covariance and microclimatic measurements
The eddy covariance measurement systems were established in 2008 and 2009 at YX and GQ site. Each system was equipped with a three-dimensional sonic anemometer
5
(CSAT3; Campbell Scientific, Inc., USA) and an open-path infrared gas analyzer (LI-7500; Li-Cor, Inc., USA). The CSAT3 and LI-7500 were mounted at heights of 5.4 m for YX and 8.6 m for GQ. The footprint was in the direction of the local prevailing winds, which is southeast wind for YX and northeast wind for GQ. The eddy flux data were sampled at 10 Hz, and their mean, variance and covariance values were calculated
10
and logged at 30 min intervals using a digital micrologger (CR1000 for YX, CR3000 for GQ; Campbell Scientific, Inc., USA).
Air temperatures and relative humidity were measured with temperature and relative humidity probes (HMP45AC; Vaisala, Inc., Finland) at heights of 3.0 m, 12.6 m for YX and 2.6 m, 7.4 m, 8.6 m, 14.0 m for GQ. Soil temperatures were measured using
tem-15
perature probes (109; Campbell Scientific, Inc., USA) at three sediment layers (5 cm, 10 cm, 20 cm) for YX and at two sediment layers (10 cm, 20 cm) for GQ, and the av-erage soil temperatures were also measured using averaging soil TC probe (TCAV; Campbell Scientific, Inc., USA) at 10–20 cm sediment layer. Solar radiation, PAR and net radiation were determined with pyranometer sensor (LI-200SZ; Li-Cor, Inc., USA),
20
PAR quantum sensor (LI-190SZ; Li-Cor, Inc., USA) and four-component net-radiation sensor (NR01; Hukseflux Thermal Sensors, Inc., USA), respectively. Soil heat flux was measured with soil heat flux plate (HFP01SC; Hukseflux Thermal Sensors, Inc., USA). Wind speeds (010C; Met One Instruments, Inc., USA) and wind direction (020C; Met One Instruments, Inc., USA) were measured at heights of 3.0 m, 12.6 m for YX
25
BGD
11, 9421–9449, 2014Typhoon impact on CO2flux of mangrove
ecosystem
H. Chen et al.
Title Page
Abstract Introduction
Conclusions References
Tables Figures
◭ ◮
◭ ◮
Back Close
Full Screen / Esc
Printer-friendly Version
Interactive Discussion
Discussion
P
a
per
|
Discus
sion
P
a
per
|
Discussion
P
a
per
|
Discussion
P
a
per
|
sampled at 1 s intervals and averaged values were recorded at 30 min intervals with a CR1000 data logger (Campbell Scientific, Inc., USA).
2.3 Flux data processing and gap filling
The eddy covariance data were processed with the EC_PROCESSOR software pack-age (http://www4.ncsu.edu/~anoorme/ECP/) (Noormets et al., 2007), using the 2-axis
5
rotation and the Webb–Pearman–Leuning expression (Paw U et al., 2000; Mauder and Foken, 2006). Sonic temperatures were corrected for changes in humidity and pres-sure (Schotanus et al., 1983). The 30 min fluxes were corrected for the warming of IRGA according to Burba et al. (2006). We also removed anomalous or spurious data that were caused by rainfall events, instrument malfunction, power failure or IRGA
cal-10
ibration. These introduced data gaps that were filled following the methods of Falge et al. (2001). Mean diurnal variation method was used to fill short gaps by calculating the mean values of the same half-hour flux data within 14 days moving window. Larger data gaps were filled using look-up tables. For each site, daytime and nighttime look-up tables were created for each two months interval, which sorted by PPFD andTa. After
15
gap filling the data for corresponding days, data were extracted and analyzed with the micrometeorological data.
2.4 Typhoon impacts on mangrove ecosystem
In this study, we selected typhoons that were stronger than Category 8 (wind speed>
17.2 m s−1
), and landed at a distance less than 300 km from the YX or GQ site based on
20
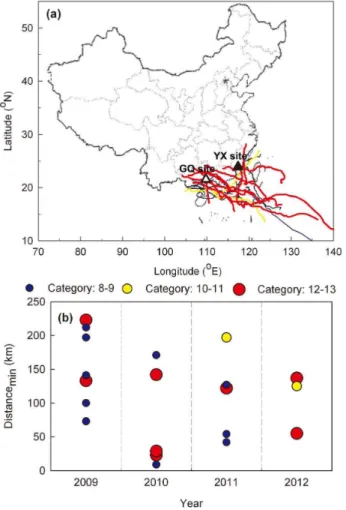
data from China Meteorological Agency, which resulted in a total of 19 typhoons passed over the YX and GQ site (Fig. 1) during a 4-year period between 2009 and 2012. Characteristics of each typhoon including typhoon name, DOYLand (the time of year that typhoon made landfall), duration (the length of time when the typhoon occurred at a distance less than 300 km from our study site), category (Beaufort wind force scale),
25
BGD
11, 9421–9449, 2014Typhoon impact on CO2flux of mangrove
ecosystem
H. Chen et al.
Title Page
Abstract Introduction
Conclusions References
Tables Figures
◭ ◮
◭ ◮
Back Close
Full Screen / Esc
Printer-friendly Version
Interactive Discussion
Discussion
P
a
per
|
Discus
sion
P
a
per
|
Discussion
P
a
per
|
Discussion
P
a
per
|
maximum wind speed near mangrove ecosystem when the typhoon was the nearest to it), distancemin(the minimum distance from mangrove study site during typhoon period) and rainfall are summarized in Supplement Table S1. If the dates of typhoon were very close to each other (less than seven days) and even overlapped, we combined them as a single typhoon. For example, typhoon Lionrock, Namtheum, Meranti and Fanapi
5
formed around late August and middle September, then we combined them as Lio-Fan. To categorize the selected typhoons quantitatively, we used the corresponding maximum wind speed and typhoon name to represent each typhoon. For example, the maximum wind speed of typhoon Lio-Fan was 35 m s−1
, and then we used W35-Lio-Fan to represent this typhoon.
10
For each typhoon, five clear days before and after typhoon made landfall were se-lected to calculate the daily mean air and sediment temperature (Ta,Ts), maximum air and sediment temperature (Ta
max,Tsmax), and photosynthetically active radiation (PAR).
The daily gap-filled fluxes (NEE, GEP, RE and ET (evapotranspiration)) were calculated the same way as these microclimatic factors. For NEE values, negative values
repre-15
sent net carbon uptake, and positive values represent net carbon release. Delta values (∆NEE,∆GEP, ∆RE,∆ET, ∆α,∆GEP2000 and∆R) are estimated as their differences
between before and after each typhoon made landfall. For delta values, negative values indicate decrease following typhoon, positive values indicate increase after typhoon.
The residuals of NEE (NEEresidual) from light response function (Barr et al., 2010) 20
were regressed against VPD andTabefore and after typhoon to quantify the magnitude they regulate daytime NEE. A more positive NEEresidual indicates less photosynthesis
or more respiration. To quantify typhoon impacts on daily carbon and water fluxes, we then analyzed the regulatory characteristics of typhoon on them using data from 2009 to 2012 for YX and GQ.
25
2.5 Litterfall measurements
BGD
11, 9421–9449, 2014Typhoon impact on CO2flux of mangrove
ecosystem
H. Chen et al.
Title Page
Abstract Introduction
Conclusions References
Tables Figures
◭ ◮
◭ ◮
Back Close
Full Screen / Esc
Printer-friendly Version
Interactive Discussion
Discussion
P
a
per
|
Discus
sion
P
a
per
|
Discussion
P
a
per
|
Discussion
P
a
per
|
species around the eddy tower, with litter collected monthly, oven-dried, sorted and weighted as leaf, twig, flower and fruit (including hypocotyle).
2.6 Statistical analysis
Eddy covariance data were processed using software SAS version 9.0 (SAS Insti-tute Inc., USA). All measured parameters before and after typhoon were presented as
5
mean±standard deviation for seven replicates. The differences in microclimatic
fac-tors, carbon and water fluxes between before and after typhoon were tested using independent samplet test. The differences in daily carbon and water fluxes among ty-phoons were analyzed by one-way Analysis of Variance (ANOVA). Then Duncan post hoc tests were applied to examine the differences after ANOVA. The relationships
be-10
tween typhoon characteristics and microclimatic factors, carbon and water fluxes were also analyzed by linear regression. The statistical analyses were conducted with soft-ware SPSS version 16.0 (SPSS Inc., USA).
3 Results
3.1 Typhoons and microclimatic data
15
From 1945 to 2012, the annual typhoon initiation frequency was 25.27±6.10, and the
frequency of landfalls on China was 9.26±2.65. During 2009 and 2012, the typhoon
initiation and landfall frequency was not very high. There were three and one typhoon made landfall particularly near YX and GQ (Fig. 1a, Supplement Table S1). Among them the minimum distance from YX and GQ was 9 km and 29 km, respectively
(Sup-20
plement Table S1). Duration of each typhoon when it occurred at a distance less than 300 km from YX or GQ was 28.79±15.44 h, ranging from 9 to 74 h.
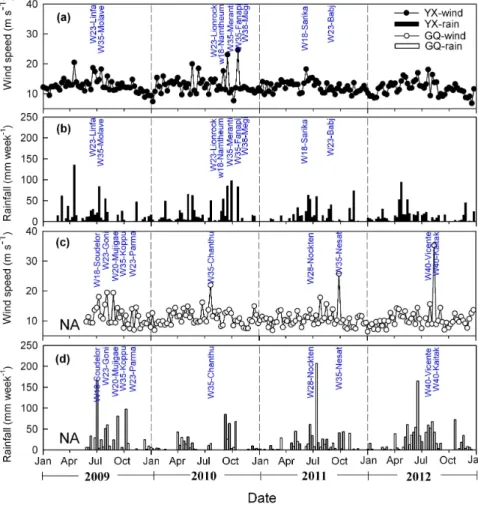
From June to October, typhoon brought strong wind accompanied with torrential rain (Fig. 2, Supplement Table S1). The monthly total rainfall showed significant correlation with monthly maximum wind speed for our study sites (P <0.001 for YX,P =0.017 for
BGD
11, 9421–9449, 2014Typhoon impact on CO2flux of mangrove
ecosystem
H. Chen et al.
Title Page
Abstract Introduction
Conclusions References
Tables Figures
◭ ◮
◭ ◮
Back Close
Full Screen / Esc
Printer-friendly Version
Interactive Discussion
Discussion
P
a
per
|
Discus
sion
P
a
per
|
Discussion
P
a
per
|
Discussion
P
a
per
|
GQ). During typhoon period, the strongest wind speed of typhoon reached 40 m s−1, and the strongest observed wind speed near our study site can exceed 35 m s−1. The magnitude of total rainfall during typhoon period ranged from 3 mm to 85.8 mm for YX, and from 0.2 mm to 115.8 mm for GQ during 2009 and 2012. Rainfall showed significant correlation with duration of typhoon for our study sites (P =0.014 for YX,
5
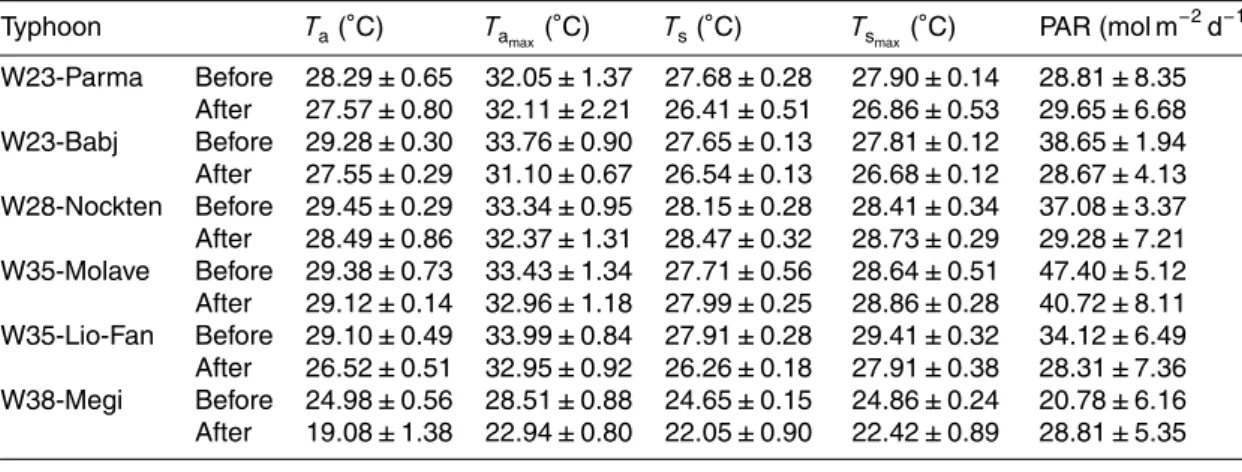
P =0.029 for GQ). Both daily mean and maximum Ta were significantly decreased after most of strong typhoon landfalls, while their variations were larger than that before typhoon (Table 1). The cooling effect of typhoon was less apparent in Ts, which led to smaller differences inTsandTs
max following typhoon. With a few exceptions, significant
decreases in daily mean total PAR were observed (Table 1).
10
3.2 Litterfall production
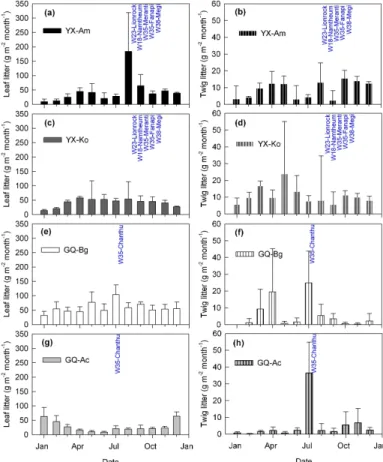
Mean annual litterfall production was 848.44 g m−2yr−1 and 728.62 g m−2yr−1 for YX and GQ from 2009 to 2012. Leaf and twig litter were the largest components of total litterfall, accounting for more than 75 % of total litterfall for our mangrove site. Except for leaf litter of A. corniculatum, monthly litterfall varied seasonally with two peaks,
15
one in April to May and the other in July to August (Fig. 3). Typhoon with strong wind and heavy rain could cause defoliation. In the typhoon season, the highest monthly litter production represented 30 % and 13 % of annual litterfall for YX and GQ. More-over, about 5 % to 25 % green leaves and twigs appeared in litter traps after typhoon made landfall. ForK. obovataat YX site, monthly twig litter production was significantly
20
correlated with monthly maximum wind speed (P =0.015) and monthly total rainfall (P =0.041). For B. gymnorrhiza at GQ site, monthly leaf litter production was signif-icantly correlated with monthly maximum wind speed (P =0.004), and monthly twig litter production also showed significant correlation with monthly maximum wind speed (P =0.001) and monthly total rainfall (P =0.005). ForA. corniculatumat GQ site, only
25
BGD
11, 9421–9449, 2014Typhoon impact on CO2flux of mangrove
ecosystem
H. Chen et al.
Title Page
Abstract Introduction
Conclusions References
Tables Figures
◭ ◮
◭ ◮
Back Close
Full Screen / Esc
Printer-friendly Version
Interactive Discussion
Discussion
P
a
per
|
Discus
sion
P
a
per
|
Discussion
P
a
per
|
Discussion
P
a
per
|
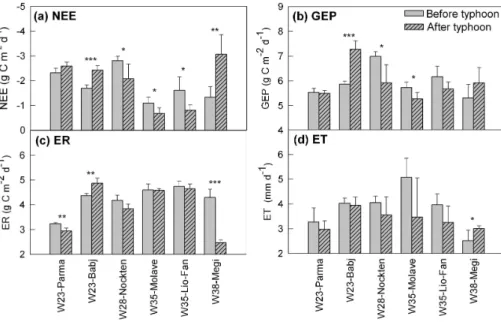
3.3 Net ecosystem CO2exchange
For typhoon effect on carbon and water flux values of mangrove ecosystems, only six strong typhoons that made significant changes on them were taken into account (Fig. 4). Daily total NEE values were reduced following typhoon W28-Nockten (26 %), W35-Molave (39 %) and W35-Lio-Fan (50 %), but were significantly increased following
5
typhoon W23-Parma (12 %), W23-Babj (43 %) and W38-Megi (131 %) (Fig. 4a). Daily total GEP values were all reduced significantly following typhoon W28-Nockten (15 %) and W35-Molave (8 %), but no change in daily total GEP was observed following the typhoon W23-Babj (Fig. 4b). Typhoon W23-Parma and W38-Megi significantly sup-pressed daily total RE values, but typhoon W23-Babj increased the daily RE (Fig. 4c).
10
Typhoon W23-Parma also reduced daily total ET after typhoon landfalls, but typhoon Parma caused the opposite (Fig. 4d).
Table 2 summarized light response curve parameters before and after strong ty-phoons made landfall near our study sites during the four year period between 2009 and 2012. The apparent quantum yields (α value) were slightly decreased following
15
typhoon, but there was no significant difference inαbefore and after each typhoon. Af-ter typhoon W38-Megi made landfall, GEP2000 value was smaller than before typhoon
values (P <0.001). Ecosystem respiration rate (theR value) before typhoon was more than twice the value after typhoon W38-Megi made landfall. However, after typhoon W23-Babj, GEP2000value was greater than before typhoon values (P =0.035).
20
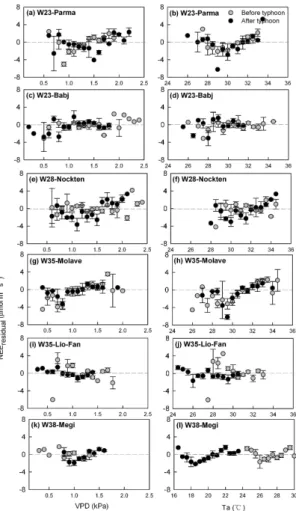
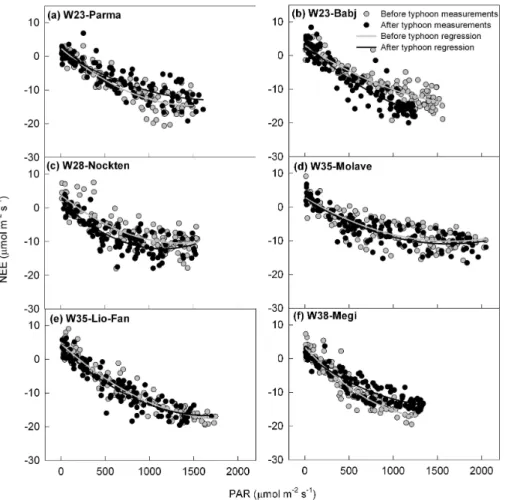
PAR was the most important control over daytime NEE, although VPD andTa also exerted strong controls over daytime NEE (Figs. 5 and 6). VPD above 1.5 kPa sup-pressed daytime NEE (Fig. 5a and e). After typhoon W28-Nockten landed, daytime NEE values were reduced by high VPD, while they were not been affected by VPD before the typhoon (Fig. 5e). Although highTaalso reduced daytime NEE values after
25
BGD
11, 9421–9449, 2014Typhoon impact on CO2flux of mangrove
ecosystem
H. Chen et al.
Title Page
Abstract Introduction
Conclusions References
Tables Figures
◭ ◮
◭ ◮
Back Close
Full Screen / Esc
Printer-friendly Version
Interactive Discussion
Discussion
P
a
per
|
Discus
sion
P
a
per
|
Discussion
P
a
per
|
Discussion
P
a
per
|
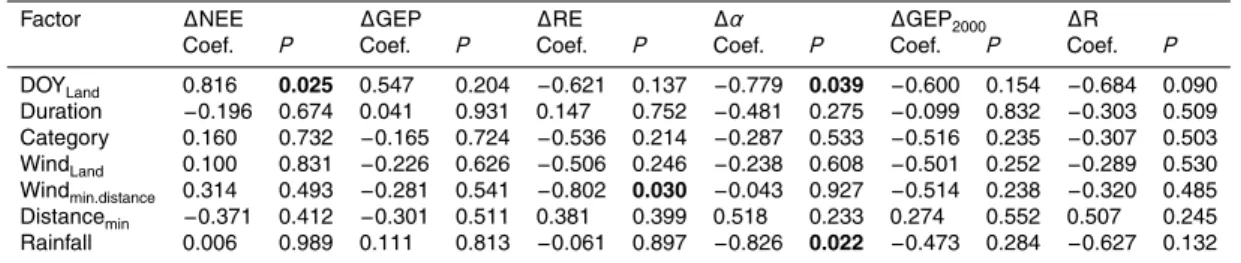
3.4 Relationships between carbon, water fluxes and typhoon properties
Variations in daily carbon fluxes and the model parameters were explained by variations in typhoon properties (Table 3). ∆GEP values did not show significant relationships with typhoon properties for YX and GQ. However,∆NEE values were strong correlated with DOYLand(P =0.025), indicating that typhoon made landfall later in the year could 5
increase daily NEE. ∆α values were negatively correlated with DOYLand (P =0.039)
and rainfall (P =0.022). And∆RE values were also negatively related to windmin.distance (P =0.030), showing that typhoon with strong wind led to lower daily RE.
4 Discussion
4.1 Impact of typhoons on defoliation of mangrove forests
10
We observed significant increase in litter production in both mangrove forests in China following most typhoon events (Fig. 3), suggesting great defoliation occurred due to typhoon disturbances. The immediate impacts of typhoon disturbance on canopy in-cluded defoliation and twig losses (Xu et al., 2004; Li et al., 2007; Ito, 2010), which led to obvious changes in LAI and albedo values (Barr et al., 2012; O’Halloran et al.,
15
2012). The positive relationship between monthly litter productions and monthly mean wind speed observed here for GQ (Fig. 3) also indicated a strong impact of wind distur-bance on defoliation. This is consistent with the results from several previous studies, which demonstrated higher monthly litter production during typhoon season (Tam et al., 1998; Zheng et al., 2000). Milbrandt et al. (2006) observed no significant differences of
20
in-BGD
11, 9421–9449, 2014Typhoon impact on CO2flux of mangrove
ecosystem
H. Chen et al.
Title Page
Abstract Introduction
Conclusions References
Tables Figures
◭ ◮
◭ ◮
Back Close
Full Screen / Esc
Printer-friendly Version
Interactive Discussion
Discussion
P
a
per
|
Discus
sion
P
a
per
|
Discussion
P
a
per
|
Discussion
P
a
per
|
creases in mangrove litter production following typhoon events are very common, and will increase ecosystem respiration and nutrient supplies for mangrove forest recovery.
4.2 Impacts of typhoons on mangrove daytime NEE
We found inconsistent changes in daytime NEE following typhoon events, with some typhoons (e.g. W23-Babj, W38-Megi) increasing daytime NEE, some typhoons
(W28-5
Nockten, W35-Molave, W35-Lio-Fan) having the opposite effect and one typhoon (W23-Parma) having no effect (Fig. 4). Ito (2010) observed that defoliation caused by typhoon greatly reduce CO2uptake of a deciduous broad-leaf forest. Li et al. (2007) also reported a decrease in GPP because of the reduction in LAI after hurricane distur-bance. In our study, after typhoon W28-Nockten, W35-Molave and W35-Lio-Fan made
10
landfall, the decreased magnitudes of GEP were larger than that of RE, which resulted in significant decrease in NEE. Although typhoon W38-Megi caused a reduction in GEP, the large reduction of RE resulted in increased NEE. Kwon et al. (2010) also reported that intensive rainfalls could reduce respiration during Asian monsoon. Diff er-ent variations and magnitudes of GEP and RE also controlled the NEE values after
15
typhoon W23-Parma and W23-Babj (Fig. 4). However, Barr et al. (2012) demonstrated that local heating effect following stand-replacing hurricane disturbances caused high respiration. Therefore, possible effects of typhoons on daytime NEE depend on for-est types, forfor-est locations and various changes in micromet conditions due to typhoon events.
20
VPD andTawere important secondary factors controlling daytime NEE values, espe-cially after typhoon made landfall (Fig. 5). The less negative GEP2000 values following
typhoon likely due to carbon assimilation suppressed by high VPD and Ta. Our results for VPD also have been reported in previous studies (Goulden et al., 2004; Powell et al., 2008; Keith et al., 2012). Daytime photosynthetic rates of leaves could be limited
25
de-BGD
11, 9421–9449, 2014Typhoon impact on CO2flux of mangrove
ecosystem
H. Chen et al.
Title Page
Abstract Introduction
Conclusions References
Tables Figures
◭ ◮
◭ ◮
Back Close
Full Screen / Esc
Printer-friendly Version
Interactive Discussion
Discussion
P
a
per
|
Discus
sion
P
a
per
|
Discussion
P
a
per
|
Discussion
P
a
per
|
pression in daytime NEE. This regulation can be explained by temperature controls on both photosynthesis and respiration (Powell et al., 2008). Goulden et al. (2004) also demonstrated positive correlation between NEEresidual and Ta in the afternoon, which
may cause by high Ta, high VPD, or a circadian rhythm.
4.3 Regulation mechanisms of typhoons on ecosystem carbon and water
5
fluxes in mangrove forests
Although many studies have examined extreme typhoon or hurricane disturbances im-pacts on CO2fluxes in various ecosystems, few have attempted to find the regulation
mechanisms of typhoon characteristics on mangrove carbon fluxes (Li et al., 2007; Ito, 2010; Sano et al., 2010; Barr et al., 2012; Vargas, 2012). Results from our
synthe-10
sis indicated variations of carbon fluxes following typhoon were strongly controlled by DOYLand, windmin.distance and rainfall (Table 3). Rainfall controls on RE was consistent with Kwon et al. (2010), who found intensive and consecutive rainfall reduced respi-ration during summer monsoon. Windmin.distance regulations on RE could be explained
by wind damage on canopy loss immediately after typhoon (Ito, 2010). Though we did
15
not measure the changes in leaf area following typhoon, the large litter production and their correlations between wind speed and rainfall during typhoon season confirmed the damage of typhoon on mangrove forest. These differ from findings of extreme dis-turbance, which stand-replacing damages cause significant large RE in a long term (Amiro et al., 2010; Barr et al., 2012). However, no difference in RE after typhoon
W28-20
Nockten, W28-Molave and W35-Lio-Fan observed in this study was consistent with Li et al. (2007) who found that less extreme disturbance did not increase respiration of forest ecosystem.
The variations of daily NEE before and after typhoon were complex, because NEE depends both on photosynthesis and respiration processes. They are interacted with
25
BGD
11, 9421–9449, 2014Typhoon impact on CO2flux of mangrove
ecosystem
H. Chen et al.
Title Page
Abstract Introduction
Conclusions References
Tables Figures
◭ ◮
◭ ◮
Back Close
Full Screen / Esc
Printer-friendly Version
Interactive Discussion
Discussion
P
a
per
|
Discus
sion
P
a
per
|
Discussion
P
a
per
|
Discussion
P
a
per
|
GEP and increase in RE of mangrove ecosystem (Barr et al., 2012). Reduced NEE values also have been reported by Lindroth et al. (2008), who observed the reduction of NEE were caused by increased RE. However, less extreme disturbances have negli-gible effects on NEE (Li et al., 2007). Hurricane disturbance have no significant effects on NEE due to the compensatory reduction in GEP and RE (Li et al., 2007). Actually,
5
there is great agreement with previous studies, who indicate climatic drivers on the bal-ance between carbon and uptake (Powell et al., 2008; Wen et al., 2010; Zhang et al., 2010). These indicated typhoon disturbances reduced NEE or do not have significant impact on our mangrove study sites. However, our study also observed significant in-crease in NEE after typhoon W38-Megi in early autumn, which was due to dein-crease
10
inTa and RE. In this case, the strong correlation between∆NEE values and DOYLand conformed that the timing of typhoon made landfall was also very important control on carbon exchange of mangrove ecosystems. Though only six typhoons caused sig-nificant changes in carbon flux of mangrove ecosystem, these results indicated that carbon flux dynamics were highly variable following typhoon.
15
5 Conclusions
Typhoon disturbances frequently influenced the subtropical mangrove ecosystems in China. Strong wind and intensive rainfall caused defoliation and local cooling effect dur-ing typhoon periods. The magnitudes and trends of daily NEE responses were highly variable following different typhoons, which were dependent of the balance between
20
the variances of GEP and RE. Furthermore, results from our synthesis of 19 typhoons demonstrated that DOYLand, windmin.distance and rainfall were the most important
fac-tors controlling the carbon fluxes following typhoon. These findings not only indicated that mangrove ecosystems have strong resilience to typhoon disturbances, but also demonstrated the damage of increased typhoon intensity and frequency on
subtropi-25
BGD
11, 9421–9449, 2014Typhoon impact on CO2flux of mangrove
ecosystem
H. Chen et al.
Title Page
Abstract Introduction
Conclusions References
Tables Figures
◭ ◮
◭ ◮
Back Close
Full Screen / Esc
Printer-friendly Version
Interactive Discussion
Discussion
P
a
per
|
Discus
sion
P
a
per
|
Discussion
P
a
per
|
Discussion
P
a
per
|
The Supplement related to this article is available online at doi:10.5194/bgd-11-9421-2014-supplement.
Acknowledgements. This study was supported financially by the National Natural Science Foundation of China (30930017) and the National Basic Research Program of China (2013CB956601). We thank the Zhangjiang and Zhanjiang Mangrove National Nature Reserve 5
for allowing the study in the field. We appreciated Jiquan Chen, Bin Zhao, Haiqiang Guo, Dan Yakir for their help with eddy tower construction and flux data processing. We also thank Yihui Zhang, Luzhen Chen, Jingfeng Xiao, Wenjiao Zheng, Yue-Joe Hsia for their valuable sugges-tions on our earlier version of the manuscript.
References
10
Alongi, D. M.: Present state and future of the world’s mangrove forests, Environ. Conserv., 29, 331–349, doi:10.1017/s0376892902000231, 2002.
Alongi, D. M.: Mangrove forests: resilience, protection from tsunamis, and responses to global climate change, Estuar. Coast. Shelf S., 76, 1–13, doi:10.1016/j.ecss.2007.08.024, 2008. Alongi, D. M.: The Energetics of Mangrove Forests, Springer, Dordrecht, 2009.
15
Amiro, B. D., Barr, A. G., Barr, J. G., Black, T. A., Bracho, R., Brown, M., Chen, J., Clark, K. L., Davis, K. J., and Desai, A. R.: Ecosystem carbon dioxide fluxes after disturbance in forests of North America, J. Geophys. Res., 115, G00K02, doi:10.1029/2010jg001390, 2010. Baldocchi, D.: “Breathing” of the terrestrial biosphere: lessons learned from a global network
of carbon dioxide flux measurement systems, Aust. J. Bot., 56, 1–26, doi:10.1071/bt07151, 20
2008.
Barr, J. G., Engel, V., Fuentes, J. D., Zieman, J. C., O’Halloran, T. L., Smith III, T. J., and An-derson, G. H.: Controls on mangrove forest-atmosphere carbon dioxide exchanges in west-ern Everglades National Park, J. Geophys. Res., 115, G02020, doi:10.1029/2009jg001186, 2010.
25
BGD
11, 9421–9449, 2014Typhoon impact on CO2flux of mangrove
ecosystem
H. Chen et al.
Title Page
Abstract Introduction
Conclusions References
Tables Figures
◭ ◮
◭ ◮
Back Close
Full Screen / Esc
Printer-friendly Version
Interactive Discussion
Discussion
P
a
per
|
Discus
sion
P
a
per
|
Discussion
P
a
per
|
Discussion
P
a
per
|
Bouillon, S., Borges, A. V., Castañeda-Moya, E., Diele, K., Dittmar, T., Duke, N. C., Kris-tensen, E., Lee, S. Y., Marchand, C., and Middelburg, J. J.: Mangrove production and car-bon sinks: a revision of global budget estimates, Global Biogeochem. Cy., 22, GB2013, doi:10.1029/2007gb003052, 2008a.
Bouillon, S., Connolly, R. M., and Lee, S. Y.: Organic matter exchange and cycling in man-5
grove ecosystems: recent insights from stable isotope studies, J. Sea Res., 59, 44–58, doi:10.1016/j.seares.2007.05.001, 2008b.
Burba, G. G., Anderson, D. J., Xu, L., and McDermitt, D. K.: Correcting apparent off-season CO2 uptake due to surface heating of an open path gas analyzer: progress report of an ongoing study, 27th Confercence on Agricultural and Forest Meteorology, P4.4, San Diego, 10
California, 24 May 2006, 2006.
Chen, L. Z., Wang, W. Q., Zhang, Y. H., and Lin, G. H.: Recent progresses in man-grove conservation, restoration and research in China, J. Plant Ecol.-UK, 2, 45–54, doi:10.1093/jpe/rtp009, 2009.
Donato, D. C., Kauffman, J. B., Murdiyarso, D., Kurnianto, S., Stidham, M., and Kanninen, M.: 15
Mangroves among the most carbon-rich forests in the tropics, Nat. Geosci., 4, 293–297, doi:10.1038/ngeo1123, 2011.
Dietze, M. and Clark, J. S.: Changing the gap dynamics paradigm: vegetative regeneration con-trol on forest response to disturbance, Ecol. Monogr., 78, 331–347, doi:10.1890/07-0271.1, 2007.
20
Duke, N. C., Meynecke, J. O., Dittmann, S., Ellison, A. M., Anger, K., Berger, U., Cannicci, S., Diele, K., Ewel, K. C., and Field, C. D.: A world without mangroves?, Science, 317, 41–42, doi:10.1126/science.317.5834.41b, 2007.
Emanuel, K.: Environmental factors affecting tropical cyclone power dissipation, J. Climate, 20, 5497–5509, doi:10.1175/2007jcli1571.1, 2007.
25
Falge, E., Baldocchi, D., Olson, R., Anthoni, P., Aubinet, M., Bernhofer, C., Burba, G., Ceule-mans, R., Clement, R., and Dolman, H.: Gap filling strategies for long term energy flux data sets, Agr. Forest Meteorol., 107, 71–77, doi:10.1016/S0168-1923(00)00235-5, 2001. Gilbert, A. J. and Janssen, R.: Use of environmental functions to communicate the values of
a mangrove ecosystem under different management regimes, Ecol. Econ., 25, 323–346, 30
BGD
11, 9421–9449, 2014Typhoon impact on CO2flux of mangrove
ecosystem
H. Chen et al.
Title Page
Abstract Introduction
Conclusions References
Tables Figures
◭ ◮
◭ ◮
Back Close
Full Screen / Esc
Printer-friendly Version
Interactive Discussion
Discussion
P
a
per
|
Discus
sion
P
a
per
|
Discussion
P
a
per
|
Discussion
P
a
per
|
Gilman, E. L., Ellison, J., Duke, N. C., and Field, C.: Threats to mangroves from climate change and adaptation options: a review, Aquat. Bot., 89, 237–250, doi:10.1016/j.aquabot.2007.12.009, 2008.
Goulden, M. L., Miller, S. D., Da Rocha, H. R., Menton, M. C., de Freitas, H. C., de Silva Figueira, A. M., and de Sousa, C. A. D.: Diel and seasonal patterns of tropical forest CO2 5
exchange, Ecol. Appl., 14, S42–S54, doi:10.1890/02-6008, 2004.
Greening, H., Doering, P., and Corbett, C.: Hurricane impacts on coastal ecosystems, Estuar. Coast., 29, 877–879, doi:10.1007/bf02798646, 2006.
IPCC: Fourth Assessment Report (AR4 SYR Summary for Policymakers), Cambridge Univer-sity Press, Washington, 2007.
10
Ito, A.: Evaluation of the impacts of defoliation by tropical cyclones on a Japanese forest’s carbon budget using flux data and a process-based model, J. Geophys. Res., 115, G04013, doi:10.1029/2010jg001314, 2010.
Keith, H., van Gorsel, E., Jacobsen, K., and Cleugh, H.: Dynamics of carbon exchange in a Eucalyptus forest in response to interacting disturbance factors, Agr. Forest Meteorol., 15
153, 67–81, doi:10.1016/j.agrformet.2011.07.019, 2012.
Knutson, T. R., McBride, J. L., Chan, J., Emanuel, K., Holland, G., Landsea, C., Held, I., Kossin, J. P., Srivastava, A., and Sugi, M.: Tropical cyclones and climate change, Nat. Geosci., 3, 157–163, doi:10.1038/ngeo779, 2010.
Kovacs, J. M., Malczewski, J., and Flores-Verdugo, F.: Examining local ecological knowledge 20
of hurricane impacts in a mangrove forest using an analytical hierarchy process (AHP) ap-proach, J. Coastal Res., 20, 792–800, doi:10.2112/1551-5036(2004)20[792:elekoh]2.0.co;2, 2004.
Kristensen, E., Bouillon, S., Dittmar, T., and Marchand, C.: Organic carbon dynamics in man-grove ecosystems: a review, Aquat. Bot., 89, 201–219, doi:10.1016/j.aquabot.2007.12.005, 25
2008.
Kwon, H., Kim, J., Hong, J., and Lim, J.-H.: Influence of the Asian monsoon on net ecosys-tem carbon exchange in two major ecosysecosys-tems in Korea, Biogeosciences, 7, 1493–1504, doi:10.5194/bg-7-1493-2010, 2010.
Li, J. H., Powell, T. L., Seiler, T. J., Johnson, D. P., Anderson, H. P., Bracho, R., Hungate, B. A., 30
BGD
11, 9421–9449, 2014Typhoon impact on CO2flux of mangrove
ecosystem
H. Chen et al.
Title Page
Abstract Introduction
Conclusions References
Tables Figures
◭ ◮
◭ ◮
Back Close
Full Screen / Esc
Printer-friendly Version
Interactive Discussion
Discussion
P
a
per
|
Discus
sion
P
a
per
|
Discussion
P
a
per
|
Discussion
P
a
per
|
Lindroth, A., Lagergren, F., Grelle, A., Klemedtsson, L., Langvall, O., Weslien, P., and Tuulik, J.: Storms can cause Europe-wide reduction in forest carbon sink, Glob. Change Biol., 15, 346– 355, doi:10.1111/j.1365-2486.2008.01719.x, 2008.
Mauder, M. and Foken, T.: Impact of post-field data processing on eddy covariance flux estimates and energy balance closure, Meteorol. Z., 15, 597–609, doi:10.1127/0941-5
2948/2006/0167, 2006.
Milbrandt, E. C., Greenawalt-Boswell, J. M., Sokoloff, P. D., and Bortone, S. A.: Impact and response of southwest Florida mangroves to the 2004 hurricane season, Estuar. Coast., 29, 979–984, doi:10.1007/bf02798659, 2006.
Noormets, A., Chen, J., and Crow, T. R.: Age-dependent changes in ecosystem car-10
bon fluxes in managed forests in northern Wisconsin, USA, Ecosystems, 10, 187–203, doi:10.1007/s10021-007-9018-y, 2007.
O’Halloran, T. L., Law, B. E., Goulden, M. L., Wang, Z., Barr, J. G., Schaaf, C., Brown, M., Fuentes, J. D., Göckede, M., and Black, A.: Radiative forcing of natural forest disturbances, Glob. Change Biol., 18, 555–565, doi:10.1111/j.1365-2486.2011.02577.x, 2012.
15
Ostertag, R., Scatena, F. N., and Silver, W. L.: Forest floor decomposition following hurricane litter inputs in several Puerto Rican forests, Ecosystems, 6, 261–273, doi:10.1007/s10021-002-0203-8, 2003.
Paw U, K. T., Baldocchi, D. D., Meyers, T. P., and Wilson, K. B.: Correction of eddy-covariance measurements incorporating both advective effects and density fluxes, Bound.-Lay. Meteo-20
rol., 97, 487–511, doi:10.1023/a:1002786702909, 2000.
Powell, T. L., Gholz, H. L., Clark, K. L., Starr, G., Cropper, W. P., and Martin, T. A.: Carbon exchange of a mature, naturally regenerated pine forest in north Florida, Glob. Change Biol., 14, 2523–2538, doi:10.1111/j.1365-2486.2008.01675.x, 2008.
Running, S. W.: Ecosystem disturbance, carbon, and climate, Science, 321, 652–653, 25
doi:10.1126/science.1159607, 2008.
Sano, T., Hirano, T., Liang, N., Hirata, R., and Fujinuma, Y.: Carbon dioxide exchange of a larch forest after a typhoon disturbance, Forest Ecol. Manag., 260, 2214–2223, doi:10.1016/j.foreco.2010.09.026, 2010.
Tam, N. F. Y., Wong, Y. S., Lan, C. Y., and Wang, L. N.: Litter production and decomposition 30
BGD
11, 9421–9449, 2014Typhoon impact on CO2flux of mangrove
ecosystem
H. Chen et al.
Title Page
Abstract Introduction
Conclusions References
Tables Figures
◭ ◮
◭ ◮
Back Close
Full Screen / Esc
Printer-friendly Version
Interactive Discussion
Discussion
P
a
per
|
Discus
sion
P
a
per
|
Discussion
P
a
per
|
Discussion
P
a
per
|
Tomlinson, P. B.: The Botany of Mangroves, Cambridge University Press, New York, USA, 1986.
Turner, M. G. and Dale, V. H.: Comparing large, infrequent disturbances: what have we learned?, Ecosystems, 1, 493–496, doi:10.1007/s100219900045, 1998.
Valentini, R., Matteucci, G., Dolman, A., Schulze, E. D., Rebmann, C., Moors, E., Granier, A., 5
Gross, P., Jensen, N., and Pilegaard, K.: Respiration as the main determinant of carbon balance in European forests, Nature, 404, 861–865, doi:10.1038/35009084, 2000.
Vargas, R.: How a hurricane disturbance influences extreme CO2fluxes and variance in a trop-ical forest, Environ. Res. Lett., 7, 035704, doi:10.1088/1748-9326/7/3/035704, 2012. Webster, P. J., Holland, G. J., Curry, J. A., and Chang, H. R.: Changes in tropical cy-10
clone number, duration, and intensity in a warming environment, Science, 309, 1844–1846, doi:10.1126/science.1116448, 2005.
Wen, X.-F., Wang, H.-M., Wang, J.-L., Yu, G.-R., and Sun, X.-M.: Ecosystem carbon exchanges of a subtropical evergreen coniferous plantation subjected to seasonal drought, 2003–2007, Biogeosciences, 7, 357–369, doi:10.5194/bg-7-357-2010, 2010.
15
Xu, X. N., Hirata, E., Enoki, T., and Tokashiki, Y.: Leaf litter decomposition and nutrient dynamics in a subtropical forest after typhoon disturbance, Plant Ecol., 173, 161–170, doi:10.1023/b:vege.0000029319.05980.70, 2004.
Zhang, Y. P., Tan, Z. H., Song, Q. H., Yu, G. R., and Sun, X. M.: Respiration controls the unexpected seasonal pattern of carbon flux in an Asian tropical rain forest, Atmos. Environ., 20
44, 3886–3893, doi:10.1016/j.atmosenv.2010.07.027, 2010.
BGD
11, 9421–9449, 2014Typhoon impact on CO2flux of mangrove
ecosystem
H. Chen et al.
Title Page
Abstract Introduction
Conclusions References
Tables Figures
◭ ◮
◭ ◮
Back Close
Full Screen / Esc
Printer-friendly Version
Interactive Discussion
Discussion
P
a
per
|
Discus
sion
P
a
per
|
Discussion
P
a
per
|
Discussion
P
a
per
|
Table 1.Daily average microclimatic factors before and after typhoon made landfall for Yunxiao (YX) and Gaoqiao (GQ) in 2010, including daily means of air temperature (Ta), maximum air temperature (Ta
max), soil temperature (Ts), maximum soil temperature (Tsmax) and total
photosyn-thetically active radiation (PAR).
Typhoon Ta(◦C) T amax(
◦C) T
s(◦C) Tsmax(
◦C) PAR (mol m−2
d−1
)
W23-Parma Before 28.29±0.65 32.05±1.37 27.68±0.28 27.90±0.14 28.81±8.35
After 27.57±0.80 32.11±2.21 26.41±0.51 26.86±0.53 29.65±6.68
W23-Babj Before 29.28±0.30 33.76±0.90 27.65±0.13 27.81±0.12 38.65±1.94
After 27.55±0.29 31.10±0.67 26.54±0.13 26.68±0.12 28.67±4.13
W28-Nockten Before 29.45±0.29 33.34±0.95 28.15±0.28 28.41±0.34 37.08±3.37 After 28.49±0.86 32.37±1.31 28.47±0.32 28.73±0.29 29.28±7.21 W35-Molave Before 29.38±0.73 33.43±1.34 27.71±0.56 28.64±0.51 47.40±5.12 After 29.12±0.14 32.96±1.18 27.99±0.25 28.86±0.28 40.72±8.11
W35-Lio-Fan Before 29.10±0.49 33.99±0.84 27.91±0.28 29.41±0.32 34.12±6.49
After 26.52±0.51 32.95±0.92 26.26±0.18 27.91±0.38 28.31±7.36
W38-Megi Before 24.98±0.56 28.51±0.88 24.65±0.15 24.86±0.24 20.78±6.16
BGD
11, 9421–9449, 2014Typhoon impact on CO2flux of mangrove
ecosystem
H. Chen et al.
Title Page
Abstract Introduction
Conclusions References
Tables Figures
◭ ◮
◭ ◮
Back Close
Full Screen / Esc
Printer-friendly Version
Interactive Discussion
Discussion
P
a
per
|
Discus
sion
P
a
per
|
Discussion
P
a
per
|
Discussion
P
a
per
|
Table 2. Model parameters of light response curves before and after each typhoon landfall during 2009 and 2012.αis the apparent quantum yield, GEP2000 indicates the maximum net ecosystem CO2 exchange when photosynthetically active radiation reach 2000 µmol m−2
s−1 , Rrepresents dark ecosystem respiration.
Typhoon α GEP2000 R
BGD
11, 9421–9449, 2014Typhoon impact on CO2flux of mangrove
ecosystem
H. Chen et al.
Title Page
Abstract Introduction
Conclusions References
Tables Figures
◭ ◮
◭ ◮
Back Close
Full Screen / Esc
Printer-friendly Version
Interactive Discussion
Discussion
P
a
per
|
Discus
sion
P
a
per
|
Discussion
P
a
per
|
Discussion
P
a
per
|
Table 3. Linear regression coefficient (Coef.) and significance probability (P) between daily ecosystem carbon fluxes change (∆NEE,∆GEP and∆RE), model parameters change of light response curves (∆α,∆GEP2000and∆R) before and after typhoon made landfall and typhoon characteristics (DOYLand, duration, category, windLand, windmin.distance, distancemin, rainfall). The daily data from 2009 to 2012 for Yunxiao (YX) and Gaoqiao (GQ) were used. Thepvalue less than 0.05 was marked as bold number.
Factor ∆NEE ∆GEP ∆RE ∆α ∆GEP2000 ∆R
Coef. P Coef. P Coef. P Coef. P Coef. P Coef. P
DOYLand 0.816 0.025 0.547 0.204 −0.621 0.137 −0.779 0.039 −0.600 0.154 −0.684 0.090
Duration −0.196 0.674 0.041 0.931 0.147 0.752 −0.481 0.275 −0.099 0.832 −0.303 0.509 Category 0.160 0.732 −0.165 0.724 −0.536 0.214 −0.287 0.533 −0.516 0.235 −0.307 0.503 WindLand 0.100 0.831 −0.226 0.626 −0.506 0.246 −0.238 0.608 −0.501 0.252 −0.289 0.530
Windmin.distance 0.314 0.493 −0.281 0.541 −0.802 0.030 −0.043 0.927 −0.514 0.238 −0.320 0.485
Distancemin −0.371 0.412 −0.301 0.511 0.381 0.399 0.518 0.233 0.274 0.552 0.507 0.245
BGD
11, 9421–9449, 2014Typhoon impact on CO2flux of mangrove
ecosystem
H. Chen et al.
Title Page
Abstract Introduction
Conclusions References
Tables Figures
◭ ◮
◭ ◮
Back Close
Full Screen / Esc
Printer-friendly Version
Interactive Discussion
Discussion
P
a
per
|
Discus
sion
P
a
per
|
Discussion
P
a
per
|
Discussion
P
a
per
|