Submitted13 May 2016 Accepted 3 August 2016 Published6 September 2016
Corresponding author
Kyle Dexter, [email protected]
Academic editor Gabriele Sorci
Additional Information and Declarations can be found on page 10
DOI10.7717/peerj.2402
Copyright 2016 Dexter and Chave
Distributed under
Creative Commons CC-BY 4.0
OPEN ACCESS
Evolutionary patterns of range size,
abundance and species richness in
Amazonian angiosperm trees
Kyle Dexter1,2and Jérôme Chave3
1School of GeoSciences, University of Edinburgh, Edinburgh, United Kingdom 2Royal Botanic Garden Edinburgh, Edinburgh, United Kingdom
3Laboratoire Evolution et Diversité Biologique, Centre National de la Recherche Scientifique, Toulouse, France
ABSTRACT
Amazonian tree species vary enormously in their total abundance and range size, while Amazonian tree genera vary greatly in species richness. The drivers of this variation are not well understood. Here, we construct a phylogenetic hypothesis that represents half of Amazonian tree genera in order to contribute to explaining the variation. We find several clear, broad-scale patterns. Firstly, there is significant phylogenetic signal for all three characteristics; closely related genera tend to have similar numbers of species and similar mean range size and abundance. Additionally, the species richness of genera shows a significant, negative relationship with the mean range size and abundance of their constituent species. Our results suggest that phylogenetically correlated intrinsic factors, namely traits of the genera themselves, shape among lineage variation in range size, abundance and species richness. We postulate that tree stature may be one particularly relevant trait. However, other traits may also be relevant, and our study reinforces the need for ambitious compilations of trait data for Amazonian trees. In the meantime, our study shows how large-scale phylogenies can help to elucidate, and contribute to explaining, macroecological and macroevolutionary patterns in hyperdiverse, yet poorly understood regions like the Amazon Basin.
SubjectsBiodiversity, Ecology, Evolutionary Studies, Plant Science
Keywords Diversification, Trees, Range size, Hyperdominance, Phylogenetic signal, Amazon, Angiosperm phylogeny, Speciation, Tropical, Macroecology
INTRODUCTION
Variation in the abundance of tree species at the community level is evident in any forest and has been studied in tropical forests since at least 1979 (Hubbell, 1979). However, only relatively recently has sufficient taxonomic and forest inventory work been carried out at sufficiently large spatial scales (>1,000 km) to explore patterns of dominance across the Amazon; the results have shown conclusively that certain tree species dominate at large spatial scales as well (Pitman et al., 2001;Ter Steege et al., 2013;Ter Steege et al., 2015). Neutral ecological models where species drift randomly in abundance over time can generate variation in abundance, but they fail to explain the consistent dominance of some tree species across the Amazon (Hubbell, 2001;Condit et al., 2002). This begs the question of which characteristics or traits allow certain tree species to dominate, but the absence of adequate trait datasets has limited attempts to answer this question. There are two large-scale databases available that provide reasonable coverage of Amazonian tree species, for wood density and seed mass (Zanne et al., 2009;Royal Botanic Gardens Kew, 2016), but these two traits do not appear to be related to tree abundance in the Amazon (Ter Steege et al., 2013;Ter Steege et al., 2015). At smaller spatial scales, tree height has been shown to be positively correlated with abundance (Pitman et al., 2001;Arellano et al., 2015), but it is unclear if this pattern holds at the scale of the entire Amazon Basin.
There has been less progress in studying variation in the range size of Amazonian trees, in large part because many areas of the Amazon remain poorly known by botanical scientists. In 1999, Pitman and colleagues noted that ‘‘not a single tree species distribution in the Amazon basin has been reliably mapped’’ (Pitman et al., 1999), and this remains the case. Nevertheless, with some simplifying assumptions, Feeley & Silman (2009)succeeded in providing a first estimate of the range size of thousands of Amazonian plant species. These authors documented substantial variation in the range size of Amazonian tree species, but, given their focus on conservation, they did not attempt to explain this variation, and neither has any subsequent study. Range size has been shown to be positively related to the total abundance of tree species in the Amazon (Ter Steege et al., 2013), but the arrow of causality probably goes in the reverse direction (i.e., tree species with larger ranges can achieve greater total abundance). Meanwhile, studies of a more limited taxonomic scope have shown that range size in Amazonian palm tree species (Arecaceae) is positively related to their height (Ruokolainen et al., 2002;Kristiansen et al., 2009). Whether this pattern holds for dicotyledenous Amazonian trees is unknown, and whether other tree traits are related to range size remains to be explored.
Lastly, while variation in the species richness of tree genera in the Amazon has been noted (e.g.,Bermingham & Dick, 2001), it has received surprisingly little research attention
compared to the extensive efforts directed toward understanding the extraordinarytotal
tree species richness of the Amazon (Prance, 1982;Hoorn et al., 2010).Baker et al. (2014)
represents a landmark in this regard, as the authors focused on explaining variation in
species richnessamongst 51 Amazonian tree lineages (primarily genera). The authors
had more species. Meanwhile, they did not find a relationship of species richness with dispersal syndrome, breeding system or tree height. The negative results in this study may be best considered as preliminary however, given that the study covered only 51 tree genera
(among 100s in the Amazon) and only trees ≥10 cm diameter at breast height (1.3 m
above the ground), which was the minimum size threshold for sampling trees in the forest inventory plots used to estimate turnover times.
Acquiring sufficient trait data to thoroughly evaluate the drivers of variation in the abundance, range size and species richness of Amazonian tree lineages will require many costly field campaigns that will likely take multiple decades to complete. In the meantime, alternative approaches should be pursued. One fundamental question is whether intrinsic or extrinsic factors are more important. To the degree that intrinsic factors or traits (e.g., tree height or dispersal syndrome) show phylogenetic signal (cf.Freckleton, Harvey & Pagel, 2002;Blomberg, Garland & Ives, 2003), large-scale phylogenies could be used to test the role of intrinsic factors in driving variation in abundance, range size and species richness. If closely related lineages tend to have similar abundance, range size and species richness, then phylogenetically correlated traits are likely to be important drivers of variation in these characteristics. It is improbable that extrinsic factors would generate phylogenetic signal for abundance, range size or species richness within a given biogeographic region. Recent advances in the generation of sequence data for large numbers of Amazonian tree genera (e.g., Baraloto et al., 2012) mean that phylogenetic approaches are now feasible. Here, we generate a temporally-calibrated phylogenetic hypothesis that includes half of all Amazonian tree genera. We use this genus-level phylogeny to assess if there is phylogenetic signal for the mean range size, mean abundance and species richness of genera, with the aim of testing the importance of intrinsic traits of genera in driving macroecological and macroevolutionary patterns in Amazonian trees.
METHODS
We intersected a list of all Neotropical tree genera (from http://ctfs.si.edu/webatlas/
neotropicaltree/) with a list of Amazonian plant species (Feeley & Silman, 2009) in order to
generate a list of Amazonian tree species. TheFeeley & Silman (2009)dataset additionally includes estimates of range size for all species. We obtained estimates for the total abundance of Amazonian tree species fromTer Steege et al. (2013).
We obtained sequences of therbcLplastid gene for 631 Amazonian angiosperm tree
genera (Table S1), with 567 sequences coming from Genbank (www.ncbi.nlm.nih.gov/
genbank/) and an additional 64 genera being newly sequenced following protocols outlined
inBaraloto et al. (2012). We obtained sequences of thematK plastid gene from Genbank for 452 of the 631 genera withrbcLdata (Table S1). Sequences were aligned using the MAFFT software (Katoh & Standley, 2013). ‘Ragged ends’ of the sequences that were missing data for most genera were manually deleted from the alignment. Preliminary phylogenetic analyses allowed us to exclude sequences from GenBank for genera that were phylogenetically placed in a different family to that which they are thought to belong
We estimated a maximum likelihood phylogeny for the genera in RAxML v8.0.0 (Stamatakis, Hoover & Rougemont, 2008), on the CIPRES web server (www.phylo.org). We
used the default settings, including a General Time Reversible (GTR)+Gamma (G) model
of sequence evolution, with separate models for therbcLandmatK genes (i.e., a partitioned
analysis). We included sequences ofAmborella trichopoda(Amborellaceae) andNymphaea
alba (Nymphaeaceae) as outgroups. This phylogeny (see Supplemental Information)
was used as a starting tree for simultaneous topology and divergence time estimation in
the software BEAST v1.82 (Drummond & Rambaut, 2007). We implemented fossil-based
age constraints for 25 nodes distributed across the phylogeny, using log-normal prior
distributions with an offset to impose a hard minimum age (seeTable S2). We used a GTR
+G model of sequence evolution, with separate models for therbcLandmatK genes, an
uncorrelated relaxed lognormal clock, and a birth-death model for the speciation process. We conducted several preliminary runs to optimise the tuning and weight of parameters as per recommendations generated by the software. Once parameter optimisation stabilised, we ran two separate chains for 100 million generations. The first 50 million generations of each chain were discarded as ‘‘burn-in,’’ as the posterior probability of the phylogeny did not stabilise until this point. We combined the post burn-in posterior distributions of parameters and confirmed that effective sample size (ESS) values exceeded 100 for all parameters. We then used the phyutility software (Smith & Dunn, 2008) to generate an all-compatible consensus tree from the combined post burn-in posterior distribution of trees. Node ages were optimised onto this consensus phylogeny as the median value for a given node across all trees in the posterior distribution that contained the node (using the
TreeAnnotator software,Drummond & Rambaut, 2007).
For each genus in the phylogeny, we calculated the mean range size and abundance for all constituent species in theFeeley & Silman (2009)andTer Steege et al. (2013)datasets. Of the 631 genera in the phylogeny, 493 had an abundance estimate for at least one species inTer Steege et al. (2013). We considered the number of species for each genus in theFeeley & Silman (2009)dataset as an estimate of the species richness of that genus in the Amazon. As an alternative estimate, we used the Neotropical species richness estimates for genera inGentry (1993), which produced highly similar results. We assessed correlations amongst these genus-level characteristics using Pearson’s correlation coefficients for both the raw values and for their phylogenetically independent contrasts.
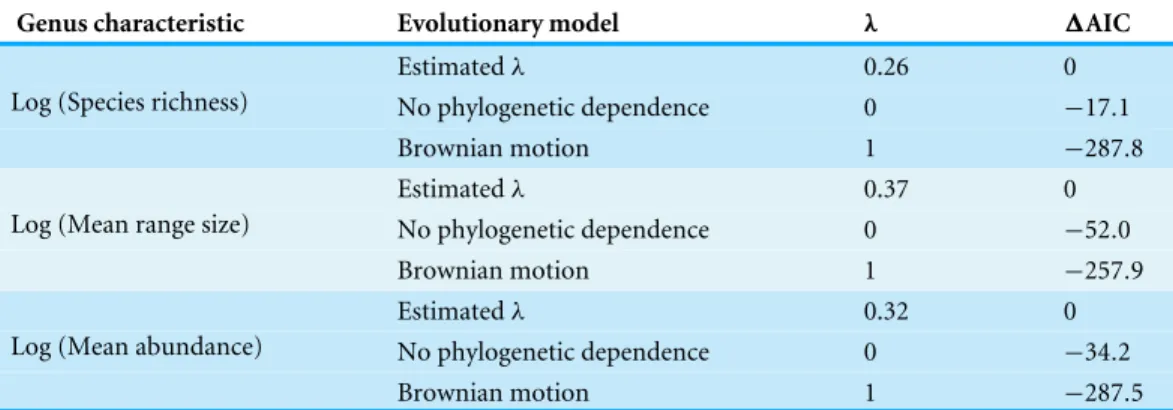
We tested for phylogenetic signal for each of these genus-level characteristics using Pagel’sλ(Freckleton, Harvey & Pagel, 2002). Under Brownian motion evolution, where trait values drift randomly over evolutionary time and where the phylogenetic relationships of taxa perfectly predict the covariance among taxa for trait values, the expected value of λis one. When the phylogenetic relationships of taxa do not predict the covariance at all,
the expected value ofλis zero. We compared the fit of different values forλ(one, zero and the maximum likelihood estimate) using the Akaike information criterion (AIC).
randomised the tips of the phylogeny 1,000 times, reconstructed ancestral values at nodes each time, and compared the observed reconstructed value to that across the randomisations. If the observed value for a node was greater than that in 97.5% of the randomisations, we considered the lineage descending from that node to show significantly high values for the trait, while if the observed value was lower than 2.5% of the randomisations, we considered the lineage to show significantly low values.
In order to assess whether major clades (Magnoliids, Monocots, Rosids and Asterids) differ in the species richness and mean range size and abundance of their constituent genera, we used analyses of variance with major clade as the grouping variable. In order to determine which clades may be driving significant results, we used Tukey’s tests. All analyses were conducted, and figures constructed, in the R Statistical Software (R Core Development Team, 2016) using functions in the ape (Paradis, 2016), geiger (Harmon et al., 2016) and phytools (Revell, 2016) packages (seeSupplemental Informationfor codes).
RESULTS
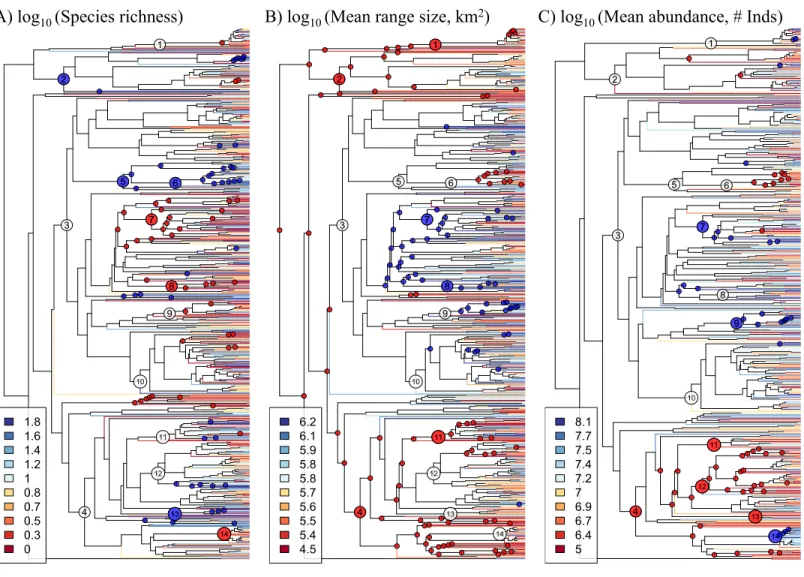
The phylogeny derived from the DNA sequence dataset that we compiled spans from the Magnoliids to the Asterids, thus encompassing all major clades of angiosperms (Fig. 1;
seeSupplemental Informationfor newick-formatted tree file). The 64rbcLsequences that
were generated as part of this study represent∼10% of the genera in the phylogeny, and they therefore represent a valuable contribution to our understanding of the evolutionary relationships of Amazonian tree genera. Most orders and families were monophyletic in the phylogeny with the notable (previously known) exceptions of Olacaceae and Icacinaceae, while the large-scale phylogenetic relationships are largely in agreement with those from recent, angiosperm-wide phylogenetic analyses (e.g.,Magallón et al., 2015).
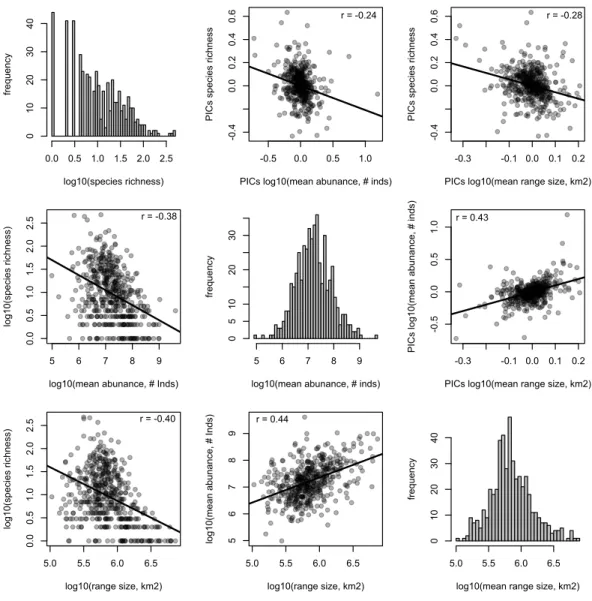
The species richness of genera is negatively correlated with mean range size (r= −0.40,
p<0.001) and mean abundance (r= −0.38,p<0.001). These relationships are weaker, but still significant, when using phylogenetically independent contrasts (PICs), indicating that phylogenetically related traits partially underlie the correlations (mean range size PICs:
r= −0.28,p<0.001; mean abundance PICs:r= −0.24,p<0.001;Fig. 2). Meanwhile, mean range size and abundance of genera are strongly positively correlated, using both the raw data and PICs (r=0.44,p<0.001; PICs:r=0.43,p<0.001). All of the genus-level characteristics show significant phylogenetic signal, but less than would be expected under a Brownian motion model of evolution (Table 1).
A) log10 (Species richness) B) log10 (Mean range size, km2) C) log
10 (Mean abundance, # Inds)
1.8 1.6 1.4 1.2 1 0.8 0.7 0.5 0.3 0 1 2 3 4 5 6 7 8 9 10 11 12 13 14 7 8 14 2 5 6 13 6.2 6.1 5.9 5.8 5.8 5.7 5.6 5.5 5.4 4.5 1 2 3 4 5 6 7 8 9 10 11 12 13 14 1 2 4 11 7 8 8.1 7.7 7.5 7.4 7.2 7 6.9 6.7 6.4 5 8 3 5 9 6 2 7 4 1 13 12 14 11 10 4 13 12 11 9 7 14
Figure 1 Phylogeny of 631 Amazonian tree genera with terminal branches coloured according to the (A) species richness, (B) mean range size,
and (C) mean abundance of genera.The following numbered nodes are mentioned in the main text: 1, Arecaceae; 2, Magnoliids; 3, Rosids; 4,
Aster-ids; 5, Myrtales; 6, Melastomataceae; 7, Euphorbiaceae; 8, Salicaceae; 9, Moraceae; 10, Leguminosae; 11, Lamiales; 12, Rubiaceae; 13, Solanales; and 14, Lecythidaceae. Nodes that are coloured blue indicate lineages whose constituent genera show significantly higher values for the given genus-level characteristic than expected by chance, while nodes coloured red show significantly lower values than expected by chance.
the Asterids. The Leguminosae (Fabaceae), the most genus-rich family in our dataset, does not show any significant departures from null expectations, although individual lineages therein show low species richness and high mean range size. Within the monocots, the Arecaceae show low mean range size, while one lineage (IriarteawithSocratea) shows particularly high abundance.
A non-phylogenetic comparison of genera in the major clades shows they are not significantly different in terms of mean species richness (ANOVA for species richness:
log10(species richness) fre q u e n cy
0.0 0.5 1.0 1.5 2.0 2.5
0
10
20
30
40
-0.5 0.0 0.5 1.0
-0 .4 0.0 0.2 0.4 0.6
PICs log10(mean abunance, # inds)
PI C s sp e ci e s ri ch n e ss
r = -0.24
-0.3 -0.1 0.0 0.1 0.2
-0 .4 0.0 0.2 0.4 0.6
PICs log10(mean range size, km2)
PI C s sp e ci e s ri ch n e ss
r = -0.28
5 6 7 8 9
0.0 0.5 1.0 1.5 2.0 2.5
log10(mean abunance, # Inds)
lo g 1 0 (sp e ci e s ri ch n e ss)
r = -0.38
log10(mean abunance, # inds)
fre q u e n cy
5 6 7 8 9
0
5
10
20
30
-0.3 -0.1 0.0 0.1 0.2
-0
.5
0.0
0.5
1.0
PICs log10(mean range size, km2)
PI C s lo g 1 0 (me a n a b u n a n ce , # i n d s)
r = 0.43
5.0 5.5 6.0 6.5
0.0 0.5 1.0 1.5 2.0 2.5
log10(range size, km2)
lo g 1 0 (sp e ci e s ri ch n e ss)
r = -0.40
5.0 5.5 6.0 6.5
5
6
7
8
9
log10(range size, km2)
lo g 1 0 (me a n a b u n a n ce , # I n d
s) r = 0.44
log10(mean range size, km2)
fre q u e n cy
5.0 5.5 6.0 6.5
0
10
20
30
40
Figure 2 Relationships between species richness and mean range size and abundance for Amazonian
tree genera.Histograms of each genus-level characteristic are given on the diagonal. Below the
diago-nal the raw relationships are shown along with the best-fit linear relationship and the Pearson correla-tion coefficient. Above the diagonal, the relacorrela-tionships of phylogenetically independent contrasts (PICs) are shown along with the best-fit linear relationship that is forced through the origin and the Pearson correlation coefficient.
and Monocots (p=0.019), while genera in the Rosids and Monocots have significantly
higher mean abundance than genera in the Asterids (p<0.001 &p=0.020, respectively).
DISCUSSION
Table 1 1AIC values for different evolutionary models of trait evolution for genus-level
characteris-tics and for different values of Pagel’sλ.
Genus characteristic Evolutionary model λ 1AIC
Estimatedλ 0.26 0
No phylogenetic dependence 0 −17.1
Log (Species richness)
Brownian motion 1 −287.8
Estimatedλ 0.37 0
No phylogenetic dependence 0 −52.0
Log (Mean range size)
Brownian motion 1 −257.9
Estimatedλ 0.32 0
No phylogenetic dependence 0 −34.2
Log (Mean abundance)
Brownian motion 1 −287.5
results suggest that intrinsic factors (i.e., traits of the genera themselves) exert a strong influence on the range size, abundance and species richness of Amazonian tree species and genera.
We propose that tree height may be one of the key traits underlying the observed results. Many of the lineages in our study that show high species richness and small geographic ranges (e.g., Myrtaceae, Melastomataceae, Rubiaceae, Asterales, Solanales, and Lamiales) tend to be small in stature. Previous studies have shown a positive relationship between the height of Amazonian trees and their range size (Ruokolainen et al., 2002;Kristiansen et al., 2009). Such a relationship may be due to larger-statured trees being able to disperse their seeds greater distances, likely through greater fecundity, which would increase the chances that at least some seeds make it a long distance and would, for animal-dispersed species, potentially attract more dispersers. Increased dispersal ability would also increase gene flow among distant populations, which, in turn, could reduce opportunities for allopatric isolation and contribute to reduced diversification. Smaller statured trees may also have shorter generation times, which could contribute to increased diversification (Baker et al., 2014). Thus, small-stature may be a biological trait that spurs diversification and may also underlie the negative correlation between mean range size and species richness of genera. Small-statured lineages also show lower abundances in the datasets assembled, although this is partly, if not entirely, explained by the abundance estimates being derived from tree plots that survey individuals >10 cm diameter at breast height (Ter Steege et al., 2013). Meanwhile, the relationship between mean abundance and species richness of genera may simply be a by-product of correlations between range size and abundance. These are likely necessarily related as the range size of a species will restrict the total abundance that it can achieve.
Our focus on tree height as a key variable does not negate a role for other phylogenetically correlated traits in contributing to the observed results. In local-scale studies of Amazonian tree communities, most of the traits that have been examined (e.g., wood density, specific leaf area) have shown significant phylogenetic signal (Kraft & Ackerly, 2010;Baraloto et al.,
2012). Large-scale compilations of trait data from across the Amazon are now needed in
It is important to note that the phylogenetic signal we observe for these genus-level characteristics is less than would be expected under a Brownian motion model of evolution. In fact, the Brownian model fits the data much worse than a simple model whereby there is no phylogenetic dependence to the observed values (Table 1). This result may be due to some evolutionary process, such as selection, driving closely related genera to diverge in values for the studied genus-level characteristics. However, in contrast to what might be thought for other traits (e.g., those related to ecological niches such as resource acquisition or defence strategy), it is not immediately clear why selection would favour divergence among closely related lineages in their diversification rate, average range size or average abundance. Alternatively, a Brownian motion model may be simply a poor descriptor of how these genus-level characteristics change over time. The Brownian motion model stipulates that per unit time, small changes in trait values are much more likely than large changes. It may be the case that large changes in range size, abundance and diversification rate among closely related changes are just as likely as small changes. The exact pattern of change in these characteristics would depend on how the underlying driving factors themselves, be they intrinsic or extrinsic, change over time and space.
In any case, the phylogenetic signal we document is evident across multiple phylogenetic scales. At a broad scale, we find that various lineages in the Rosids are comprised of genera that show low species richness and high mean range size and abundance, while lineages in the Magnoliids and Asterids show the opposite pattern. Interestingly, a non-phylogenetic approach, using analyses of variance, did not find large differences amongst these major lineages. This contrast in results may be due in part to lineages within the major clades that belie the general pattern. For example, the Myrtales (in the Rosids) show a pattern typical of the Asterids, while the Lecythidaceae (in the Asterids) show a pattern typical of Rosids. The contrast is likely also due to the manner in which these genus-level characteristics are distributed across the phylogeny. While genera within a given major clade can show a diversity of values for these characteristics, their relative phylogenetic positions result in reconstructed ancestral values that show systematic differences amongst lineages in different major clades. A phylogenetic approach was thus necessary to reveal how these major clades differ have differed over evolutionary time. This phylogenetic approach has also served to show how phylogenetically-correlated factors, intrinsic to lineages themselves, have contributed to the macroecological and macroevolutionary patterns observed in present-day Amazonian trees.
ACKNOWLEDGEMENTS
ADDITIONAL INFORMATION AND DECLARATIONS
Funding
Kyle Dexter was supported by a fellowship from the Centre National de la Recherche Scientifique during the time this research was conducted. Financial support received from Fondation pour la Recherche sur la Biodiversité, and from Investissement d’Avenir grants of the ANR (CEBA: ANR-10-LABX-0025; TULIP: ANR-10-LABX-0041). The funders had no role in study design, data collection and analysis, decision to publish, or preparation of the manuscript.
Grant Disclosures
The following grant information was disclosed by the authors: The Centre National de la Recherche Scientifique.
Fondation pour la Recherche sur la Biodiversité. Investissement d’Avenir grants.
Competing Interests
The authors declare there are no competing interests.
Author Contributions
• Kyle Dexter conceived and designed the experiments, performed the experiments,
analyzed the data, contributed reagents/materials/analysis tools, wrote the paper, prepared figures and/or tables, reviewed drafts of the paper.
• Jérôme Chave conceived and designed the experiments, performed the experiments,
wrote the paper, reviewed drafts of the paper.
DNA Deposition
The following information was supplied regarding the deposition of DNA sequences:
We used∼1000 sequences already available on Genbank which are listed inTable S1.
We generated 64 new sequences: GenbankKX640832–KX640895.
Data Availability
The following information was supplied regarding data availability:
The phylogeny that forms the basis of this paper is available at TreeBase: https:
//treebase.org/treebase-web/search/study/summary.html?id=19277.
Supplemental Information
Supplemental information for this article can be found online athttp://dx.doi.org/10.7717/
peerj.2402#supplemental-information.
REFERENCES
Arellano G, Loza MI, Tello JS, Macia MJ. 2015.Commonness and rarity determinants of woody plants in different types of tropical forests.Biodiversity and Conservation
Baker TR, Pennington RT, Magallon S, Gloor E, Laurance WF, Alexiades M, Alvarez E, Araujo A, Arets EJMM, Aymard G, De Oliveira AA, Amaral I, Arroyo L, Bonal D, Brienen RJW, Chave J, Dexter KG, Di Fiore A, Eler E, Feldpausch TR, Ferreira L, Lopez-Gonzalez G, Van der Heijden G, Higuchi N, Honorio E, Huamantupa I, Killeen TJ, Laurance S, Leaño C, Lewis SL, Malhi Y, Marimon BS, Marimon Junior BH, Monteagudo Mendoza A, Neill D, Peñuela-Mora MC, Pitman N, Prieto A, Quesada CA, Ramírez F, Ramírez Angulo H, Rudas A, Ruschel AR, Salomão RP, De Andrade AS, Silva JNM, Silveira M, Simon MF, Spironello W, Ter Steege H, Terborgh J, Toledo M, Torres-Lezama A, Vasquez R, Vieira ICG, Vilanova E, Vos VA, Phillips OL. 2014.Fast demographic traits promote high diversification rates of Amazonian trees.Ecology Letters17:527–536DOI 10.1111/ele.12252.
Baraloto C, Hardy OJ, Paine CET, Dexter KG, Cruaud C, Dunning LT, Gonzalez M-A, Molino J-F, Sabatier D, Savolainen V, Chave J. 2012.Using functional traits and phylogenetic trees to examine the assembly of tropical tree communities.Journal of Ecology 100:690–701DOI 10.1111/j.1365-2745.2012.01966.x.
Bermingham E, Dick C. 2001.The Inga—newcomer or museum antiquity.Science
293:2214–2216DOI 10.1126/science.1065310.
Blomberg SP, Garland T, Ives AR. 2003.Testing for phylogenetic signal in comparative data: behavioral traits are more labile.Evolution57:717–745
DOI 10.1111/j.0014-3820.2003.tb00285.x.
Condit R, Pitman N, Leigh EG, Chave J, Terborgh J, Foster RB, Nunez P, Aguilar S, Valencia R, Villa G, Muller-Landau HC, Losos E, Hubbell SP. 2002.Beta-diversity in tropical forest trees.Science295:666–669DOI 10.1126/science.1066854.
Drummond AJ, Rambaut A. 2007.BEAST: Bayesian evolutionary analysis by sampling
trees.BMC Evolutionary Biology 7:214DOI 10.1186/1471-2148-7-214.
Feeley KJ, Silman MR. 2009.Extinction risks of Amazonian plant species.Proceedings of the National Academy of Sciences of the United States of America106:12382–12387
DOI 10.1073/pnas.0900698106.
Fine PVA, Ree RH. 2006.Latitudinal gradient in tree diversity.The American Naturalist
168:796–804DOI 10.1086/508635.
Freckleton RP, Harvey PH, Pagel M. 2002.Phylogenetic analysis and comparative data: a test and review of evidence.The American Naturalist 160:712–726
DOI 10.1086/343873.
Gentry AH. 1993.A field guide to the families and genera of woody plants of Northwest South America. Washington, D.C.: Conservation International.
Harmon L, Weir J, Brock C, Glor R, Challenger W, Hunt G, Fitzjohn R, Pennell M, Slater G, Brown J, Uyeda J, Eastman J. 2016.Geiger R package: analysis of evolutionary diversification.Available athttp:// lukejharmon.github.io/ code/. Hoorn C, Wesselingh FP, Steege H, Bermudez MA, Mora A, Sevink J, Sanmartín
I, Anderson CL, Figueiredo JP, Jaramillo C, Riff D, Negri FR, Hooghiemstra H, Lundberg J, Stadler T, Särkinen T, Antonelli A. 2010.Amazonia through time: andean uplift, climate change, landscape evolution, and biodiversity.Science
Hubbell SP. 1979.Tree dispersion, abundance, and diversity in a tropical dry forest.
Science203:1299–1309DOI 10.1126/science.203.4387.1299.
Hubbell SP. 2001.The unified neutral theory of biodiversity and biogeography. Princeton: Princeton University Press.
Katoh K, Standley DM. 2013.MAFFT multiple sequence alignment software version
7: improvements in performance and usability.Molecular Biology and Evolution
30:772–780DOI 10.1093/molbev/mst010.
Kraft NJB, Ackerly DD. 2010.Functional trait and phylogenetic tests of community assembly across spatial scales in an Amazonian forest.Ecological Monographs
80:401–422DOI 10.1890/09-1672.1.
Kristiansen T, Svenning J-C, Grandez C, Salo J, Balslev H. 2009.Commonness of Amazonian palm (Arecaceae) species: cross-scale links and potential determinants.
Acta Oecologica-International Journal of Ecology 35:554–562
DOI 10.1016/j.actao.2009.05.001.
Magallón S, Gómez-Acevedo S, Sánchez-Reyes LL, Hernández-Hernández T. 2015.A metacalibrated time-tree documents the early rise of flowering plant phylogenetic
diversity.New Phytologist207:437–453 DOI 10.1111/nph.13264.
Paradis E. 2016.Ape R package: analysis of phylogenetics and evolution.Available at
http:// ape-package.ird.fr/.
Pitman NCA, Terborgh J, Silman MR, Nunez P. 1999.Tree species distributions in an
upper Amazonian forest.Ecology 80:2651–2661
DOI 10.1890/0012-9658(1999)080[2651:TSDIAU]2.0.CO;2.
Pitman NCA, Terborgh J, Silman MR, Nunez P, Neill DA, Ceron CE, Palacios WA, Aulestia M. 2001.Dominance and distribution of tree species in upper Amazonian terra firme forests.Ecology82:2101–2117
DOI 10.1890/0012-9658(2001)082[2101:DADOTS]2.0.CO;2.
Prance GT. 1982.(Editor) biological diversification in the tropics. New York: Columbia University Press.
R Core Development Team. 2016.R: a language and environment for statistical computing. Vienna: R Foundation for Statistical Computing. Available athttp:
// www.R-project.org/.
Revell. 2016.Phytools R package: phylogenetic tools for comparative biology (and more).
Available athttp:// www.phytools.org.
Royal Botanic Gardens Kew. 2016.Seed Information Database (SID). Version 7.1.
Available athttp:// data.kew.org/ sid/.
Ruokolainen K, Tuomisto H, Vormisto J, Pitman N. 2002.Two biases in estimating range sizes of Amazonian plant species.Journal of Tropical Ecology18:935–942
DOI 10.1017/S0266467402002614.
Schluter D, Price T, Mooers AO, Ludwig D. 1997.Likelihood of ancestor states in
adaptive radiation.Evolution51:1699–1711DOI 10.2307/2410994.
Smith SA, Dunn CW. 2008.Phyutility: a phyloinformatics tool for trees, alignments, and
Stamatakis A, Hoover P, Rougemont J. 2008.A rapid bootstrap algorithm for the
RAxMLWeb servers.Systematic Biology57:758–771
DOI 10.1080/10635150802429642.
Ter Steege H, Pitman NCA, Killeen TJ, Laurance WF, Peres CA, Guevara JE, Salomão RP, Castilho CV, Amaral IL, Dionízia F, Matos DA, Coelho LDS, Magnusson WE, Phillips OL, De Andrade D, Filho L, De Jesus M, Carim V, Irume MV, Martins MP, Molino J, Sabatier D, Wittmann F, López DC, Renan J, Mendoza AM, Vargas PN, Manzatto AG, Farias N, Reis C, Terborgh J, Casula KR, Montero JC, Feldpausch TR, Coronado ENH, Javier A, Montoya D, Zartman CE, Mostacedo B, Vasquez R, Assis RL, Medeiros MB, Simon MF, Andrade A, Camargo JL, Laurance SGW, Eduardo H, Nascimento M, Marimon BS, Marimon Jr BM, Costa F, Targhetta N, Célia I, Vieira G, Brienen R, Castellanos H, Duivenvoorden JF, Mogollón HF, Teresa M, Piedade F, AC GA, Comiskey JA, Damasco G, Levis C, Schietti J, Souza P, Alonso A, Dallmeier F, Ferreira LV, Dantas D, Gribel R, Luize BG, Pansonato MP, Venticinque E, Fine P, Toledo M, Baraloto C, Cerón C, Engel J, Henkel TW, Jimenez EM, Stropp J, Thomas-caesar R, Baker TR, Daly D, Paredes MR, Ferreira N, Fuentes A, Jørgensen PM, Schöngart J, Silman MR, Arboleda NC, Van Andel TR, Von Hildebrand P, Barbosa EM, Carlos L, Bonates DM, Oliveira AA, Ramirez-angulo H, Ramos JF, Sierra R, Tirado M, Zagt R, Alexiades MN, Garcia-cabrera K, Hernandez L, Huamantupa-chuquimaco I, Milliken W, Cuenca WP, Pansini S, Pauletto D, Arevalo FR, Sampaio AF, Sandoval EHV, Gamarra LV. 2015.Estimating the global conservation status of more than 15,000 Amazonian tree species.Science Advances1:e1500936DOI 10.1126/sciadv.1500936.
Lopez-Gonzalez G, Silman MR. 2013.Hyperdominance in the Amazonian tree flora.
Science342:1243092DOI 10.1126/science.1243092.
Zanne AE, Lopez-Gonzalez G, Coomes DA, Ilic J, Jansen S, Lewis SL, Miller RB, Swenson NG, Wiemann MC, Chave J. 2009.Data from: towards a worldwide wood economics spectrum. Dryad Digital Repository.Available athttp:// dx.doi.org/ 10.