www.epjournal.net – 2009. (7)1: 57-65 ¯ ¯ ¯ ¯ ¯ ¯ ¯ ¯ ¯ ¯ ¯ ¯ ¯ ¯ ¯ ¯ ¯ ¯ ¯ ¯ ¯ ¯ ¯ ¯ ¯ ¯ ¯ ¯
Original Article
Dead or Alive? Knowledge about a Sibling’s Death Varies by Genetic
Relatedness in a Modern Society
Thomas V. Pollet1, Centre for Behaviour and Evolution, Newcastle University, NE2 4HH, Newcastle upon Tyne, UK. Email: T.V.Pollet@rug.nl (Corresponding Author)
Daniel Nettle, Centre for Behaviour and Evolution, Newcastle University, NE2 4HH, Newcastle upon Tyne, UK.
Abstract: Using a large sample of non-institutionalized individuals from the Netherlands (n = 7610), we examined the influence of relatedness on an individual’s knowledge about whether their sibling is alive or not. Respondents were generally less likely to know whether their sibling was alive if they were not fully related. The effects were stronger for differences between paternal half-siblings and full siblings than for differences between maternal half-siblings and full siblings.
Keywords: kin selection, siblings, human family, death, social cognition
¯ ¯ ¯ ¯ ¯ ¯ ¯ ¯ ¯ ¯ ¯ ¯ ¯ ¯ ¯ ¯ ¯ ¯ ¯ ¯ ¯ ¯ ¯ ¯ ¯ ¯ ¯ ¯ ¯ ¯ ¯ ¯ ¯ ¯ ¯ ¯ ¯ ¯ ¯ ¯ ¯ ¯ ¯ ¯ ¯ ¯ ¯ ¯ ¯ ¯ ¯ ¯ ¯ ¯ ¯ ¯ ¯ ¯ ¯ ¯ ¯ ¯ ¯ ¯ ¯ ¯ ¯ ¯ ¯ ¯ ¯ ¯ ¯ ¯ ¯ ¯ ¯ ¯ ¯ ¯ ¯ ¯ Introduction
From a kin selection perspective (Hamilton, 1964), relatedness is predicted to have a strong impact on family interactions, even in modern societies (Emlen, 1995, 1997). Evolutionists have thoroughly examined the influence of genetic relatedness on human parent-offspring relations (Daly and Wilson, 1981, 1982, 1985, 1988). Several studies have also investigated the role of biological kinship for altruism between individuals (e.g., Korchmaros and Kenny, 2001; Madsen et al., 2007) but the role of relatedness for investment between sibling has been relatively unstudied. With regards to the study of siblings, evolutionists have mainly focussed on sibling rivalry (Sulloway, 1996, 2001), sibling differentiation (Dunn and Plomin, 1991; Plomin and Daniels, 1987) and cues to incest avoidance (Bevc and Silverman, 1993, 2000; Lieberman, Tooby, and Cosmides, 2003; Fessler and Navarrete, 2004). In comparison, relatively little attention has been paid
1
to studying actual investment between siblings. Emlen (1997) suggested however that individuals will invest more in, and have closer relationships with, full siblings than half-siblings or stephalf-siblings. There is some evidence for this prediction: both parents and children report more conflict between siblings when siblings are not fully related (Hetherington, 1988; Aquilino, 1991 for review, but see Kim, Hetherington, and Reiss, 1999). Adult siblings also appear to invest more in fully related siblings than in half-siblings (Pollet, 2007). Even when a society places a strong emphasis on treating all siblings equal, regardless of their relatedness, siblings display more solidarity when fully related (Jankowiak and Diderich, 2000). Here, we examine whether relatedness affects basic knowledge about whether or not a sibling is alive in a cohort of Dutch adults.
Knowledge about whether a related individual is alive or not is required in order to invest in them, and siblings who do invest will consequently have knowledge of their current state. Our hypothesis is that respondents will be more likely to know whether a sibling is alive when they are fully related than when they are not. It is important to bear in mind that this hypothesis is at the ultimate level (Tinbergen, 1963), we are not testing which proximate mechanisms regulate investment in kin.
One could argue that growing up together, rather than genetic relatedness per se, knowledge about a siblings’ death. Identity theory (Stets and Burke, 2000) suggests that individuals who growing up together will learn to identify themselves as members of the same family. This proximate theory would suggest that relatedness in most families is confounded with being raised together. This confound of childhood co-residence can be distinguished from relatedness by comparing not only paternal half-siblings with full siblings but also maternal half-siblings with full siblings. Maternal half-siblings are brought up together just like full siblings, in contrast to paternal half-siblings (De Graaf, 1997; Pollet, 2007). If we find a consistent difference between maternal half-siblings and full-siblings, this suggests that genetic relatedness independently influences knowledge about a sibling’s death. The scenario proposed by identity theory would not hold in this case.
Materials and Methods
siblings, are raised together, whereas paternal half-siblings are not.
We present data for the first six siblings. The vast majority (95.3%) of the total sample of respondents with siblings has six or fewer siblings. Starting from the seventh sibling, sample size becomes increasingly small for constructing multinomial logistic regression models (MLR’s). For these six siblings we constructed separate multinomial logistic regressions in order to investigate the independent effect of sibling type on knowledge about the sibling’s death (Hosmer and Lemeshow, 1989; Menard, 1995; Pampel, 2000; Peng, Lee, and Ingersoll, 2002). Multinomial logistic regression is used to predict outcome variables of a categorical nature. It is relatively free of assumptions and statistically robust. Parameters are estimated by maximum likelihood. As a parameter selection procedure, we used forward stepwise. Model outcomes were the same in terms of model fit and Nagelkerke R² (Nagelkerke, 1991) when backward stepwise was used instead. Besides relatedness, we entered the following control variables in our analysis: education (9 categories: from incomplete/primary to university/postgraduate; treated as interval), age, age differences between the siblings, gender of the respondent, and number of family transitions before age of 16. A family transition refers to an alteration in the respondent’s family living situation since birth, for instance going to live with grandparents or with another family member (see Dykstra et al., 2004 for more info on these variables). Missing values on these variables were deleted listwise. The descriptives for the sample are listed in Table 1.
For each of the models we present odds ratios, Wald statistics and p values for the likelihood ratio tests (pLLR). The odds ratio gives the relative odds of not knowing whether the sibling is alive if the independent variables are changed in the specified way (e.g. a different sibling type). Odds ratios for the control variables are not reported here and can be obtained from the author. The Wald statistic is used to test whether an odds ratio differs significantly from 1 (Pampel, 2000). The pLLR for each variable is based on the difference in model fit (-2LogLikelihood; Pampel, 2000) between a model with the variable and one without, and is thus a measure of significance of effect of each independent variable. The Nagelkerke R² is a measure of variance explained by the overall model.
Results
Table 1. Descriptive statistics for the sample.
¯ ¯ ¯ ¯ ¯ ¯ ¯ ¯ ¯ ¯ ¯ ¯ ¯ ¯ ¯ ¯ ¯ ¯ ¯ ¯ ¯ ¯ ¯ ¯ ¯ ¯ ¯ ¯ ¯ ¯ ¯ ¯ ¯ ¯ ¯ ¯ ¯ ¯ ¯ ¯ ¯ ¯ ¯ ¯ ¯ ¯ ¯ ¯ ¯ ¯ ¯ ¯ ¯ ¯ ¯ ¯ ¯ ¯ ¯ ¯ ¯ ¯ ¯ ¯ ¯ ¯ ¯ ¯ ¯ ¯ ¯ ¯ ¯ ¯ ¯ ¯ ¯ ¯ ¯ ¯ ¯ ¯
Variables Categories Frequencies/means
¯ ¯ ¯ ¯ ¯ ¯ ¯ ¯ ¯ ¯ ¯ ¯ ¯ ¯ ¯ ¯ ¯ ¯ ¯ ¯ ¯ ¯ ¯ ¯ ¯ ¯ ¯ ¯ ¯ ¯ ¯ ¯ ¯ ¯ ¯ ¯ ¯ ¯ ¯ ¯ ¯ ¯ ¯ ¯ ¯ ¯ ¯ ¯ ¯ ¯ ¯ ¯ ¯ ¯ ¯ ¯ ¯ ¯ ¯ ¯ ¯ ¯ ¯ ¯ ¯ ¯ ¯ ¯ ¯ ¯ ¯ ¯ ¯ ¯ ¯ ¯ ¯ ¯ ¯ ¯ ¯ ¯ Educational attainment Incomplete primary or primary n = 684
of respondent Lower vocational n = 1117 Lower general secondary n = 896 Medium general secondary n = 389 Upper general secondary n = 325 Intermediate vocational n = 1678 Higher vocational n = 1775 University or postgraduate n = 746
¯ ¯ ¯ ¯ ¯ ¯ ¯ ¯ ¯ ¯ ¯ ¯ ¯ ¯ ¯ ¯ ¯ ¯ ¯ ¯ ¯ ¯ ¯ ¯ ¯ ¯ ¯ ¯ ¯ ¯ ¯ ¯ ¯ ¯ ¯ ¯ ¯ ¯ ¯ ¯ ¯ ¯ ¯ ¯ ¯ ¯ ¯ ¯ ¯ ¯ ¯ ¯ ¯ ¯ ¯ ¯ ¯ ¯ ¯ ¯ ¯ ¯ ¯ ¯ ¯ ¯ ¯ ¯ ¯ ¯ ¯ ¯ ¯ ¯ ¯ ¯ ¯ ¯ ¯ ¯ ¯ ¯ Gender of the respondent Male n = 3168
Female n = 4442
¯ ¯ ¯ ¯ ¯ ¯ ¯ ¯ ¯ ¯ ¯ ¯ ¯ ¯ ¯ ¯ ¯ ¯ ¯ ¯ ¯ ¯ ¯ ¯ ¯ ¯ ¯ ¯ ¯ ¯ ¯ ¯ ¯ ¯ ¯ ¯ ¯ ¯ ¯ ¯ ¯ ¯ ¯ ¯ ¯ ¯ ¯ ¯ ¯ ¯ ¯ ¯ ¯ ¯ ¯ ¯ ¯ ¯ ¯ ¯ ¯ ¯ ¯ ¯ ¯ ¯ ¯ ¯ ¯ ¯ ¯ ¯ ¯ ¯ ¯ ¯ ¯ ¯ ¯ ¯ ¯ ¯ Sibling type (sib 1) Full sibling n = 7295
Maternal half-sibling n = 91 Paternal half-sibling n = 134
Step-sibling n = 90
¯ ¯ ¯ ¯ ¯ ¯ ¯ ¯ ¯ ¯ ¯ ¯ ¯ ¯ ¯ ¯ ¯ ¯ ¯ ¯ ¯ ¯ ¯ ¯ ¯ ¯ ¯ ¯ ¯ ¯ ¯ ¯ ¯ ¯ ¯ ¯ ¯ ¯ ¯ ¯ ¯ ¯ ¯ ¯ ¯ ¯ ¯ ¯ ¯ ¯ ¯ ¯ ¯ ¯ ¯ ¯ ¯ ¯ ¯ ¯ ¯ ¯ ¯ ¯ ¯ ¯ ¯ ¯ ¯ ¯ ¯ ¯ ¯ ¯ ¯ ¯ ¯ ¯ ¯ ¯ ¯ ¯
Age (interval) Mean = 33.48 years
(SD = 8.6 years) ¯ ¯ ¯ ¯ ¯ ¯ ¯ ¯ ¯ ¯ ¯ ¯ ¯ ¯ ¯ ¯ ¯ ¯ ¯ ¯ ¯ ¯ ¯ ¯ ¯ ¯ ¯ ¯ ¯ ¯ ¯ ¯ ¯ ¯ ¯ ¯ ¯ ¯ ¯ ¯ ¯ ¯ ¯ ¯ ¯ ¯ ¯ ¯ ¯ ¯ ¯ ¯ ¯ ¯ ¯ ¯ ¯ ¯ ¯ ¯ ¯ ¯ ¯ ¯ ¯ ¯ ¯ ¯ ¯ ¯ ¯ ¯ ¯ ¯ ¯ ¯ ¯ ¯ ¯ ¯ ¯ ¯ Family transitions (interval) Mean = 0.06
(SD = 0.33) ¯ ¯ ¯ ¯ ¯ ¯ ¯ ¯ ¯ ¯ ¯ ¯ ¯ ¯ ¯ ¯ ¯ ¯ ¯ ¯ ¯ ¯ ¯ ¯ ¯ ¯ ¯ ¯ ¯ ¯ ¯ ¯ ¯ ¯ ¯ ¯ ¯ ¯ ¯ ¯ ¯ ¯ ¯ ¯ ¯ ¯ ¯ ¯ ¯ ¯ ¯ ¯ ¯ ¯ ¯ ¯ ¯ ¯ ¯ ¯ ¯ ¯ ¯ ¯ ¯ ¯ ¯ ¯ ¯ ¯ ¯ ¯ ¯ ¯ ¯ ¯ ¯ ¯ ¯ ¯ ¯ ¯ Number of siblings (full, half-, (interval) Mean = 3.36
and step-) (SD = 2.55)
¯ ¯ ¯ ¯ ¯ ¯ ¯ ¯ ¯ ¯ ¯ ¯ ¯ ¯ ¯ ¯ ¯ ¯ ¯ ¯ ¯ ¯ ¯ ¯ ¯ ¯ ¯ ¯ ¯ ¯ ¯ ¯ ¯ ¯ ¯ ¯ ¯ ¯ ¯ ¯ ¯ ¯ ¯ ¯ ¯ ¯ ¯ ¯ ¯ ¯ ¯ ¯ ¯ ¯ ¯ ¯ ¯ ¯ ¯ ¯ ¯ ¯ ¯ ¯ ¯ ¯ ¯ ¯ ¯ ¯ ¯ ¯ ¯ ¯ ¯ ¯ ¯ ¯ ¯ ¯ ¯ ¯ Age difference (sib 1) (interval) Mean = -3.33
(SD = 6.28) ¯ ¯ ¯ ¯ ¯ ¯ ¯ ¯ ¯ ¯ ¯ ¯ ¯ ¯ ¯ ¯ ¯ ¯ ¯ ¯ ¯ ¯ ¯ ¯ ¯ ¯ ¯ ¯ ¯ ¯ ¯ ¯ ¯ ¯ ¯ ¯ ¯ ¯ ¯ ¯ ¯ ¯ ¯ ¯ ¯ ¯ ¯ ¯ ¯ ¯ ¯ ¯ ¯ ¯ ¯ ¯ ¯ ¯ ¯ ¯ ¯ ¯ ¯ ¯ ¯ ¯ ¯ ¯ ¯ ¯ ¯ ¯ ¯ ¯ ¯ ¯ ¯ ¯ ¯ ¯ ¯ ¯
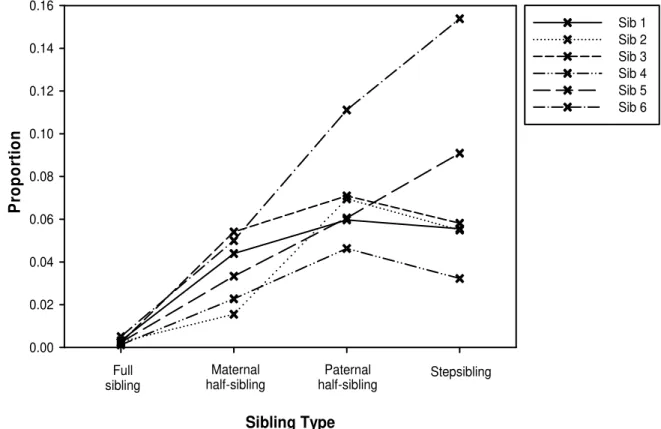
Figure 1. Proportion of respondents that does not know whether their sibling is alive or not by sibling type.
The regression models and odds ratios are represented in Table 2. The Nagelkerke
R² varied between 0.162 and 0.34, which is good according to standards in the social sciences. Across all six models, sibling type proves to be a highly significant predictor of knowledge about a sibling’s death (pllr < 0.001). The other variables did not prove consistent predictors. Across the six models, odds ratios for SS versus FS, PHS versus FS, and MHS versus FS were all significant, with a strong effect size (varying between 5.36 and 42.4). For instance, respondents are 25.75 times more likely to not know whether their sibling 1 is alive when sibling 1 is a SS than when he/she is a FS. Odds ratios were generally stronger for SS versus FS (15.9 - 42.4, mean 27.57) and PHS versus FS (13.03 - 36.74, mean 25.4), than for MHS versus FS (5.36 - 23.56, mean 11.95). However, the direct comparisons of PHS to MHS and SS to MHS produced only one significant odds ratio each.
Sibling Type
P
ropor
ti
on
0.00 0.02 0.04 0.06 0.08 0.10 0.12 0.14 0.16
Sib 1 Sib 2 Sib 3 Sib 4 Sib 5 Sib 6
Paternal
half-sibling Stepsibling Maternal
half-sibling Full
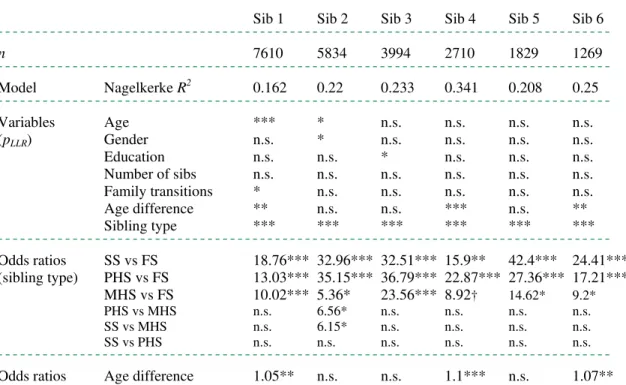
Table 2. Model overview for MLR, pLLR and odds ratios. n = number of respondents in analysis.
¯ ¯ ¯ ¯ ¯ ¯ ¯ ¯ ¯ ¯ ¯ ¯ ¯ ¯ ¯ ¯ ¯ ¯ ¯ ¯ ¯ ¯ ¯ ¯ ¯ ¯ ¯ ¯ ¯ ¯ ¯ ¯ ¯ ¯ ¯ ¯ ¯ ¯ ¯ ¯ ¯ ¯ ¯ ¯ ¯ ¯ ¯ ¯ ¯ ¯ ¯ ¯ ¯ ¯ ¯ ¯ ¯ ¯ ¯ ¯ ¯ ¯ ¯ ¯ ¯ ¯ ¯ ¯ ¯ ¯ ¯ ¯ ¯ ¯ ¯ ¯ ¯ ¯ ¯ ¯ ¯ ¯ Sib 1 Sib 2 Sib 3 Sib 4 Sib 5 Sib 6 ¯ ¯ ¯ ¯ ¯ ¯ ¯ ¯ ¯ ¯ ¯ ¯ ¯ ¯ ¯ ¯ ¯ ¯ ¯ ¯ ¯ ¯ ¯ ¯ ¯ ¯ ¯ ¯ ¯ ¯ ¯ ¯ ¯ ¯ ¯ ¯ ¯ ¯ ¯ ¯ ¯ ¯ ¯ ¯ ¯ ¯ ¯ ¯ ¯ ¯ ¯ ¯ ¯ ¯ ¯ ¯ ¯ ¯ ¯ ¯ ¯ ¯ ¯ ¯ ¯ ¯ ¯ ¯ ¯ ¯ ¯ ¯ ¯ ¯ ¯ ¯ ¯ ¯ ¯ ¯ ¯ ¯
n 7610 5834 3994 2710 1829 1269
¯ ¯ ¯ ¯ ¯ ¯ ¯ ¯ ¯ ¯ ¯ ¯ ¯ ¯ ¯ ¯ ¯ ¯ ¯ ¯ ¯ ¯ ¯ ¯ ¯ ¯ ¯ ¯ ¯ ¯ ¯ ¯ ¯ ¯ ¯ ¯ ¯ ¯ ¯ ¯ ¯ ¯ ¯ ¯ ¯ ¯ ¯ ¯ ¯ ¯ ¯ ¯ ¯ ¯ ¯ ¯ ¯ ¯ ¯ ¯ ¯ ¯ ¯ ¯ ¯ ¯ ¯ ¯ ¯ ¯ ¯ ¯ ¯ ¯ ¯ ¯ ¯ ¯ ¯ ¯ ¯ ¯ Model Nagelkerke R2 0.162 0.22 0.233 0.341 0.208 0.25 ¯ ¯ ¯ ¯ ¯ ¯ ¯ ¯ ¯ ¯ ¯ ¯ ¯ ¯ ¯ ¯ ¯ ¯ ¯ ¯ ¯ ¯ ¯ ¯ ¯ ¯ ¯ ¯ ¯ ¯ ¯ ¯ ¯ ¯ ¯ ¯ ¯ ¯ ¯ ¯ ¯ ¯ ¯ ¯ ¯ ¯ ¯ ¯ ¯ ¯ ¯ ¯ ¯ ¯ ¯ ¯ ¯ ¯ ¯ ¯ ¯ ¯ ¯ ¯ ¯ ¯ ¯ ¯ ¯ ¯ ¯ ¯ ¯ ¯ ¯ ¯ ¯ ¯ ¯ ¯ ¯ ¯ Variables Age *** * n.s. n.s. n.s. n.s. (pLLR) Gender n.s. * n.s. n.s. n.s. n.s.
Education n.s. n.s. * n.s. n.s. n.s. Number of sibs n.s. n.s. n.s. n.s. n.s. n.s. Family transitions * n.s. n.s. n.s. n.s. n.s. Age difference ** n.s. n.s. *** n.s. **
Sibling type *** *** *** *** *** ***
¯ ¯ ¯ ¯ ¯ ¯ ¯ ¯ ¯ ¯ ¯ ¯ ¯ ¯ ¯ ¯ ¯ ¯ ¯ ¯ ¯ ¯ ¯ ¯ ¯ ¯ ¯ ¯ ¯ ¯ ¯ ¯ ¯ ¯ ¯ ¯ ¯ ¯ ¯ ¯ ¯ ¯ ¯ ¯ ¯ ¯ ¯ ¯ ¯ ¯ ¯ ¯ ¯ ¯ ¯ ¯ ¯ ¯ ¯ ¯ ¯ ¯ ¯ ¯ ¯ ¯ ¯ ¯ ¯ ¯ ¯ ¯ ¯ ¯ ¯ ¯ ¯ ¯ ¯ ¯ ¯ ¯ Odds ratios SS vs FS 18.76*** 32.96*** 32.51*** 15.9** 42.4*** 24.41*** (sibling type) PHS vs FS 13.03*** 35.15*** 36.79*** 22.87*** 27.36*** 17.21*** MHS vs FS 10.02*** 5.36* 23.56*** 8.92† 14.62* 9.2* PHS vs MHS n.s. 6.56* n.s. n.s. n.s. n.s. SS vs MHS n.s. 6.15* n.s. n.s. n.s. n.s.
SS vs PHS n.s. n.s. n.s. n.s. n.s. n.s.
¯ ¯ ¯ ¯ ¯ ¯ ¯ ¯ ¯ ¯ ¯ ¯ ¯ ¯ ¯ ¯ ¯ ¯ ¯ ¯ ¯ ¯ ¯ ¯ ¯ ¯ ¯ ¯ ¯ ¯ ¯ ¯ ¯ ¯ ¯ ¯ ¯ ¯ ¯ ¯ ¯ ¯ ¯ ¯ ¯ ¯ ¯ ¯ ¯ ¯ ¯ ¯ ¯ ¯ ¯ ¯ ¯ ¯ ¯ ¯ ¯ ¯ ¯ ¯ ¯ ¯ ¯ ¯ ¯ ¯ ¯ ¯ ¯ ¯ ¯ ¯ ¯ ¯ ¯ ¯ ¯ ¯ Odds ratios Age difference 1.05** n.s. n.s. 1.1*** n.s. 1.07** ¯ ¯ ¯ ¯ ¯ ¯ ¯ ¯ ¯ ¯ ¯ ¯ ¯ ¯ ¯ ¯ ¯ ¯ ¯ ¯ ¯ ¯ ¯ ¯ ¯ ¯ ¯ ¯ ¯ ¯ ¯ ¯ ¯ ¯ ¯ ¯ ¯ ¯ ¯ ¯ ¯ ¯ ¯ ¯ ¯ ¯ ¯ ¯ ¯ ¯ ¯ ¯ ¯ ¯ ¯ ¯ ¯ ¯ ¯ ¯ ¯ ¯ ¯ ¯ ¯ ¯ ¯ ¯ ¯ ¯ ¯ ¯ ¯ ¯ ¯ ¯ ¯ ¯ ¯ ¯ ¯ ¯
Note. Odds ratios for comparisons between sibling types. †: 0.1 < p < 0.05; *: p < 0.05; **:
p < 0.01; ***: p < 0.001 (Wald statistic for odds ratios). n.s. = not statistically significant.
Discussion
Relatedness influenced an individual’s knowledge about the death of a sibling: respondents who were fully related were significantly more likely to have this basic knowledge about their siblings than individuals who were not fully related. Other variables such as gender or age of the respondent did not consistently influence this knowledge. Given that there are consistent differences not only between PHS and FS, but also between MHS and FS, in knowledge about a sibling’s death we can conclude that genetic relatedness in itself influenced this knowledge. Childhood co-residence cannot account for the observed differences between maternal half-siblings and full siblings, as in both cases siblings are raised together. Thus, we find support for Emlen’s prediction (1997): full siblings tend to have closer relationships than half-siblings or step-siblings.
suggesting that childhood co-residence and/or MPA is the only kinship cue governing investment but it is likely to be a very important one. Childhood co-residence and/or the MPA, however, cannot explain the differences between full siblings and maternal half-siblings. It is likely that a cue such as third party knowledge, somebody telling an individual that he or she is a fully related sibling to another person, might be important here. However, such a cue can definitely be the sole cue regulating sibling investment: the differences between PHS and FS and SS and FS were far stronger than those between MHS and FS. This indicates that being raised together and the maternal perinatal association are likely to be important cues in determining later investments. Thus, multiple kinship cues affect basic knowledge about a sibling’s death. Further research is however necessary to disentangle the relative importance of each kinship cue and how they interact in kin detection.
The direct comparisons of SS and MHS, and PHS and MHS were not consistently significant. This is likely due to the small number of cases under comparison. Larger samples are necessary to further explore the relative importance of relatedness compared to being raised together.
In conclusion, as kin selection theory (Hamilton, 1964) and Emlen (1997) lead to predict, genetic relatedness strongly affects an individual’s knowledge about whether a sibling is alive or not. Individuals were significantly more likely to have basic knowledge about their sibling when fully related, and such knowledge is likely to be symptomatic of their ongoing investments in that relationship.
Acknowledgements
The authors wish to thank the Netherlands Interdisciplinary Demographic Institute (NIDI) for access to the NKPS.
“The Netherlands Kinship Panel Study is funded by grant 480-10-009 from the Major Investments Fund of the Netherlands Organization for Scientific Research (NWO), and by the Netherlands Interdisciplinary Demographic Institute (NIDI), Utrecht University, the University of Amsterdam and Tilburg University.”
Received 06 August 2008; Revision submitted 15 January 2009; Accepted 15 January 2009
References
Aquilino, W.S. (1991). Family structure and home-leaving: A further specification of the relationship. Journal of Marriage and the Family, 53, 999-1010.
Bevc, I., and Silverman, I. (1993). Early proximity and intimacy between siblings and incestuous behavior: a test of the Westermarck theory. Ethology and Sociobiology,
14, 171-181.
Bevc, I., and Silverman, I. (2000). Early separation and sibling incest: a test of the revised Westermarck theory. Evolution and Human Behavior, 21, 151-161.
372-378.
Daly, M., and Wilson, M.I. (1985). Child abuse and other risks of not living with both parents. Ethology and Sociobiology, 6, 197-210.
Daly, M., and Wilson, M.I. (1988). Evolutionary social psychology and homicide. Science,
242, 519-524.
De Graaf, A. (1997). Kinderen van gescheiden ouders (“Children of divorced parents”). Demos, http://www.nidi.knaw.nl/web/html/public/demos/dm97021.html (accessed online on 19-8-2006).
Dunn, J., and Plomin, R. (1991). Why are siblings so different? The significance of differences in sibling experiences within the family. Family Process, 30, 271–283. Dykstra, P.A., Kalmijn, M., Knijn, T.C.M., Komter, A.E., Liefbroer, A.C., and Mulder,
C.H. (2004). Codebook of the Netherlands Kinship Panel Study, a multi-actor, multi-method panel study on solidarity in family relationships, Wave 1. NKPS Working Paper No. 1, The Hague, Netherlands Interdisciplinary Demographic Institute. (version of July 2005).
Emlen, S.T. (1995). An evolutionary theory of the family. Proceedings of the National Academy of Sciences USA, 92, 8092–8099.
Emlen, S.T. (1997). The evolutionary study of human family systems. Social Science Information, 34, 563-589.
Fessler, D.M.T., and Navarrete, C.D. (2004). Third-party attitudes toward sibling incest Evidence for Westermarck’s hypotheses. Evolution and Human Behavior, 25, 277-294.
Hamilton, W.D. (1964). The genetical evolution of social behaviour I, II. Journal of Theoretical Biology, 7, 1-52.
Hetherington, E.M. (1988). Parents, children and siblings six years after divorce. In: Hinde, R.A., and Hinde, J.S. (Eds.) Relationships within the family: mutual influences (pp. 311-331). Oxford: Clarendon Press.
Hosmer, D.W., and Lemeshow, S. (1989). Applied logistic regression analyses. New York: Wiley.
Jankowiak, W, and Diderich, M. (2000). Sibling solidarity in a polygamous community in the USA: Unpacking inclusive fitness. Evolution and Human Behavior, 21, 125-139.
Kim, J.E., Hetherington, E.M., and Reiss, D. (1999). Associations among family relationships, antisocial peers, and adolescents’ externalizing behaviors: Gender and family type differences. Child Development, 70, 1209-1230.
Korchmaros, J.D., and Kenny, D.A. (2001). Emotional closeness as a mediator for the effect of genetic relatedness on altruism. Psychological Science, 12, 262-265.
Menard, S. (1995). Applied Logistic Analysis, Quantitative Applications in the Social Sciences Series #106, Thousand Oaks: Sage Publications.
Nagelkerke, N.J.D. (1991). A note on a general definition of the coefficient of determination. Biometrika, 78, 691-692.
Pampel, F.C. (2000). Logistic regression: A primer, Quantitative Applications in the Social Sciences Series #132. Thousand Oaks: Sage Publications.
Peng, C-Y.J., Lee, K.L., and Ingersoll, G. (2002). An introduction to logistic regression analysis and reporting. Journal of Educational Research, 96, 1-14.
Plomin, R., and Daniels, D. (1987). Why are children in the same family so different from one another. Behavioral and Brain Sciences, 10, 1-60.
Pollet, T.V. (2007). Genetic relatedness and sibling relationship characteristics in a modern society. Evolution and Human Behavior, 28, 176-185.
Stets, J.E., and Burke, P.J. (2000). Identity theory and social identity theory. Social Psychology Quarterly, 63, 224-237.
Sulloway, F. (1996). Born to rebel. New York: Pantheon.
Sulloway, F. (2001) Birth order, sibling competition, and human behaviour. In: Davies P.S., and Holcomb H.R. (Eds.) Conceptual challenges in evolutionary psychology: Innovative research strategies (pp. 39-83). Dordrecht: Kluwer Academic Publishers.