Transcriptome and Molecular Pathway
Analysis of the Hepatopancreas in the Pacific
White Shrimp
Litopenaeus vannamei
under
Chronic Low-Salinity Stress
Ke Chen1, Erchao Li1*, Tongyu Li1, Chang Xu1, Xiaodan Wang1, Heizhao Lin2, Jian G. Qin3, Liqiao Chen1*
1Laboratory of Aquaculture Nutrition and Environmental Health, School of Life Sciences, East China Normal University, Shanghai, China,2Shenzhen Base of South China Sea Fisheries Research Institute, Shenzhen, China,3School of Biological Sciences, Flinders University, Adelaide, Australia
*[email protected](ECL); [email protected](LQC)
Abstract
The Pacific white shrimpLitopenaeus vannameiis a euryhaline penaeid species that shows ontogenetic adaptations to salinity, with its larvae inhabiting oceanic environments and postlarvae and juveniles inhabiting estuaries and lagoons. Ontogenetic adaptations to salin-ity manifest inL.vannameithrough strong hyper-osmoregulatory and hypo-osmoregulatory patterns and an ability to tolerate extremely low salinity levels. To understand this adaptive mechanism to salinity stress, RNA-seq was used to compare the transcriptomic response ofL.vannameito changes in salinity from 30 (control) to 3 practical salinity units (psu) for 8 weeks. In total, 26,034 genes were obtained from the hepatopancreas tissue ofL.vannamei
using the Illumina HiSeq 2000 system, and 855 genes showed significant changes in expression under salinity stress. Eighteen top Kyoto Encyclopedia of Genes and Genomes (KEGG) pathways were significantly involved in physiological responses, particularly in lipid metabolism, including fatty-acid biosynthesis, arachidonic acid metabolism and glycosphin-golipid and glycosaminoglycan metabolism. Lipids or fatty acids can reduce osmotic stress inL.vannameiby providing additional energy or changing the membrane structure to allow osmoregulation in relevant organs, such as the gills. Steroid hormone biosynthesis and the phosphonate and phosphinate metabolism pathways were also involved in the adaptation ofL.vannameito low salinity, and the differential expression patterns of 20 randomly selected genes were validated by quantitative real-time PCR (qPCR). This study is the first report on the long-term adaptive transcriptomic response ofL.vannameito low salinity, and the results will further our understanding of the mechanisms underlying osmoregulation in euryhaline crustaceans.
OPEN ACCESS
Citation:Chen K, Li E, Li T, Xu C, Wang X, Lin H, et al. (2015) Transcriptome and Molecular Pathway Analysis of the Hepatopancreas in the Pacific White ShrimpLitopenaeus vannameiunder Chronic Low-Salinity Stress. PLoS ONE 10(7): e0131503. doi:10.1371/journal.pone.0131503
Editor:Peng Xu, Chinese Academy of Fishery Sciences, CHINA
Received:March 20, 2015
Accepted:June 3, 2015
Published:July 6, 2015
Copyright:© 2015 Chen et al. This is an open access article distributed under the terms of the Creative Commons Attribution License, which permits unrestricted use, distribution, and reproduction in any medium, provided the original author and source are credited.
Data Availability Statement:All relevant data are within the paper and its Supporting Information files.
Funding:This research was supported by grants from the National Natural Science Foundation of China (No. 31472291, 31172422), the Special Fund for Agro-scientific Research in the Public Interest (No. 201003020, 201203065), National‘Twelfth Five-Year’ Plan for Science & Technology Support
Introduction
Salinity is one of the main environmental factors that exert a selection pressure on aquatic organisms, and variations in ambient salinity can directly impact the composition and osmolal-ity of body fluids in aquatic animals [1]. Aquatic crustaceans inhabit environments with vary-ing salinities, such as freshwater to seawater, and a change of environment requires crustaceans to regulate hemolymph osmolytes via osmoregulation [2,3]. Crustaceans display several pat-terns of osmoregulation, including osmoconformation, hyper-osmoregulation and hypo-osmoregulation [2,4]. Studies have shown that salinity stress can reduce salt diffusion between hemolymph and the environment because water is absorbed from the medium, which leads to swollen cells [5]. When confronted with salinity stress, aquatic animals are forced to osmoregu-late by altering the expression of various enzymes and transporters, and the physiological adap-tations associated with such functional changes are energy intensive [6]. Therefore, it is important to determine the amount of energy that is required during adaptations to different salinities. In addition, although the biochemical osmoregulation mechanisms of crustaceans have been studied [1,3,4], the molecular adaptive mechanisms for energy mobilization are not known.
The Pacific white shrimpLitopenaeus vannameiis a typical euryhaline crustacean species that lives in coastal and oceanic environments, and its larvae develop in the ocean, whereas the postlarvae, juveniles and adults live in estuaries and lagoons [7]. A hyper-hypo-osmoregulation process exists in the life history ofL.vannamei, and an adaptive mechanism must exist to cope with the environmental salinity fluctuation or long-term low salinity stress. Therefore,L. van-nameican serve as an animal model in the study of adaptive mechanisms in euryhaline crusta-cean to changes in salinity. BecauseL.vannameiis an important commercial penaeid species in inland aquaculture at low salinity, extensive research has been conducted on its osmoregula-tion capabilities. However, inconsistent results have been found in the literature regarding the iso-osmotic point for growth and survival [8–11], [12], immune ability [13], and stress resis-tance [12,14].
To understand the molecular mechanism underlying salinity adaptation inL.vannamei, various genes have been cloned, including those from the gill for ion transport [15], sarco/ endoplasmic reticulum Ca2+-ATPase [16], glutamate dehydratase [17,18], hyperglycemic hor-mone [19,20] and molt-inhibiting hormone [20]. Moreover, suppression-subtractive hybrid-ization has been used to identify genes and pathways in juvenileL.vannameithat have been exposed to long-term low salinity. However, the most common genes in these libraries are immune-related proteins and enzymes [21], whereas genes or pathways related to energy metabolism have not been found.
Whole-transcriptome shotgun sequencing, which is known as RNA sequencing (RNA-seq) [22], has been employed to reveal a snapshot of the transcriptome [23] that can be used to cap-ture and annotate the transcriptome [24], analyze digital gene expression in hemocytes to gain knowledge on the immune response [25] and discover novel transcribed regions in the genomes of aquatic animals [24,26,27]. To understand the complex molecular mechanism of a specific physiological process, RNA-seq is a practical and efficient method of determining nearly all of the genes and pathways involved in a corresponding physiological function [28–
30]. In this study, we aimed to compare the transcriptomic response ofL.vannameito low-salinity stress and reveal the pathways and genes involved in the process of low-salinity adaption. The results of this study will provide a foundation for understanding the mechanism of osmo-regulation in euryhaline crustacean species.
center (ZF1206), and partly by the E-Institute of Shanghai Municipal Education Commission (No. E03009) and ECNU innovation fund. The funders had no role in study design, data collection and analysis, decision to publish, or preparation of the manuscript.
Results
Sequencing,
de novo
assembly and differential expression genes
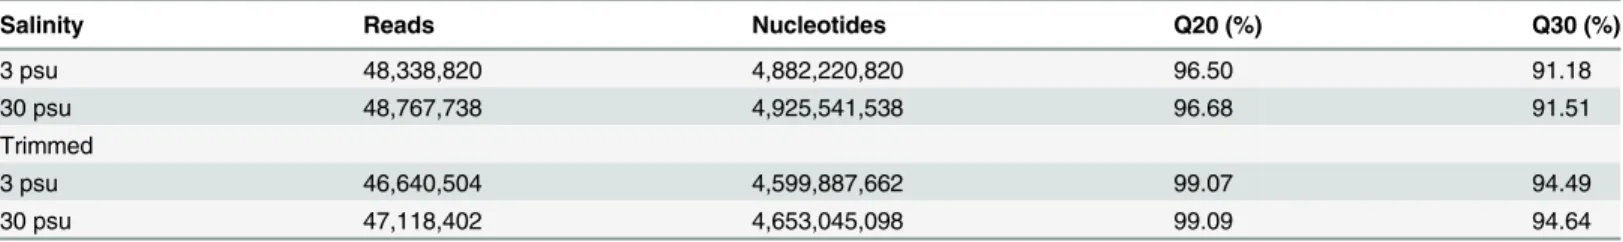
We obtained 97.1 million reads and 98.1 billion nucleotides from the shrimp at both 3 and 30 practical salinity units (psu) (Table 1). After quality trimming and adapter clipping, 93.8 mil-lion reads accounting for 96.6% of the total reads were obtained. In addition, 26,034 genes and 38,237 unigenes with an average length of 1,610 bp were obtained byde novoassembly using Trinity software after splicing and removing redundancy. Among 26034 genes, 855 genes were significantly up or down regulated, and all the differential expression genes were show inS1
Table. A total of 2,341 unigenes were down-regulated, and 2,363 unigenes were up-regulated in
low salinity with the absolute fold change>2. Among the unigenes, the largest and smallest
unigenes were 24,554 bp and 351 bp, respectively (Table 2); the length distribution of unigenes is shown inS1 Fig. To assess the quality and coverage of the transcriptome data, we mapped the assembly unigenes by using Bowtie software, and the mapping data accounted for over 90% of the data, suggesting that the transcriptome dataset provided good gene coverage and enriched the transcriptome information ofL.vannameiin the present study.
Annotation of unigenes
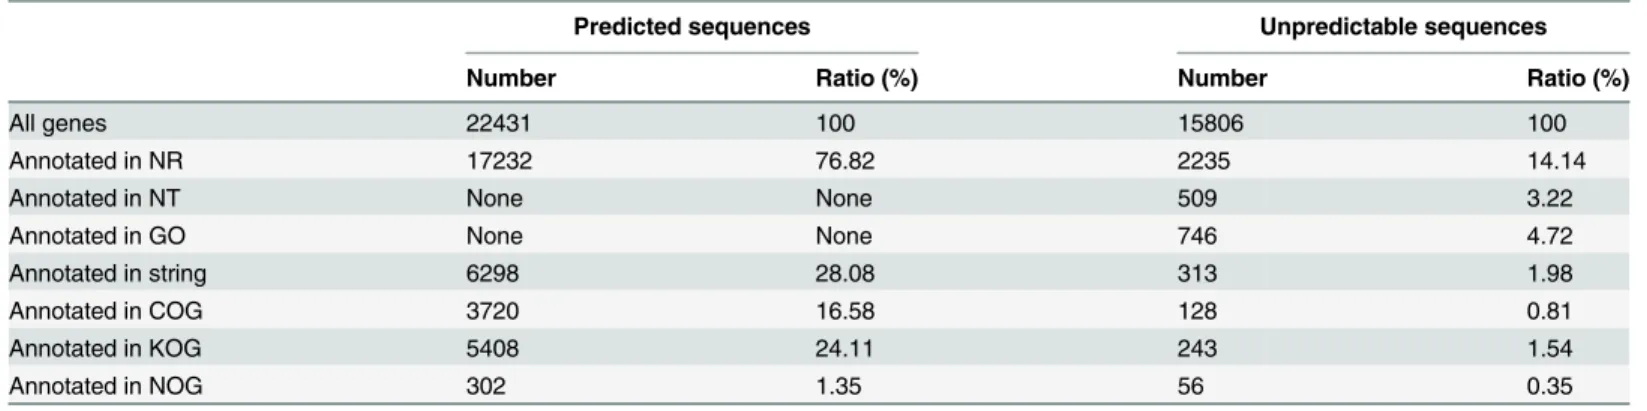
The predicted sequences (predicted open reading frame nucleotide sequences) and unpredict-able sequences (unpredictunpredict-able nucleotide sequences) were annotated using BLASTp and BLASTx, respectively, and then blasted to protein databases, including the nonredundancy (NR), STRING, COG and KOG databases (BLAST 2.2.28+,E-value<1e—5) (Table 3).
Among the annotated predicted sequences, a total of 17,232 (76.83%), 6298 (28.08%), 3720 (16.58%) and 302 (1.35%) sequences were unambiguous alignments relative to the reference when BLASTx was used against the NR, STRING, KOG, and COG databases, respectively. However, among the unpredictable sequences, only 2,235 (14.14%), 746 (4.72%), 509 (3.22%), Table 1. Summary of Illumina-expressed short read production and filtered transcriptomic responses to salinity stress inLitopenaeus vannamei.
Salinity Reads Nucleotides Q20 (%) Q30 (%)
3 psu 48,338,820 4,882,220,820 96.50 91.18
30 psu 48,767,738 4,925,541,538 96.68 91.51
Trimmed
3 psu 46,640,504 4,599,887,662 99.07 94.49
30 psu 47,118,402 4,653,045,098 99.09 94.64
Note: Q20 indicates that every 100 bp of sequencing reads will have an error, and Q30 indicates that every 1000 bp of sequencing reads will have an error.
doi:10.1371/journal.pone.0131503.t001
Table 2. Summary ofde novoassembly results of the transcriptomic responses to salinity stress in
Litopenaeus vannamei.
Type Number
Total genes 26034
Total unigenes 38237
Total residues 61573030 bp
Average length 1610.3 bp
Largest unigene 24554 bp
Smallest unigene 351 bp
313 (1.98%), 243 (1.54%), 128 (0.81%), and 56 (0.35%) of the 15,806 sequences were matched against the NR, gene ontology (GO), NT, STRING, KOG and COG databases, respectively.
After parsing the GO annotation output, a total of 8,779 unigenes were finally annotated with GO terms, with 50.02% annotated to biological processes, 28.93% annotated to cellular components and 21.05% annotated to molecular functions. The distribution of GO terms showed that cellular processes and metabolic processes were the well-represented terms among the biological processes. Cells and cell parts were significantly enriched in cellular components, and analytic activity and binding consisted of a large proportion of molecular functions (S2 Fig).
Clusters of orthologous groups (COGs) of proteins were determined to predict and classify the possible functions of unigenes. The COG annotation analysis showed that three types of function were obtained, including information storage and processing, cellular processes and signaling, and metabolic pathways. The hits from the COG analysis were functionally classified into 25 categories, and the most enriched terms were related to general functions and then transcription and signal transduction mechanisms (S3 Fig).
KEGG pathway analysis annotation and functional enrichment analysis
of GO and KEGG pathways
Various molecular pathways were obtained by Kyoto Encyclopedia of Genes and Genomes (KEGG) annotation. A total of 9,621 unigenes were mapped onto 317 pathways, and the most enriched sequences were metabolic pathways, which was followed by the biosynthesis of sec-ondary metabolites, spliceosome and RNA transport. The top 20 pathways with the greatest number of annotated sequences are shown inTable 4. A total of 47 significantly changed GO terms were obtained, and the most significant change was in molecular functions, which was followed by catalytic activity, histone H4 acetylation, structural constituents of cuticle and chi-tin binding. All of the significantly changed (P<0.05) GO pathways are listed inTable 5. A
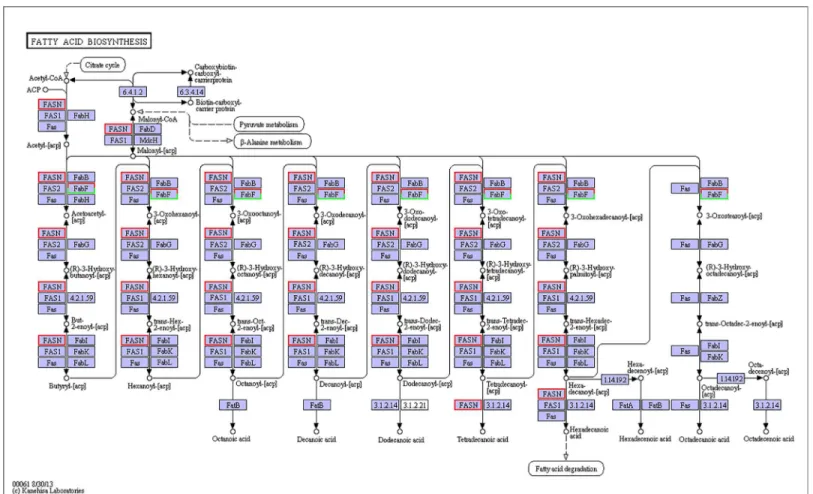
KEGG pathway enrichment analysis was performed for the gene expression between salinity treatments to identify the number of significantly changed samples along the pathway that were relevant to the background number. The most significantly changed KEGG pathways were the glycosphingolipid biosynthesis, lysine degradation, glycosaminoglycan biosynthesis and malaria pathways. The gene recorded as B3GNT1,2 was significantly up-regulated both in the glycosphingolipid biosynthesis pathway and glycosaminoglycan biosynthesis pathway when shrimp were exposed to salinity at 3 psu (Figs1and2). In addition, fatty-acid biosynthe-sis (Fig 3) was significantly enhanced, especially in short-carbon-chain fatty acids (C8-C18). In addition, low-salinity conditions enhanced polyunsaturated fatty-acid (PUFA) biosynthesis, Table 3. Summary of the annotations ofLitopenaeus vannameiunigenes.
Predicted sequences Unpredictable sequences
Number Ratio (%) Number Ratio (%)
All genes 22431 100 15806 100
Annotated in NR 17232 76.82 2235 14.14
Annotated in NT None None 509 3.22
Annotated in GO None None 746 4.72
Annotated in string 6298 28.08 313 1.98
Annotated in COG 3720 16.58 128 0.81
Annotated in KOG 5408 24.11 243 1.54
Annotated in NOG 302 1.35 56 0.35
Table 4. The top 20 pathways with the greatest number of annotated sequences.
Pathway ID Pathway definition Number of sequences
path:ko01100 Metabolic pathways 1476
path:ko01110 Biosynthesis of secondary metabolites 419
path:ko03040 Spliceosome 278
path:ko03013 RNA transport 260
path:ko04144 Endocytosis 247
path:ko05169 Epstein-Barr virus infection 245
path:ko00230 Purine metabolism 236
path:ko05205 Proteoglycans in cancer 232
path:ko05200 Pathways in cancer 231
path:ko01120 Microbial metabolism in diverse environments 227
path:ko04142 Lysosome 219
path:ko05166 HTLV-I infection 216
path:ko04151 PI3K-Akt signaling pathway 216
path:ko04510 Focal adhesion 215
path:ko04141 Protein processing in endoplasmic reticulum 187
path:ko05016 Huntington's disease 186
path:ko04530 Tight junction 185
path:ko05203 Viral carcinogenesis 180
path:ko05168 Herpes simplex infection 180
path:ko04120 Ubiquitin mediated proteolysis 172
doi:10.1371/journal.pone.0131503.t004
Table 5. Significantly changed GO pathways ofL.vannameibetween the two salinities.
GO ID Pathway description Pvalue Type
GO:0003674 molecular function 1.88E-06 Molecular function
GO:0003824 catalytic activity 2.12E-06 Molecular function
GO:0043967 histone H4 acetylation 0.000136 Biological process
GO:0042302 structural constituent of cuticle 0.000223 Molecular function
GO:0008061 chitin binding 0.000638 Molecular function
GO:0097367 carbohydrate derivative binding 0.000884 Molecular function
GO:0006030 chitin metabolic process 0.0016 Biological process
GO:1901071 glucosamine-containing compound metabolic process 0.0021 Biological process
GO:0006022 aminoglycan metabolic process 0.0041 Biological process
GO:0016573 histone acetylation 0.0047 Biological process
GO:0018393 internal peptidyl-lysine acetylation 0.0047 Biological process
GO:0018394 peptidyl-lysine acetylation 0.0047 Biological process
GO:0006475 internal protein amino acid acetylation 0.0061 Biological process
GO:0000123 histone acetyltransferase complex 0.0075 Cellular component
GO:0006473 protein acetylation 0.0079 Biological process
GO:0043543 protein acylation 0.0129 Biological process
GO:1901564 organonitrogen compound metabolic process 0.0139 Biological process
GO:0018205 peptidyl-lysine modification 0.0139 Biological process
GO:0006040 amino sugar metabolic process 0.0163 Biological process
GO:0008152 metabolic process 0.0188 Biological process
GO:0016491 oxidoreductase activity 0.0314 Molecular function
GO:0005576 extracellular region 0.0476 Cellular component
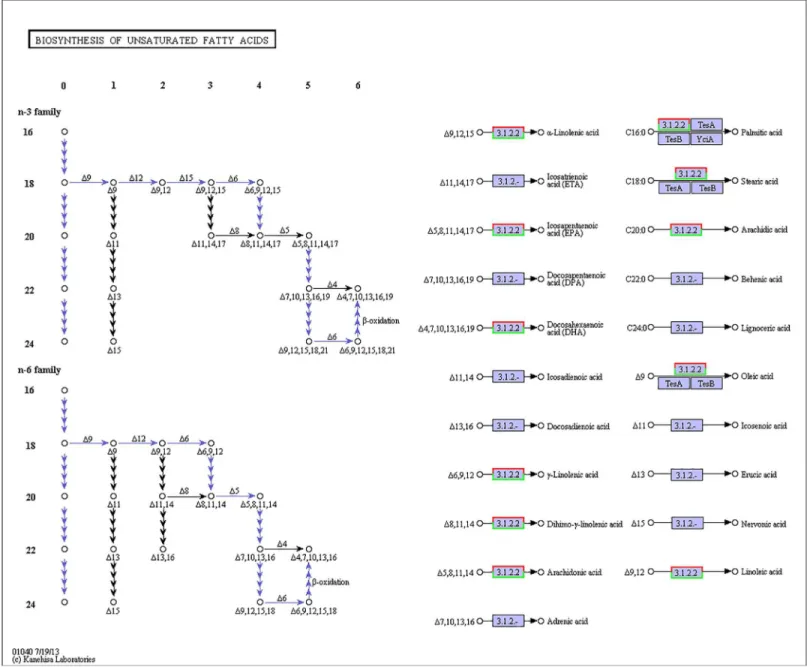
especially that of highly unsaturated fatty acids such as ARA, EPA and DHA (Figs4and5). All of the significantly changed (P<0.05) KEGG pathways are listed inTable 6. These annotations
provide valuable information for studying the specific biological and metabolic processes and functions and molecular mechanisms under salinity stress inL.vannamei.
Validation of RNA-seq profile results by qPCR
Twenty randomly selected genes were measured in the same hepatopancreas RNA samples by qPCR, and the expression levels of these genes were significantly associated with the RNA-seq results (R = 0.91,Fig 6). These results confirm the reliability of RNA-seq and accuracy of the Trinity assembly.
Discussion
Osmoregulation in crustaceans is a complex process because of the diverse range of salinities that they are exposed to in their natural habitat. High-throughput RNA-seq is a good method in determining the underlying molecular mechanisms of osmoregulation [31]. In addition, transcriptome analysis has been used in the discovery of single nucleotide polymorphisms (SNPs) [32] and identification of immune gene [33] and genes and pathways responsible for various pathogen challenges [34–37] inL.vannamei. In the present study, we used RNA-seq onL.vannameiexposed to low salinity to determine the metabolic pathways and perform Fig 1. Pathways of glycosphingolipid biosynthesis: lacto and neolacto series (ko00601).The red frames represent the genes were up-regulated, while the green frames represent that the genes were down-regulated. The frames with both red and green indicate that these genes have more than one unigenes, and some of them were up-regulated, but others were down-regulated.
doi:10.1371/journal.pone.0131503.g001
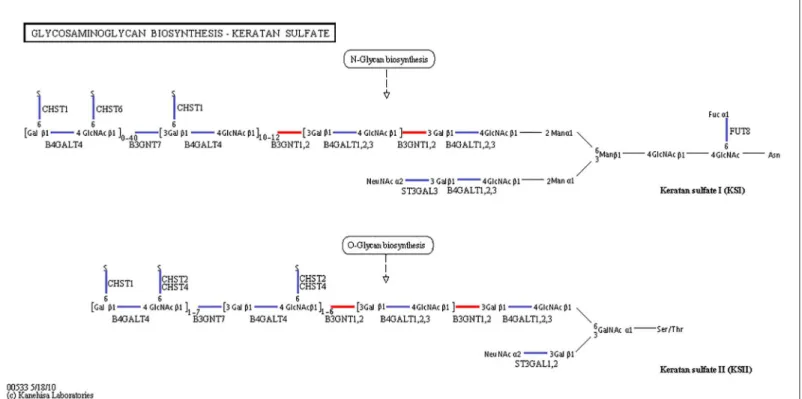
Fig 2. Pathways of glycosaminoglycan biosynthesis: keratan sulfate (ko00533).The red line indicates that the genes were up-regulated.
expression profiling. We found that most of the metabolic activities that were significantly involved in adaptive responses were related to lipid metabolism. This study is the first of its type to report on the key energetic pathways relevant to osmoregulation inL.vannamei.
Relationship between lipid metabolism and response strategies to
salinity stress
Shrimp gill is one of the main tissues for osmoregulation and icon exchange, and the polyun-saturated fatty acids synthesized in hepatopancreas are the main components of shrimp gill. Previous study has shown that under salinity stress, shrimp gill needs extra energy (most from saturated fatty acids) and polyunsaturated fatty acids to ensure the osmoregulation and icon exchange inL.vannamei[38]. In this study, a number of lipid metabolism pathways in the hepatopancreas ofL.vannameiwere influenced by salinity stress, including the fatty-acid bio-synthesis pathway, arachidonic acid metabolism pathway (S4 Fig), adipocytokine signaling pathway (S5 Fig), glycerophospholipid metabolism pathway (S6 Fig), ether lipid metabolism pathway (S7 Fig) and ketone body synthesis and degradation pathway (S8 Fig). These pathways are found in the Chinese mitten crabEriocheir sinensisunder osmotic stress [31]. Lipids, including the fatty-acid structure, composition and metabolism, reduce osmotic shock in aquatic animals (Sui et al., 2007) by providing sufficient energy to maintain the ion balance Fig 3. Pathways of fatty-acid biosynthesis (ko00061).The red frames represent the genes were up-regulated, while the green frames represent that the genes were down-regulated. The frames with both red and green indicate that these genes have more than one unigenes, and some of them were up-regulated, but others were down-regulated.
and regulate the structure of biological membranes [6,39]. This process can directly or indi-rectly function in“compensatory processes”and“limiting processes," which are the two major osmoregulation strategies in crustaceans [4,40].
In this study, most of the significant pathways related to salinity adaptations were associated with the above two major strategies. The limiting process is a strategy to adjust the permeability Fig 4. Pathways of fatty-acid elongation (ko00062).The red frames represent the genes were up-regulated, while the green frames represent that the genes were down-regulated. The frames had both red and green indicated that these genes had more than one unigenes, and some of them were up-regulated, others were down-regulated.
doi:10.1371/journal.pone.0131503.g004
Fig 5. Pathways of unsaturated fatty acid biosynthesis (ko01040).The red frames represent the genes were up-regulated, while the green frames represent that the genes were down-regulated. The frames with both red and green indicate that these genes had more than one unigenes, and some of them were up-regulated, but others were down-regulated.
of the boundary structures to maintain hemolymph osmolality/ions in gill membranes, which is effective at reducing ion diffusion and water influx because the ion transport mechanism requires additional energy [4]. The ability to regulate gill permeability is an adaptive response that is crucial for decapod crustaceans because it facilitates long-term habitation in
Table 6. Significantly changed KEGG pathways ofL.vannameibetween the two tested salinities.
Pathway description KEGG ID Sample number Background number P-value
Glycosphingolipid biosynthesis—lacto and neolacto series ko00601 7 16 0.001
Lysine degradation ko00310 23 102 0.002
Glycosaminoglycan biosynthesis—keratan sulfate ko00533 7 17 0.002
Malaria ko05144 11 41 0.007
Phosphonate and phosphinate metabolism ko00440 4 8 0.009
Glycerophospholipid metabolism ko00564 20 98 0.011
Steroid hormone biosynthesis ko00140 8 29 0.017
Glycosaminoglycan degradation ko00531 11 48 0.023
Adipocytokine signaling pathway ko04920 14 67 0.025
Fatty-acid biosynthesis ko00061 3 6 0.026
Synthesis and degradation of ketone bodies ko00072 8 32 0.031
Ether lipid metabolism ko00565 9 38 0.031
Drug metabolism—cytochrome P450 ko00982 13 63 0.033
Drug metabolism—other enzymes ko00983 15 76 0.033
TGF-beta signaling pathway ko04350 12 57 0.034
Arachidonic acid metabolism ko00590 14 70 0.035
Metabolism of xenobiotics by cytochrome P450 ko00980 14 71 0.039
Cholinergic synapse ko04725 14 71 0.039
Note: The sample number means differently expressed gene number, and the background number means the total gene number in the pathway.
doi:10.1371/journal.pone.0131503.t006
Fig 6. Validation results of RNA-seq profiles by qPCR.
environments with variable salinity [4,40]. Therefore, the cell membranes of the gill should play an important role in osmoregulation [41]. The“compensatory process”strategy is accom-plished via the active exchange of solutes in hemolymph to counterbalance passive diffusion and maintain osmolality [4]. Because this process is energetically costly, a number of energy metabolism pathways and ion regulation pathways must be involved.
Energy from lipid metabolism to maintain the ion balance
Fatty-acid biosynthesis was significantly enhanced, especially for short-carbon-chain fatty acids (C8-C18), and arachidonic acid was also used to convert fatty acids or other metabolic products in the present study. When shrimp suffer from ambient salinity stress, additional energy is required through nutrient intake to maintain homeostasis by osmoregulation via the “compensatory process,”in which lipids play significant roles [42–45].
However, ketone bodies are indispensable for energy that is metabolized from fatty acids, which was revealed by the KEGG analysis in this study. Ketone bodies are produced by the liver from fatty acids during periods of low food intake or carbohydrate restriction. When car-bohydrates are scarce, energy must be obtained from the breakdown of fatty acids from body tissue instead of glucose [46,47]. Interestingly, in the adipocytokine signaling pathway, we found that the gene FACS functioned in long-chain fatty-acid biosynthesis and was signifi-cantly down-regulated under low-salinity stress. CPT-1 is another relevant gene for long-chain fatty-acidβ-oxidation, and it was significantly down-regulated. Therefore, it is reasonable to assume thatL.vannameiprefers to use shorter-chain fatty acids for energy supplementation and selectively retains longer-chain unsaturated fatty acids [39,45]. The enhancement of satu-rated fatty acid biosynthesis in hepatopancreas (the main site for lipogenesis) would provide sufficient energy for osmoregulation in shrimp gill at low salinity, and this result is consistent with our previous findings inL.vannameicultured at low salinity [38].Penaeus monodonalso prefers to use shorter-chain fatty acids in energy metabolism and selectively retains longer-chain unsaturated fatty acids [48].
Polyunsaturated fatty acids in osmoregulation of
L
.
vannamei
In this study, fatty acid elongation (n>18) was significantly enhanced, and the biosynthesis of
α-linolenic acid, EPA, DHA, arachidic acid, arachidonic acid and other PUFAs was up-regu-lated at low salinity. Saturated fatty-acid biosynthesis was enhanced, and PUFA biosynthesis was also strengthened at low salinity. PUFAs can improve the resistance to osmotic shock in aquatic animals because PUFAs are mainly incorporated in cell membranes and can increase membrane permeability and fluidity [49,50]. Free fatty acids, especially LC-PUFA, have the potential to modulate fatty-acid composition in the gill membrane and increase enzymatic effi-ciency [45,51]. Modifications to the fatty-acid composition in the gills that increase the level of LC-PUFA can increase the gill area to enhance the osmoregulatory capacity in shrimp at low salinity, thereby increasing survival [39]. In addition, arachidonic acids in fish can enhance the branchial Na+/K+-ATPase activity and influence the ion balance [52]. Furthermore, arachi-donic acid metabolites can influence the regulation of ion balances across the gill membrane [53].
Glycosphingolipid and glycosaminoglycan metabolism pathways in
regulating membrane structure
sphingolipids) function to protect the cell surface by maintaining the stability of the membrane or plasma membrane to protect against harmful environmental factors by forming a mechani-cally stable and chemimechani-cally resistant outer leaflet for the plasma membrane lipid bilayer [54,
55]. Glycosaminoglycans are classified into four groups: keratan sulfate, heparin/heparan sul-fate, chondroitin/dermatan sulfate and hyaluronic acid. One of the main functions of keratan sulfates is the maintenance of tissue hydration and implantation and migration of endothelial cell [56].
When shrimp were exposed to salinity of 3 psu, the B3GNT1,2 gene, which participates in both the glycosphingolipid biosynthesis pathway and glycosaminoglycan biosynthesis path-way, was significantly up-regulated. The FUT1_2 gene was also significantly up-regulated in the glycosphingolipid biosynthesis pathway. Thus, we believe that the genes B3GNT1,2 and FUT1_2 can promote glycolipid biosynthesis (Fig 1). Glycolipids constitute the lipid bilayer of the plasma membrane and play an important role in maintaining the physical state of the membrane [57]. Thus, glycolipid biosynthesis might promote the“limiting process”and pro-vide resistance to low-salinity stress at 3 psu salinity. However, the effect of keratan sulfate and glycosaminoglycan degradation in low-salinity ambient osmoregulation is still not clear and requires further study.
Glycerophospholipids are glycerol-based phospholipids that are the main component of biological membranes [58], and their biosynthesis was significantly enhanced at low salinity
(Fig 1). Although direct interactions were not observed between glycerophospholipid and
osmoregulation in this study, glycerophospholipids could indirectly improve osmoregulation by affecting membrane permeability. Ether lipids are ubiquitous and constitute a major portion of the cell membranes in mammals [59]. In addition, these lipids play an important role in the generation of lipid second messenger systems, such as prostaglandins and arachidonic acid, which are important in signal transduction [60]. Ether lipids also act directly in cell signaling [61] and are involved in osmotic stress signal transduction. Another possible function of ether lipids is as an antioxidant against oxidative stress, which has been demonstrated in cell culture under salinity stress. Therefore, these lipids might play a role in serum lipoprotein metabolism [62] and lipid metabolism may play an important and indispensable role in osmoregulation [38].
Potential pathways in
L
.
vannamei
under chronic low salinity stress
Because of the complexity of the physiological response to low-salinity stress inL.vannamei, several pathways (in addition to lipid metabolism) show potential importance in the shrimp's ability to cope with salinity stress. However, clear evidence of the direct involvement of these pathways during salinity challenges has not been observed; thus, the putative functions of these pathways including lysine degradation, cholinergic synapse, drug metabolism pathway, steroid hormones metabolism pathway, phosphonate and phosphinate metabolism, are only briefly discussed.
of lecithin [65]. Choline prevents the formation of fat deposits in the liver and facilitates the movement of fat into cells [66]. Thus, considering the result of our previous study [38], it seems that more fat may be used in supplying energy throughβ-oxidation.
Various physiological and pathological factors can affect drug metabolism, including age, individual variations, enterohepatic circulation, nutrition, intestinal flora and sex differences. Cytochrome P450 influences arachidonic acid metabolism [67,68] and fatty-acid metabolism [69] and may have an indirect influence on osmoregulation by influencing the regulation of fatty-acid metabolism and other physiological and biochemical processes. However, the effect of drug metabolism on osmoregulation is still unknown and requires further study. Among the malaria pathways, we found that low-density lipoprotein receptor-related protein 1 (LRP1) was significantly changed when shrimp suffered from salinity stress. LRP1 might have an important role in low-density lipoproteins and thereby influence osmoregulation.
Steroid hormones help control metabolism, inflammation, immune functions and salt and water balance, influence sex characteristics and promote illness and injury prevention [70–72]. Moreover, Birukawa found that steroid hormones are involved in the osmoregulation of ceta-ceans [73]. Phosphonates are effective chelating agents that remain stable under harsh condi-tions. Phosphonates are also regularly used in reverse-osmosis systems [74]. However, the interaction or correlation between osmoregulation and phosphonates is still not clear and requires further study in aquatic animals.
Conclusion
This study revealed that osmoregulation is a complex physiological adaptation that involves a number of pathways, especially the lipid metabolism pathway. WhenL.vannameiis subjected to an osmotic challenge at low salinity, shrimp can improve itself ability against osmotic stress by both“compensatory processes”and“limiting processes," which are the two major osmoreg-ulatory strategies in crustaceans. These two osmoregosmoreg-ulatory strategies may utilize various osmoregulatory mechanisms that are largely dependent on energy metabolism and cell mem-brane regulation (Fig 7). Not only will lipid metabolism supply sufficient energy to ensure the energy metabolism demand, but also many pathways (e.g. lysine degradation, cholinergic syn-apse, drug metabolism etc.) may indirect affect energy metabolism by generating some meta-bolic intermediates to indirectly influence the energy metabolism or affect lipid metabolism. On the other hand, other lipid metabolism pathways, including glycolipids and glycosphingoli-pid, are involved to improve osmoregulation capacity by increasing related enzymatic activity or changing gill permeability. This study provides some insights into the pathways involved in
L.vannameiosmoregulation under low salinity. However, the mechanisms underlying osmo-regulation inL.vannameiare complex and require further study, especially in relation to lipid metabolism and osmoregulation.
Materials and Methods
Experimental animals, design and facilities
slightly over satiation. The unused feed was removed daily with a siphon tube. The photoperiod was 12 h light and 12 h dark. Seawater was pumped from the Dayawan Coast in Shenzhen and filtered through an activated carbon cartridge for at least 3 d before entering the culture system. The tap water was aerated before it was added to the tank to adjust the salinity level. During the experiment, water equal to 1/3 of the tank volume was exchanged once daily. The water quality parameters were monitored 2–3 times a week throughout the feeding trial and main-tained at pH 7.5–7.9, temperature 26–28°C, dissolved oxygen 4.8–6.4 mg L-1, and total ammo-nia nitrogen<0.02 mg L-1during the trial.
At the end of the experiment, shrimp were fasted for 24 h before sampling. Five shrimp at the intermolt stage C in each tank were dissected to obtain the hepatopancreas tissue for the transcriptome analysis.
Eukaryote
de novo
transcriptome sequencing
Total RNA was extracted from the hepatopancreas using the TRIzol reagent (Invitrogen) according to the manufacturer’s instructions, and genomic DNA was removed using DNase I (TaKaRa). RNA quality was determined by a 2100 Bioanalyzer (Agilent), and the RNA was quantified using the NanoDrop 2000 spectrophotometer (ND-2000, Gene Company Ltd.). Only high-quality RNA samples (OD260/280= 1.8–2.2, OD260/2302.0, RIN6.5, 28S:18S1.0,>10μg) were used to construct the sequencing library.
Library preparation and Illumina Hiseq2000 sequencing
The RNA-seq transcriptome library was prepared following the TruSeq RNA (Illumina, San Diego, CA) sample preparation instructions using 5μg total RNA. Briefly, messenger RNA was Fig 7. Relationship between the most influenced pathways and osmoregulation.The dotted-line arrows are indirect effects, and solid-line arrows indicate direct influence.
isolated according to the polyA selection method by oligo beads [75] and then segmented (100 bp to 400 bp) by a fragmentation buffer. Next, double-stranded cDNA was synthesized using a SuperScript double-stranded cDNA synthesis kit (Invitrogen) with random hexamer primers (Illumina). Then, the synthesized cDNA was subjected to end repair, phosphorylation and‘A’ base addition according to Illumina’s library construction protocol. The libraries were size-selected for cDNA target fragments of 200–300 bp on 2% low-range ultra-agarose followed by PCR amplification using Phusion DNA polymerase (New England Biolabs) for 15 PCR cycles. After quantification by a TBS-380 fluorometer, the paired-end RNA-seq library was sequenced with the Illumina HiSeq 2000 system (2 × 100 bp read length). Raw reads were archived at the National Center for Biotechnology Information (NCBI) Sequence Read Archive under the accession No. SRP048814.
De novo
assembly and annotation
The raw paired-end reads were trimmed and quality controlled by SeqPrep (https://github.
com/jstjohn/SeqPrep) and Sickle (https://github.com/najoshi/sickle) with default parameters.
Clean data from the samples were then used to perform RNAde novoassembly with the pro-gram Trinity (http://trinityrnaseq.sourceforge.net/) [76]. All of the assembled transcripts were searched against the NCBI protein NR, STRING and KEGG databases using BLASTx to iden-tify the proteins that had the highest sequence similarity with the given transcripts to retrieve their function annotations, and a typical E-value cut-off was set at<1.0×10⁻⁵. BLAST2GO
(http://www.blast2 go.com/b2 ghome) [77] was used to obtain the GO annotations of uniquely
assembled transcripts for describing biological processes, molecular functions and cellular components. A metabolic pathway analysis was performed using KEGG databases (http://
www.genome.jp/kegg/) [78,79].
Differential expression analysis and functional enrichment
To identify differentially expressed genes (DEGs) between two different samples, the expres-sion level of each transcript was calculated according to the fragments per kilobase of exon per million mapped reads (FRKM) method. RSEM (http://deweylab.biostat.wisc.edu/rsem/) [80] was used to quantify gene and isoform abundances, and the R statistical package software EdgeR (empirical analysis of digital gene expression in R,http://www.bioconductor.org/
packages/2.12/bioc/html/edgeR.html) [81] was used for the differential expression analysis. A
functional-enrichment analysis that KEGG was performed to identify the DEGs that were sig-nificantly enriched in GO terms and metabolic pathways (at a Bonferroni-corrected P-value 0.05) relative to the whole-transcriptome background. The GO functional enrichment and KEGG pathway analysis were conducted by Goatools (https://github.com/tanghaibao/
Goatools) and KOBAS (http://kobas.cbi.pku.edu.cn/home.do) [82].
Experimental validation of RNA-seq profiles by qPCR
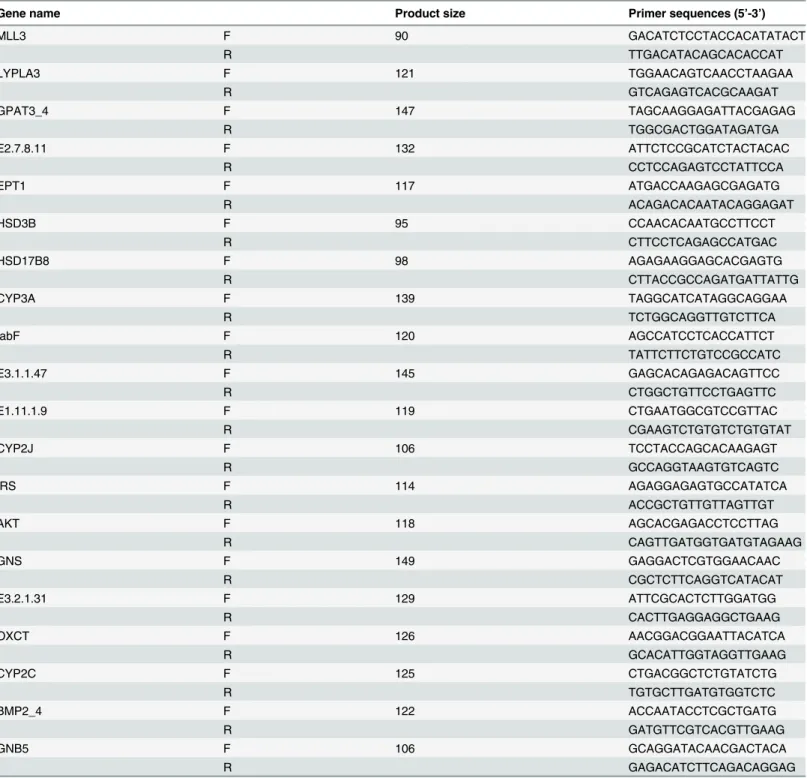
Mixture (WCBIO, CW0957). The amplifications were performed in a 96-well plate in a 20μl reaction volume containing 10μl Ultra SYBR Mixture (WCBIO, CW0957), 0.4μl each gene-specific forward and reverse primer, 8.4μl RNase-free water and 0.8μl cDNA. The thermal profile for the Ultra SYBR Mixture PCR analysis was 95°C for 10 min followed by 40 cycles of 95°C for 15 s and 60°C for 1 min. Theβ-actin gene was used as the reference, and each gene Table 7. Primers used for the qPCR analysis.
Gene name Product size Primer sequences (5’-3’)
MLL3 F 90 GACATCTCCTACCACATATACT
R TTGACATACAGCACACCAT
LYPLA3 F 121 TGGAACAGTCAACCTAAGAA
R GTCAGAGTCACGCAAGAT
GPAT3_4 F 147 TAGCAAGGAGATTACGAGAG
R TGGCGACTGGATAGATGA
E2.7.8.11 F 132 ATTCTCCGCATCTACTACAC
R CCTCCAGAGTCCTATTCCA
EPT1 F 117 ATGACCAAGAGCGAGATG
R ACAGACACAATACAGGAGAT
HSD3B F 95 CCAACACAATGCCTTCCT
R CTTCCTCAGAGCCATGAC
HSD17B8 F 98 AGAGAAGGAGCACGAGTG
R CTTACCGCCAGATGATTATTG
CYP3A F 139 TAGGCATCATAGGCAGGAA
R TCTGGCAGGTTGTCTTCA
fabF F 120 AGCCATCCTCACCATTCT
R TATTCTTCTGTCCGCCATC
E3.1.1.47 F 145 GAGCACAGAGACAGTTCC
R CTGGCTGTTCCTGAGTTC
E1.11.1.9 F 119 CTGAATGGCGTCCGTTAC
R CGAAGTCTGTGTCTGTGTAT
CYP2J F 106 TCCTACCAGCACAAGAGT
R GCCAGGTAAGTGTCAGTC
IRS F 114 AGAGGAGAGTGCCATATCA
R ACCGCTGTTGTTAGTTGT
AKT F 118 AGCACGAGACCTCCTTAG
R CAGTTGATGGTGATGTAGAAG
GNS F 149 GAGGACTCGTGGAACAAC
R CGCTCTTCAGGTCATACAT
E3.2.1.31 F 129 ATTCGCACTCTTGGATGG
R CACTTGAGGAGGCTGAAG
OXCT F 126 AACGGACGGAATTACATCA
R GCACATTGGTAGGTTGAAG
CYP2C F 125 CTGACGGCTCTGTATCTG
R TGTGCTTGATGTGGTCTC
BMP2_4 F 122 ACCAATACCTCGCTGATG
R GATGTTCGTCACGTTGAAG
GNB5 F 106 GCAGGATACAACGACTACA
R GAGACATCTTCAGACAGGAG
had three replicated wells. Relative fold changes were calculated in the Relative Expression Soft-ware Tool version 2009 based on the cycle threshold values generated by qPCR [83].
Supporting Information
S1 Fig. The length distribution of isogenes by Illumina sequencing.
(TIF)
S2 Fig. Gene Ontology distribution of isogenes annotated with GO terms.
(TIF)
S3 Fig. Distribution of isogenes annotated with COG terms.
(TIF)
S4 Fig. Pathway of arachidonic acid metabolism (ko00590).
(TIF)
S5 Fig. Pathway of adipocytokine signaling pathway (ko04920).
(TIF)
S6 Fig. Pathway of glycerophospholipid metabolism.
(TIF)
S7 Fig. Pathway of ether lipid metabolism.
(TIF)
S8 Fig. Pathway of synthesis and degradation of ketone bodies.
(TIF)
S1 Table. The differential expression genes.
(XLS)
Author Contributions
Conceived and designed the experiments: KC ECL. Performed the experiments: KC TYL HZL. Analyzed the data: KC XDW HZL. Contributed reagents/materials/analysis tools: KC CX XDW HZL. Wrote the paper: KC ECL JGQ LQC.
References
1. Charmantier G, Charmantier-Daures M (2001) Ontogeny of osmoregulation in crustaceans: the embry-onic phase. American Zoologist 41: 1078–1089.
2. Charmantier G, Charmantier-Daures M, Towle D (2009) Osmotic and ionic regulation in aquatic arthro-pods. Osmotic and Ionic Regulation Cells and Animals CRC press, Boca Raton, FL, New York, NY, Oxford, UK: 165–230.
3. Romano N, Zeng CS (2012) Osmoregulation in decapod crustaceans: implications to aquaculture pro-ductivity, methods for potential improvement and interactions with elevated ammonia exposure. Aqua-culture 334: 12–23.
4. Pequeux A (1995) Osmotic regulation in crustaceans. Journal of Crustacean Biology: 1–60.
5. Davis DA, Saoud IP, McGraw WJ, Rouse DB (2002) Considerations forLitopenaeus vannameireared in inland low salinity waters. Avances en Nutrición Acuícola VI Memorias del VI Simposium Internacio-nal de Nutrición Acuícola 3.
6. Tseng YC, Hwang PP (2008) Some insights into energy metabolism for osmoregulation in fish. Com-parative Biochemistry and Physiology C-Toxicology & Pharmacology 148: 419–429.
8. Castille FL Jr, Lawrence AL (1981) The effect of salinity on the osmotic, sodium and chloride concentra-tions in the hemolymph of euryhaline shrimp of the genusPenaeus. Comparative Biochemistry and Physiology Part A: Physiology 68: 75–80.
9. Pan LQ, Zhang LJ, Liu HY (2007) Effects of salinity and pH on ion-transport enzyme activities, survival and growth ofLitopenaeus vannameipostlarvae. Aquaculture 273: 711–720.
10. Diaz F, Farfan C, Sierra E, Re AD (2001) Effects of temperature and salinity fluctuation on the ammo-nium excretion and osmoregulation of juveniles ofPenaeus vannamei, Boone. Marine & Freshwater Behaviour & Physiology 34: 93–104.
11. Buckle LF, Baron B, Hernandez M (2006) Osmoregulatory capacity of the shrimpLitopenaeus vanna-meiat different temperatures and salinities, and optimal culture environment. Revista de Biología Tropi-cal 54: 745–753. PMID:18491614
12. Li EC, Chen LQ, Zeng C, Chen XM, Yu N, Lai QM, et al. (2007) Growth, body composition, respiration and ambient ammonia nitrogen tolerance of the juvenile white shrimp,Litopenaeus vannamei, at differ-ent salinities. Aquaculture 265: 385–390.
13. Ponce-Palafox J, Martinez-Palacios CA, Ross LG (1997) The effects of salinity and temperature on the growth and survival rates of juvenile white shrimp,Penaeus vannamei, Boone, 1931. Aquaculture 157: 107–115.
14. Li EC, Chen LQ, Zeng C, Yu N, Xiong ZQ, Chen XM, et al. (2008) Comparison of digestive and antioxi-dant enzymes activities, haemolymph oxyhemocyanin contents and hepatopancreas histology of white shrimp,Litopenaeus vannamei, at various salinities. Aquaculture 274: 80–86.
15. Pan LQ, Liu HY, Zhao Q (2014) Effect of salinity on the biosynthesis of amines inLitopenaeus vanna-meiand the expression of gill related ion transporter genes. Journal of Ocean University of China 13: 453–459.
16. Wang YH, Luo P, Zhang LP, Hu CQ, Ren CH, Xia JJ (2013) Cloning of sarco/endoplasmic reticulum Ca2+-ATPase (SERCA) gene from white shrimp,Litopenaeus vannameiand its expression level analy-sis under salinity stress. Molecular Biology Reports 40: 6213–6221. doi:10.1007/s11033-013-2733-x
PMID:24085584
17. Li EC, Arena L, Lizama G, Gaxiola G, Cuzon G, Rosas C, et al. (2011) Glutamate dehydrogenase and Na+-K+ ATPase expression and growth response ofLitopenaeus vannameito different salinities and dietary protein levels. Chinese Journal of Oceanology and Limnology 29: 343–349.
18. Li EC, Arena L, Chen LQ, Qin JG, Van Wormhoudt A (2009) Characterization and Tissue-Specific Expression of the Two Glutamate Dehydrogenase Cdnas in Pacific White Shrimp,Litopenaeus Vanna-mei. Journal of Crustacean Biology 29: 379–386.
19. Shinji J, Kang BJ, Okutsu T, Banzai K, Ohira T, Tsutsui N, et al. (2012) Changes in crustacean hyper-glycemic hormones in Pacific whiteleg shrimpLitopenaeus vannameisubjected to air-exposure and low-salinity stresses. Fisheries Science 78: 833–840.
20. Lago-Leston A, Ponce E, Munoz ME (2007) Cloning and expression of hyperglycemic (CHH) and molt-inhibiting (MIH) hormones mRNAs from the eyestalk of shrimps ofLitopenaeus vannameigrown in dif-ferent temperature and salinity conditions. Aquaculture 270: 343–357.
21. Gao WH, Tan BP, Mai KS, Chi SY, Liu HY, Dong XH, et al. (2012) Profiling of differentially expressed genes in hepatopancreas of white shrimp (Litopenaeus vannamei) exposed to long-term low salinity stress. Aquaculture 364: 186–191.
22. Morin RD, Bainbridge M, Fejes A, Hirst M, Krzywinski M, Pugh TJ, et al. (2008) Profiling the HeLa S3 transcriptome using randomly primed cDNA and massively parallel short-read sequencing. Biotechni-ques 45: 81–92. doi:10.2144/000112900PMID:18611170
23. Chu YJ, Corey DR (2012) RNA Sequencing: Platform Selection, Experimental Design, and Data Inter-pretation. Nucleic Acid Therapeutics 22: 271–274. doi:10.1089/nat.2012.0367PMID:22830413 24. Qian X, Ba Y, Zhuang QF, Zhong GF (2014) RNA-Seq Technology and Its Application in Fish
Tran-scriptomics. Omics-a Journal of Integrative Biology 18: 98–110. doi:10.1089/omi.2013.0110PMID:
24380445
25. Zhao Q, Pan L, Ren Q, Hu D (2015) Digital gene expression analysis in hemocytes of the white shrimp
Litopenaeus vannameiin response to low salinity stress. Fish Shellfish Immunology 42: 400–407. doi:
10.1016/j.fsi.2014.11.020PMID:25463292
26. Palstra AP, Beltran S, Burgerhout E, Brittijn SA, Magnoni LJ, Henkel CV, et al. (2013) Deep RNA Sequencing of the Skeletal Muscle Transcriptome in Swimming Fish. Plos One 8(1): e53171. doi:10. 1371/journal.pone.0053171PMID:23308156
27. Pauli A, Valen E, Lin MF, Garber M, Vastenhouw NL, Levin JZ, et al. (2012) Systematic identification of long noncoding RNAs expressed during zebrafish embryogenesis. Genome Research 22: 577–591.
28. Smith S, Bernatchez L, Beheregaray LB (2013) RNA-seq analysis reveals extensive transcriptional plasticity to temperature stress in a freshwater fish species. BMC Genomics 14(1). 375
29. Xia JH, Liu P, Liu F, Lin G, Sun F, Tu RJ, et al. (2013) Analysis of Stress-Responsive Transcriptome in the Intestine of Asian Seabass (Lates calcarifer) using RNA-Seq. DNA Research 20: 449–460. doi:10.
1093/dnares/dst022PMID:23761194
30. Xu J, Ji PF, Wang BS, Zhao L, Wang J, Zhao ZX, et al. (2013) Transcriptome sequencing and analysis of wild amur ide (Leuciscus waleckii) inhabiting an extreme alkaline-saline lake reveals insights into stress adaptation. PLoS One 8(4): e59703. doi:10.1371/journal.pone.0059703PMID:23573207
31. Li E, Wang S, Li C, Wang X, Chen K, Chen L (2014) Transcriptome sequencing revealed the genes and pathways involved in salinity stress of Chinese mitten crab,Eriocheir sinensis. Physiological geno-mics 46: 177–190. doi:10.1152/physiolgenomics.00191.2013PMID:24423969
32. Yu Y, Wei JK, Zhang XJ, Liu JW, Liu CZ, Li FH, et al. (2014) SNP Discovery in the Transcriptome of White Pacific ShrimpLitopenaeus vannameiby Next Generation Sequencing. Plos One 9(1): e87218. doi:10.1371/journal.pone.0087218PMID:24498047
33. Robalino J, Almeida JS, McKillen D, Colglazier J, Trent HF, Chen YA, et al. (2007) Insights into the immune transcriptome of the shrimpLitopenaeus vannamei: tissue-specific expression profiles and transcriptomic responses to immune challenge. Physiological Genomics 29: 44–56. PMID:17148689 34. Xue SX, Liu YC, Zhang YC, Sun Y, Geng XY, Sun JS, et al. (2013) Sequencing and de novo analysis of
the hemocytes transcriptome inLitopenaeus vannameiresponse to white spot syndrome virus infec-tion. Plos One 8(10): e76718. doi:10.1371/journal.pone.0076718PMID:24204661
35. Chen XH, Zeng DG, Chen XL, Xie DX, Zhao YZ, Yang CL, et al. (2013) Transcriptome analysis of Lito-penaeus vannameiin response to white spot syndrome virus infection. Plos One 8(8): e73218. doi:10. 1371/journal.pone.0073218PMID:23991181
36. Li CZ, Weng SP, Chen YG, Yu XQ, Lu L, Zhang HQ, et al. (2012) Analysis ofLitopenaeus vannamei
transcriptome using the next-generation DNA sequencing technique. Plos One 7(10): e47442. doi:10. 1371/journal.pone.0047442PMID:23071809
37. Clavero-Salas A, Sotelo-Mundo RR, Gollas-Galvan T, Hernandez-Lopez J, Peregrino-Uriarte AB, Muh-lia-Almazan A, et al. (2007) Transcriptome analysis of gills from the white shrimpLitopenaeus vannamei
infected with white spot syndrome virus. Fish & Shellfish Immunology 23: 459–472.
38. Chen K, Li E, Gan L, Wang X, Xu C, Lin HZ, et al. (2014) Growth and lipid metabolism of the Pacific White ShrimpLitopenaeus vannameiat different salinities. Journal of Shellfish Research 33: 825–832. 39. Palacios E, Bonilla A, Luna D, Racotta IS (2004) Survival, Na+/K+-ATPase and lipid responses to
salin-ity challenge in fed and starved white pacific shrimp (Litopenaeus vannamei) postlarvae. Aquaculture 234: 497–511.
40. Rainbow PS, Black WH (2001) Effects of changes in salinity on the apparent water permeability of three crab species:Carcinus maenas,Eriocheir sinensisandNecora puber. Journal of Experimental Marine Biology and Ecology 264: 1–13.
41. Freire CA, Onken H, McNamara JC (2008) A structure-function analysis of ion transport in crustacean gills and excretory organs. Comparative Biochemistry and Physiology Part A: Molecular & Integrative Physiology 151: 272–304.
42. Lemos D, Phan VN, Alvarez G (2001) Growth, oxygen consumption, ammonia-N excretion, biochemi-cal composition and energy content ofFarfantepenaeus paulensisPerez-Farfante (Crustacea, Deca-poda, Penaeidae) early postlarvae in different salinities. Journal of Experimental Marine Biology and Ecology 261: 55–74. PMID:11438105
43. Luvizotto-santos R, Bianchini A (2003) Lipids as energy source during salinity acclimation in the eury-haline crabChasmagnathus granulatadana, 1851 (crustacea-grapsidae). Journal of Experimental Zoology Part A: Comparative Experimental Biology 295: 200–205.
44. Minh Sang H, Fotedar R (2004) Growth, survival, haemolymph osmolality and organosomatic indices of the western king prawn (Penaeus latisulcatusKishinouye, 1896) reared at different salinities. Aqua-culture 234: 601–614.
45. Palacios E, Bonilla A, Pérez A, Racotta IS, Civera R (2004) Influence of highly unsaturated fatty acids on the responses of white shrimp (Litopenaeus vannamei) postlarvae to low salinity. Journal of Experi-mental Marine Biology and Ecology 299: 201–215.
46. Ranallo R, Rhodes E (1998) Lipid metabolism during exercise. Sports Medicine 26: 29–42. PMID:
9739539
47. Bradbury MW (2006) Lipid metabolism and liver inflammation. I. Hepatic fatty acid uptake: possible role in steatosis. American Journal of Physiology-Gastrointestinal and Liver Physiology 290(2): G194–
48. Deering MJ, Fielder DR, Hewitt DR (1997) Growth and fatty acid composition of juvenile leader prawns,
Penaeus monodon, fed different lipids. Aquaculture 151: 131–141.
49. Martins TG, Cavalli RO, Martino RC, Rezende CEM, Wasielesky W Jr (2006) Larviculture output and stress tolerance ofFarfantepenaeus paulensispostlarvae fedArtemiacontaining different fatty acids. Aquaculture 252: 525–533.
50. Sui L, Wille M, Cheng Y, Sorgeloos P (2007) The effect of dietary n-3 HUFA levels and DHA/EPA ratios on growth, survival and osmotic stress tolerance of Chinese mitten crabEriocheir sinensislarvae. Aqua-culture 273: 139–150.
51. Hurtado MA, Racotta IS, Civera R, Ibarra L, Hernández-Rodríguez M, Palacios E (2007) Effect of hypo-and hypersaline conditions on osmolality hypo-and Na+/K+-ATPase activity in juvenile shrimp (Litopenaeus vannamei) fed low- and high-HUFA diets. Comparative Biochemistry and Physiology Part A: Molecular & Integrative Physiology 147: 703–710.
52. Van Anholt RD, Spanings FA, Koven WM, Nixon O, Wendelaar Bonga SE (2004) Arachidonic acid reduces the stress response of gilthead seabreamSparus aurataL. Journal of Experimental Biology 207: 3419–3430. PMID:15326218
53. Beckman B, Mustafa T (1992) Arachidonic acid metabolism in gill homogenate and isolated gill cells from rainbow trout,Oncorhynchus mykiss: the effect of osmolality, electrolytes and prolactin. Fish Phys-iology and Biochemistry 10: 213–222. doi:10.1007/BF00004515PMID:24214274
54. Bartke N, Hannun YA (2009) Bioactive sphingolipids: metabolism and function. Journal of Lipid Research 50: S91–S96. doi:10.1194/jlr.R800080-JLR200PMID:19017611
55. Brown DA, London E (2000) Structure and function of sphingolipid- and cholesterol-rich membrane rafts. Journal of Biological Chemistry 275: 17221–17224. PMID:10770957
56. Trowbridge JM, Gallo RL (2002) Dermatan sulfate: new functions from an old glycosaminoglycan. Gly-cobiology 12: 117R–125R. PMID:12213784
57. Bhoite S, Roy R (2013) Role of membrane lipid in osmoregulatory processes during salinity adaptation: a study with chloride cell of mud crab,Scylla serrata. Marine and Freshwater Behaviour and Physiology 46: 287–300.
58. Tocher DR (1995) Glycerophospholipid metabolism. Biochemistry and molecular biology of fishes 4: 119–157.
59. Paltauf F (1994) Ether lipids in biomembranes. Chemistry Physics Lipids 74(2): 101–139. 60. Spector AA, Yorek MA (1985) Membrane lipid composition and cellular function. Journal of Lipid
Research 26: 1015–1035. PMID:3906008
61. Demopoulos C, Pinckard R, Hanahan DJ (1979) Platelet-activating factor. Evidence for 1-O-alkyl-2-acetyl-sn-glyceryl-3-phosphorylcholine as the active component (a new class of lipid chemical media-tors). Journal of Biological Chemistry 254: 9355–9358. PMID:489536
62. Brosche T, Platt D (1998) The biological significance of plasmalogens in defense against oxidative damage. Experimental Gerontology 33: 363–369. PMID:9762517
63. Starai V, Celic I, Cole R, Boeke J, Escalante-Semerena J (2002) Sir2-dependent activation of acetyl-CoA synthetase by deacetylation of active lysine. Science 298: 2390–2392. PMID:12493915 64. Schwer B, Bunkenborg J, Verdin RO, Andersen JS, Verdin E (2006) Reversible lysine acetylation
con-trols the activity of the mitochondrial enzyme acetyl-CoA synthetase 2. Proceedings of the National Academy of Sciences 103: 10224–10229.
65. Wauben IPM, Wainwright PE (1999) The influence of neonatal nutrition on behavioral development: A critical appraisal. Nutrition Reviews 57: 35–44. PMID:10079701
66. Blum K, Downs BW, Waite RL, Heaney WJ (2012) Nutrigenomic methods to overcome carbohydrate bingeing and overeating. Google Patents.
67. Capdevila JH, Falck JR, Harris RC (2000) Cytochrome P450 and arachidonic acid bioactivation: molec-ular and functional properties of the arachidonate monooxygenase. Journal of Lipid Research 41: 163–181. PMID:10681399
68. Kroetz DL, Zeldin DC (2002) Cytochrome P450 pathways of arachidonic acid metabolism. Current opinion in lipidology 13: 273–283. PMID:12045397
69. Hardwick JP (2008) Cytochrome P450 omega hydroxylase (CYP4) function in fatty acid metabolism and metabolic diseases. Biochemical pharmacology 75: 2263–2275. doi:10.1016/j.bcp.2008.03.004
PMID:18433732
70. Funder JW, Krozowski Z, Myles K, Sato A, Sheppard KE, Young M (1996) Mineralocorticoid receptors, salt, and hypertension. Recent Progress in Hormone Research 52: 247–260; Discussion 261–242. 71. Gupta B, Lalchhandama K (2002) Molecular mechanisms of glucocorticoid action. Current
72. Frye C (2009) Steroids, reproductive endocrine function, and affect. A review. Minerva ginecologica 61: 541–562. PMID:19942840
73. Birukawa N, Ando H, Goto M, Kanda N, Pastene LA, Nakatsuji H, et al. (2005) Plasma and urine levels of electrolytes, urea and steroid hormones involved in osmoregulation of cetaceans. Zoological Sci-ence 22: 1245–1257. PMID:16357473
74. Soderquist CA, Zeiher EK (1994) Method for inhibiting scale formation and/or dispersing iron in reverse osmosis systems. Google Patents.
75. Koboldt DC, Chen K, Wylie T, Larson DE, McLellan MD, Mardis ER, et al. (2009) VarScan: variant detection in massively parallel sequencing of individual and pooled samples. Bioinformatics 25: 2283–
2285. doi:10.1093/bioinformatics/btp373PMID:19542151
76. Grabherr MG, Haas BJ, Yassour M, Levin JZ, Thompson DA, Amit I, et al. (2011) Full-length transcrip-tome assembly from RNA-Seq data without a reference genome. Nature Biotechnology 29: 644–U130.
doi:10.1038/nbt.1883PMID:21572440
77. Conesa A, Gotz S, Garcia-Gomez JM, Terol J, Talon M, Robles M (2005) Blast2GO: a universal tool for annotation, visualization and analysis in functional genomics research. Bioinformatics 21: 3674–3676.
PMID:16081474
78. Goto S, Kanehisa M (2000) KEGG: Kyoto Encyclopedia of Genes and Genomes. Nucleic Acids Research 28: 27–30. PMID:10592173
79. Kanehisa M, Goto S (2000) KEGG: Kyoto Encyclopedia of Genes and Genomes. Nucleic Acids Research 28: 27–30. PMID:10592173
80. Li B, Dewey CN (2011) RSEM: accurate transcript quantification from RNA-Seq data with or without a reference genome. BMC Bioinformatics 12: 323. doi:10.1186/1471-2105-12-323PMID:21816040
81. Robinson MD, McCarthy DJ, Smyth GK (2010) edgeR: a Bioconductor package for differential expres-sion analysis of digital gene expresexpres-sion data. Bioinformatics 26: 139–140. doi:10.1093/bioinformatics/
btp616PMID:19910308
82. Xie C, Mao X, Huang J, Ding Y, Wu J, Dong S, et al. (2011) KOBAS 2.0: a web server for annotation and identification of enriched pathways and diseases. Nucleic Acids Res 39: W316–322. doi:10.1093/
nar/gkr483PMID:21715386