Peroxisome Proliferator-Activated Receptor
Bioluminescent Imaging-Guided Transcriptomic Analysis
Chia-Hung Kao1, Chien-Yun Hsiang2, Tin-Yun Ho3*
1Department of Nuclear Medicine, China Medical University Hospital, Taichung, Taiwan,2Department of Microbiology, China Medical University, Taichung, Taiwan, 3Graduate Institute of Chinese Medicine, China Medical University, Taichung, Taiwan
Abstract
Chitosan has been widely used in food industry as a weight-loss aid and a cholesterol-lowering agent. Previous studies have shown that chitosan affects metabolic responses and contributes to anti-diabetic, hypocholesteremic, and blood glucose-lowering effects; however, thein vivotargeting sites and mechanisms of chitosan remain to be clarified. In this study, we constructed transgenic mice, which carried the luciferase genes driven by peroxisome proliferator-activated receptor (PPAR), a key regulator of fatty acid and glucose metabolism. Bioluminescent imaging of PPAR transgenic mice was applied to report the organs that chitosan acted on, and gene expression profiles of chitosan-targeted organs were further analyzed to elucidate the mechanisms of chitosan. Bioluminescent imaging showed that constitutive PPAR activities were detected in brain and gastrointestinal tract. Administration of chitosan significantly activated the PPAR activities in brain and stomach. Microarray analysis of brain and stomach showed that several pathways involved in lipid and glucose metabolism were regulated by chitosan. Moreover, the expression levels of metabolism-associated genes like apolipoprotein B (apoB) and ghrelin genes were down-regulated by chitosan. In conclusion, these findings suggested the feasibility of PPAR bioluminescent imaging-guided transcriptomic analysis on the evaluation of chitosan-affected metabolic responsesin vivo. Moreover, we newly identified that downregulated expression of apoB and ghrelin genes were novel mechanisms for chitosan-affected metabolic responsesin vivo.
Citation:Kao C-H, Hsiang C-Y, Ho T-Y (2012) Assessment of Chitosan-Affected Metabolic Response by Peroxisome Proliferator-Activated Receptor Bioluminescent Imaging-Guided Transcriptomic Analysis. PLoS ONE 7(4): e34969. doi:10.1371/journal.pone.0034969
Editor:Marcia B. Aguila, State University of Rio de Janeiro, Biomedical Center, Institute of Biology, Brazil ReceivedNovember 15, 2011;AcceptedMarch 8, 2012;PublishedApril 4, 2012
Copyright:ß2012 Kao et al. This is an open-access article distributed under the terms of the Creative Commons Attribution License, which permits unrestricted use, distribution, and reproduction in any medium, provided the original author and source are credited.
Funding:This work was supported by grants from National Science Council (NSC 100-2324-B-039-001 and NSC100-2320-B-039-020), Committee on Chinese Medicine and Pharmacy at Department of Health (CCMP100-RD-048 and CCMP101-RD-103), and China Medical University (CMU100-S-16, CMU100-S-34, and CMU100-TS-14). The funders had no role in study design, data collection and analysis, decision to publish, or preparation of the manuscript.
Competing Interests:The authors have declared that no competing interests exist. * E-mail: [email protected]
Introduction
Chitosan is a polysaccharide comprising copolymers of glucosamine and N-acetylglucosamine. Chitosan has been used as a dietary supplement for decreasing the body weight and lowering the cholesterol level [1]. It is a food additive and can be used as a flocculant and chelating agent for the clarification of beverages [2]. It is also a biodegradable carbohydrate polymer that has been widely used in the tissue engineering, wound healing, biosensers, and drug release [3–8]. Previous reports showed that chitosan exhibits anti-diabetic, hypocholesteromic, and blood glucose-lowering effects [9–11].In vitrostudies also suggested that chitosan inhibits adipogenesis and differentiation of adipocytes [12,13]. However, the host response to chitosan and the target organs chitosan acted on remain to be clarified.
Peroxisome proliferator-activated receptors (PPARs) are mem-bers of the nuclear hormone receptor superfamily. PPAR heterodimerizes the retinoid X receptors and binds to the PPAR responsive element (PPRE) in the promoter region of target genes [14,15]. So far, three receptor subtypes have been characterized and designated as PPARa, PPARc, and PPAR-b/d. PPAR subtypes have distinct tissue localization and physiological activities. PPARa is expressed in brain and liver. It is a central
regulator of fatty acid catabolism and glucose metabolism [16]. PPARc is predominately expressed in adipose tissue, immune system, and gastrointestinal tract. It is the master regulator of adipogenesis, adipocyte and gut epithelial differentiation, lipid storage, and glucose homeostasis [17]. PPAR-b/dis ubiquitously expressed and plays an important role in regulating energy homeostasis and lipoprotein catabolism [18]. These findings indicate that PPARs are key regulators of lipid and glucose metabolism [19,20].
We have previously applied nuclear factor-kB bioluminescent imaging-guided transcriptomic analysis to assess host responses to biomaterials, ionizing radiation, and chemotherapy drugin vivo
Materials and Methods
Plasmid construction
The 148-bp EcoRI/XhoI fragment containing the herpes simplex virusthymidine kinase(tk) promoter from pTKb(Clontech, Mountain View, CA, USA) was ligated into theEcoRI/XhoI sites of the pBluescriptHII KS (-) vector (Stratagene, La Jolla, CA, USA) to generate pBKS-Ptk. Two oligonucleotides, PPRE sense (59 - TCGACAGGGGACCAGGACAAAGGTCACGTTCGGGAC-39) and PPRE antisense (59 -TCGAGTCCCGAACGT-GACCTTTGTCCTGGTCCCCTG-39) containing the PPRE sequence of the acyl-CoA oxidase gene and carrying the SalI andXhoI restriction sites at the ends, were annealed and ligated to form two (72 bp), three (108 bp), four (144 bp), five (180 bp), six (216 bp), seven (252 bp), and eight (288 bp) tandem repeats of PPRE. The PPRE tandem repeats were then filled in and inserted into the blunted XbaI site of the pBKS-Ptk vector to generate pBKS-PPRE2x-Ptk, pBKS-PPRE3x-Ptk, pBKS-PPRE4x-Ptk, pBKS-PPRE5x-Ptk, pBKS-PPRE6x-Ptk, pBKS-PPRE7x-Ptk, and pBKS-PPRE8x-Ptk. The SmaI/BglII fragments containing thetk
promoter and/or PPRE repeats from aforementioned constructs were then subcloned into theSmaI/BglII sites of the pGL2-Basic vector (Promega, Madison, WI, USA) to generate pGL-PPRE0x-Ptk, pGL-PPRE2x-Ptk, pGL-PPRE3x-Ptk, pGL-PPRE4x-Ptk, pGL-PPRE5x-Ptk, pGL-PPRE6x-Ptk, pGL-PPRE7x-Ptk, and pGL-PPRE8x-Ptk(Figure 1(A)).
Transfection and reporter assays
Human hepatocellular carcinoma HepG2 cells, which were purchased from Bioresource Collection and Research Center (Hsinchu, Taiwan), were maintained in Dulbecco’s modified Eagle’s medium (Life Technologies, Gaithersburg, MD, USA) supplemented with 10% fetal bovine serum at 37uC. Cells were transfected with PPRE reporter constructs and pcDNA3.1/lacZ DNA (Invitrogen, Carlsbad, CA, USA) by SuperFectHtransfection reagent (Qiagen, Valencia, CA, USA). Twenty-four hours later, transfected cells were treated with 0.5mM rosiglitazone maleate (Alexis, San Diego, CA, USA). Luciferase assay and b -galactosi-dase assay were performed as described previously [24,25]. Induction fold was calculated by dividing the relative luciferase unit (RLU) of rosiglitazone-treated cells by the RLU of untreated cells.
Generation of transgenic mice
Plasmid DNA pGL-PPRE5x-Ptk was linearized withNotI and
SalI to generate a 3.1-kb fragment of PPRE transgene for the generation of transgenic mice following pronuclear microinjection of FVB oocytes. Of 18 offspring (F0), six tested positive for PPRE transgene by polymerase chain reaction (PCR) genotyping (primer-P 59 -AACTGCATAAGGCTATGAAGAGA-TACGCCC-39 and primer-M 59 -TTAAAACCGGGAGGTA-GATGAGATGTGACG-39). All transgenic mice were crossed with wild-type F1 mice to yield PPRE heterozygous mice with the FVB genetic background.
Animal experiments
Male transgenic mice (6 to 8 weeks old) were maintained in the room with a 12-h day/12-h night cycle and fed with standard diet
ad libitum. Mice (n= 6/group) were subcutaneously injected saline or 0.2 g/kg chitosan. Chitosan oligosaccharide lactate (MW = 4000–6000, .90% deacetylation) was purchased from Sigma-Aldrich (St. Louis, MO, USA) and dissolved in DDW. For rosiglitazone treatment, six mice were orally administered 50 mg/
kg rosiglitazone. Mice were then imaged for the luciferase activity or sacrificed for microarray analysis at indicated periods.
Mouse experiments were conducted under ethics approval from the China Medical University Animal Ethics Committee (permit number 97-28-N).
In vivoandex vivoimaging of luciferase activity
In vivoandex vivoimaging of luciferase activity was performed as described previously [24,26]. For in vivo imaging, mice were anesthetized with isoflurane and injected intraperitoneally 150 mg/kg D-luciferin. Five minutes later, mice were placed in the chamber and imaged for 1 min with the camera set at the highest sensitivity by IVIS Imaging SystemH200 Series (Xenogen, Hopkinton, MA, USA). Photons emitted from tissues were quantified using Living ImageH software (Xenogen). Signal intensity was quantified as the sum of all detected photon counts from mice and presented as photon/sec. Forex vivoimaging, mice were anesthetized and injected with luciferase intraperitoneally. Five minutes later, mice were sacrificed and tissues were rapidly removed. Tissues were placed in the IVIS system and imaged with the same setting used for in vivo studies. Signal intensity was quantified as the sum of all detected photon counts per second within the region of interest after subtracting the background luminescence and presented as photon/sec/cm2/steradian (pho-ton/sec/cm2/sr).
Microarray analysis
Total RNAs were extracted from brain and stomach as described previously [25]. The RNA sample with a RNA integrity number greater than 7.0 was accepted for microarray analysis.
Microarray analysis was performed as described previously [25]. Briefly, fluorescence-labeled RNA targets were prepared from 5mg of total RNA using MessageAmpTM aRNA kit (Ambion, Austin, TX, USA) and Cy5 dye (Amersham Pharmacia, Piscat-away, NJ, USA). Fluorescent targets were hybridized to the Mouse Whole Genome OneArrayTM(Phalanx Biotech Group, Hsinchu, Taiwan) and scanned by an Axon 4000 scanner (Molecular Devices, Sunnyvale, CA, USA). Three replicates from three independent mice were performed. The Cy5 fluorescent intensity of each spot was analyzed by genepix 4.1 software (Molecular Devices). The signal intensity of each spot was corrected by subtracting background signals in the surrounding. We filtered out spots that signal-to-noise ratio was less than 0 or control probes. Spots that passed these criteria were normalized by the R program in the limma package (http://www.r-project.org/). Genes with fold changes$2.0 or#22.0 were analyzed by Kyoto Encyclo-pedia of Genes and Genomes (KEGG) pathway (http://www. genome.ad.jp/kegg/), which is a knowledge base linking a set of genes with a network of interacting molecules in the cells [27]. We used the WebGestalt tool to test significant KEGG pathways. Microarray data are MIAME compliant and the raw data have been deposited in a MIAME compliant database (Gene Expres-sion Omnibus, accesExpres-sion number GSE33565).
Quantitative real-time PCR (qPCR)
The expression levels of ghrelin, apolipoprotein B (apoB), exportin 4 (xpo4), peptidyl-prolyl cis/trans isomerase NIMA-interacting 1 (pin1), preproenkephalin 1 (penk1), and peroxir-edoxin 2 (prdx2) genes were validated by qPCR. RNA samples were reverse-transcribed for 2 h at 37uC with High Capacity cDNA Reverse Transcription Kit (Applied Biosystems, Foster City, CA, USA). qPCR was performed by using 1ml of cDNA, 26
followed: 10 min at 95uC, and 40 cycles of 15 sec at 95uC, 1 min at 60uC. Each assay was run on an Applied Biosystems 7300 Real-Time PCR system in triplicates. Fold changes were calculated using the comparative CTmethod. The primer set for each gene is
followed: ghrelin forward, 59-GCTGGAGATCAGGTTCAAT GC-39; ghrelin reverse, 59-GTCCGTGGTTACTTGTCAGC-39; apoB forward, 59-TCTGCCTCTTACTACCCACTG-39; apoB reverse, 59-TGTCAACCAAAGACTTGTCCTC-39; xpo4 for-Figure 1. Construction and optimization of PPRE reporter constructs.(A) The schematic diagram of PPRE reporter constructs. Two PPRE oligonucleotides were annealed and ligated to form various tandem repeats of PPRE. The resulting products were analyzed by 8% polyacrylamide gels (left panel). Eight reporter constructs containing various numbers of PPREs were shown on the right. (B) Effect of rosiglitazone on the inducibility of PPRE reporter constructs. HepG2 cells were transiently transfected with PPRE constructs and pcDNA3.1/lacZ DNA, and treated without or with 0.5mM rosiglitazone. Luciferase andb-galactosidase activities were determined 24 hours later. Luciferase activities are expressed as induction fold, which is presented as comparison with RLU related to untreated cells.b-Galactosidase activities are expressed as OD420. Values are mean6standard error of three independent assays. **p,0.01, ***p,0.001, compared with untreated cells. (C) In vitro imaging. HepG2 cells were transiently transfected with PPRE constructs containing 5 tandem repeats of PPRE and treated without or with 0.5mM rosiglitazone. Luciferase activity was imaged at 24 h by IVIS system. The color overlay on the image represents the photon/sec emitted from the cells, as indicated by the color scale. Quantification of photon emission from the cells was shown at the bottom. Values are mean 6standard error of three independent assays. ***p,0.001, compared with mock. Photos are representative images.
wards, 59-AGATACCGCAGCTTCCTGAG-39; xpo4 reverse, 59 -GTGGTCATCTCCGTGTTGTG-39; pin1 forward, 59-ATGGC GGACGAGGAGAAG-39; pin1 reverse, 59- CGAGACTGGCT GTGCTTC-39; penk1 forward, 59-CTTGGGTCCTGCCTCC TG-39; penk1 reverse, 59-GCAAGTGGCTCTCATCCTG-39; prdx2 forward, 59-CGACCATGCTGAGGACTTC-39; prdx2 reverse, 59- TCAACACGCCGTAATTCTGG-39; glyceralde-hyde-3-phosphate dehydrogenase (GAPDH) forward, 59 -ACACC-CACTCCTCCACCTTT-39; GAPDH reverse, 59-TAGCCAAA TTCGTTGTCATACC-39.
Statistical analysis
Data were presented as mean6standard error. Student’st-test was used for comparisons between two experiments. A value of
p,0.05 was considered statistically significant.
Results
Optimization of PPRE reporter constructs
Multiple tandem repeats of PPRE were constructed and cloned upstream thetkpromoter. The resulting PPRE-tkconstructs were then inserted upstream the luciferase gene and droven the expression of luciferase gene (Figure 1(A)). To test which report constructs were significantly induced by rosiglitazone (a PPARc
agonist), we transiently transfected HepG2 cells with various reporter constructs and treated cells with rosiglitazone. As shown in Figure 1(B), rosiglitazone significantly induced the luciferase activity driven by five, six, seven, or eight tandem repeats of PPRE. The maximal induction was observed in HepG2 cells transfected with five or six tandem repeats of PPRE construct. The
b-galactosidase activities were consistent, suggesting that the transfection efficacies were similar in various reporter constructs. Moreover,in vitroimaging showed that bioluminescent signal was significantly induced by rosiglitazone in pGL-PPRE5x-Ptk -trans-fected HepG2 cells (Figure 1(C)). Ciani et al. constructed the luciferase reporter plasmids containing one, two, three, and five tandem repeats of PPRE, and found that the induced luciferase activity is directly proportional to the number of PPREs present in the promoter region [28]. However, the maximal induction of luciferase activity was observed in HepG2 cells transfected with five or six tandem repeats of PPRE construct in this study. Therefore, we selected the construct containing five tandem repeats of PPRE for further experiment, and these findings suggested that induced luciferase activity might not be propor-tional to the number of PPREs.
Characterization of PPRE transgenic mice
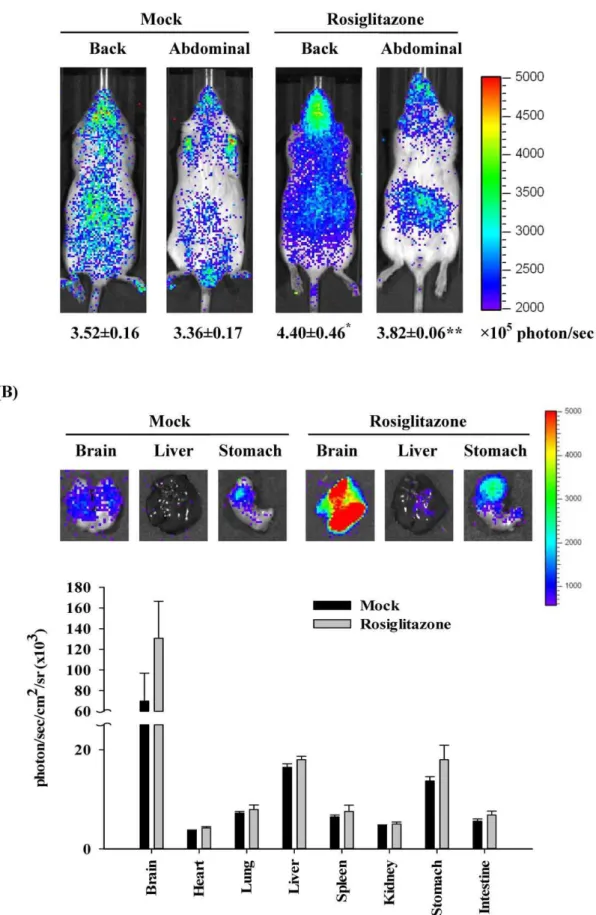
Plasmid DNA pGL-PPRE5x-Ptkwas selected for the generation of transgenic mice following pronuclear microinjection of FVB oocytes. Because the transgene contained a luciferase gene driven by PPRE, the luciferase activity reflected the PPARtrans-activity. To monitor the constitutive and induced PPAR activity, transgenic mice were treated without or with rosiglitazone and imaged 6 hours later. As shown in Figure 2(A), the diffuse luminescence was detected throughout the body and the intense signals were emitted in the head and abdominal region. Administration of rosiglitazone significantly induced the PPAR-dependent luminescent signals in mice. Ex vivo imaging showed that the maximal intensity was observed in the brain, moderate luminescent signals were observed in liver and stomach, and slight intensity was observed in heart, lung, spleen, kidney, and intestine (Figure 2(B)). Administration of rosiglitazone increased the PPAR-dependent luminescent intensity in brain and stomach. These data indicated that endogenous PPAR activities were widely present in
most organs and the greater endogenous PPAR activities were observed in brain, liver, and stomach. Moreover, rosiglitazone activated the PPAR activities in the brain and stomach, which was consistent with previous studies [28], suggesting that PPRE transgenic mice could be applied to report the PPAR activityin vivo.
Assessment of PPAR-driven luminescent signal after chitosan administration by bioluminescent imaging
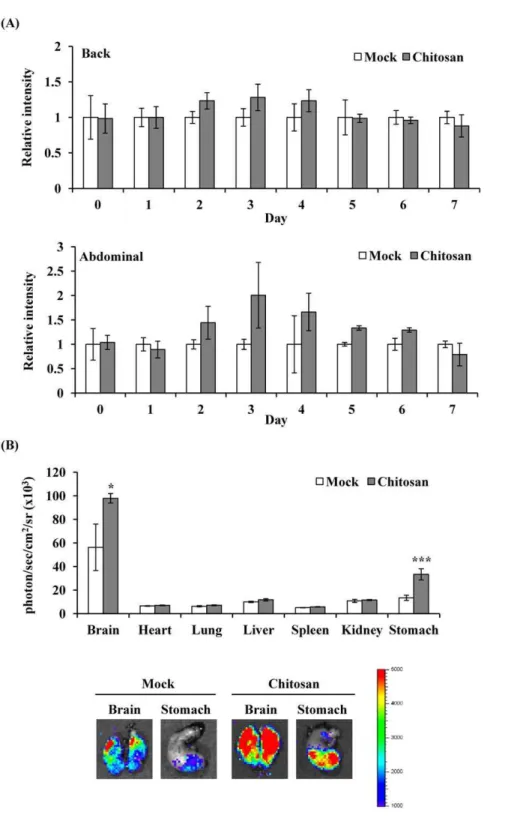
Previous studies have shown that chitosan activates the PPAR activity in adipocytes [13]. We further analyzed thein vivoPPAR activity after chitosan administration and the targeted organs that chitosan acted on by bioluminescent imaging. Figure 3(A) shows that chitosan gradually increased the luminescence intensity, reached a maximal intensity on 3 d, and gradually decreased the luminescent signals. We further sacrificed mice on 3 d after administration, and ex vivo imaging showed that chitosan significantly induced PPAR-dependent bioluminescent signals in brain (1.75 fold) and stomach (2.54 fold) (Figure 3(B)). These findings indicated that administration of chitosan activated PPAR activities in brain and stomach.
Assessment of chitosan-regulated genes in the brain and stomach by transcriptomic analysis
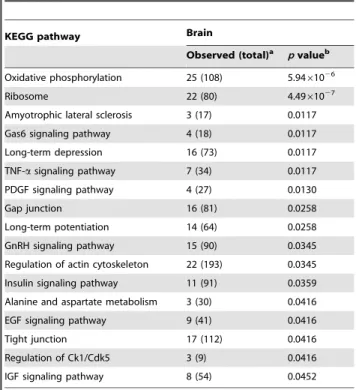
In order to understand the chitosan-induced biological events in brain and stomach, we extracted RNA samples from brain and stomach on 3 d and performed microarray analysis. In a total of 29,922 genes, the transcripts of 154 and 143 genes in the stomach and brain, respectively, passed the aforementioned criteria (Table S1 and Table S2) and selected for KEGG classification. Tables 1 and 2 show the pathways significantly regulated by chitosan in the stomach and brain, respectively. Five pathways, including oxidative phosphorylation, ribosome, GnRH signaling pathway, tumor necrosis factor-a (TNF-a) signaling pathway and insulin signaling pathway, were affected commonly by chitosan in both organs, and oxidative phosphorylation and ribosome pathways were the top two pathways affected by chitosan. The majority of pathways, including oxidative phosphorylation, pyruvate metab-olism, GnRH signaling pathway, glycolysis/gluconeogenesis, benzoate degradation, glycerolipid metabolism, ether lipid metab-olism, glutathione metabmetab-olism, insulin signaling pathway, alanine and aspartate metabolism and IGF signaling pathway, were associated with lipid and glucose metabolism. These data showed that chitosan might alter several pathways involved in lipid and glucose metabolism in brain and stomach.
Verification of the expression levels of chitosan-regulated genes by qPCR
To elucidate which PPAR subtype contributed to the chitosan-affected gene expression profile, we performed Pscan to analyze the PPRE in the promoter regions of chitosan-regulated genes. Pscan is a software that scans promoter sequences of genes with motifs describing the binding specificity of known transcription factors [29]. Over the half of genes contained PPAR-a and/or PPAR-cresponsive elements in their promoter regions, suggesting that the majority of genes were regulated by chitosan via PPAR-a
and/or PPAR-c signaling pathways (data not shown). PPAR-a
standard error (n= 6 per group). *p,0.05, **p,0.01, compared with mock. (B)Ex vivoimaging. Transgenic mice were orally administered saline (mock) or 50 mg/kg rosiglitazone. Six hours later, mice were sacrificed and organs were subjected to image. Quantification of photon emission from the organs was shown at the bottom. Values are mean6standard error (n= 6 per group). Photos are representative images.
doi:10.1371/journal.pone.0034969.g002
Figure 3. PPAR-dependent bioluminescence in living mice and individual organs after chitosan administration.(A) Time course. Transgenic mice were subcutaneously injected saline (mock) or chitosan, and images at indicated periods. Results are expressed as relative intensity, which is presented as comparison with the luminescent intensity relative to mock. Values are mean6standard error (n= 6 per group). (B)Ex vivo
imaging and quantification of photon emission from individual organs. Transgenic mice were subcutaneously injected saline (mock) or chitosan, and sacrificed 3 days later for organ imaging. Values are mean6standard error (n= 6 per group). *p,0.05, ***p,0.001, compared with mock. The color overlay on the image represents the photon/sec emitted from the organs, as indicated by the color scale. Photos are representative images. doi:10.1371/journal.pone.0034969.g003
that chitosan regulated gene expression via PPAR-a and/or PPAR-csignaling pathways.
Ghrelin and apoB are expressed in the stomach and have been shown to be involved in energy and lipid metabolism [30,31]. Microarray data showed that the expressions of ghrelin and apoB genes were downregulated by chitosan in the stomach, with fold changes of29.1360.03 and25.5060.25, respectively (Table S1 and Table S2). We further applied qPCR to validate the transcriptional expression levels of these genes. As shown in Table 3, the expression levels of ghrelin and apoB genes were down-regulated by chitosan, which was consistent with the microarray data.
Discussion
In this study, we found that chitosan significantly activated PPAR activity in brain and stomach. Microarray analysis of brain and stomach further showed that several pathways involved in glucose and lipid metabolism were affected by chitosan. PPARs are ligand-activated nuclear receptors and key regulators of fatty acid and glucose homeostasis [19,20]. In vivoandex vivoimaging showed that maximal luciferase activities were detected in brain and gastrointestinal tract. These data suggested that PPARs were highly expressed in these organs. Previous studies have shown that PPAR activities are activated in brain and gastrointestinal tract, and their activation play important roles in these organs. For examples, in the brain, PPARaplays a major role in acetylcholine biosynthesis and defense against oxidative stress, PPARcregulates the action of dopamine on the gene transcription, and PPARb/d
transcriptionally upregulates the acyl-CoA synthetase 2 and mediates the fatty acid utilization [32]. Additionally, the
constitutive expression of PPARb/din the gastrointestinal tract is very high compared with other tissues. It plays physiological roles in the homeostatic regulation of intestinal cell proliferation/ differentiation and the modulation of inflammation associated with inflammatory bowel disease and colon cancer [33]. Ciani et al (2007) constructed PPAR-luciferase transgenic mice with C57BI/6 genetic background and showed that maximal luciferase activity was detected in the brain and gastrointestinal tract [28]. In this study, we found that PPAR-driven luminescent intensity was strong in the brain and stomach, which was in agreement with previous study. Therefore, these findings suggested that biolumi-nescent imaging of PPAR transgenic mice was capable of reflecting the real-time PPAR activity in living animals.
Chitosan is a nontoxic, antibacterial, biodegradable, and biocompatible biopolymer. It has been widely used in food and biomaterial industries as weight-loss aids, cholesterol-lowering agents, and medical devices, such as bio-scaffolds for tissue engineering, wound healing products, and haemostatic bandages [1,3–8]. Although chitosan is usually administered by an oral route as a dietary supplement, food additive, or oral drug delivery, chitosan would be degraded by gut microflora or influence the distribution and number of gut microflora by oral administration [1,2,34]. Therefore, we administered transgenic mice with chitosan by a parenteral route to avoid the influence of gut microflora. Chitosan induced a maximal intensity on 3 d, and the signal gradually decreased after three days, suggesting that subcutaneous administration of chitosan evoked the PPAR activity, and the induced PPAR activity was decreased to the basal level after 3 days. Administration of chitosan evoked PPAR activations in brain and stomach. These findings suggested that chitosan might affect the biological events in brain and stomach. It Table 1.Classification of chitosan-regulated genes in the
stomach by KEGG pathways.
KEGG pathway Stomach
Observed (total)a pvalueb
Oxidative phosphorylation 38 (108) 8.75610211
Ribosome 20 (80) 2.1761028
Cell communication 21 (109) 6.1161025 IL6 signaling pathway 4 (29) 0.0037 Pyruvate metabolism 11 (37) 0.0040 GnRH signaling pathway 14 (90) 0.0105 TNF-asignaling pathway 3 (34) 0.0105 Glycolysis/Gluconeogenesis 14 (53) 0.0107 Benzoate degradation 2 (7) 0.0215 Glycerolipid metabolism 9 (46) 0.0215 IFNcsignaling pathway 11 (65) 0.0215 LPS signaling pathway 11 (66) 0.0215 Ether lipid metabolism 6 (29) 0.0249 Wnt signaling pathway 14 (144) 0.0325 Glutathione metabolism 9 (41) 0.0363 IL12 signaling pathway 4 (26) 0.0476 Insulin signaling pathway 8 (91) 0.0476
a‘‘Observed’’ means the number of genes regulated by chitosan in this pathway.
‘‘Total’’ means the total number of genes in this pathway.
bp
-Value was calculated on WebGestalt web site (http://bioinfo.vanderbilt.edu/ webgestalt/login.php) by hypergeometric test.
doi:10.1371/journal.pone.0034969.t001
Table 2.Classification of chitosan-regulated genes in the brain by KEGG pathways.
KEGG pathway Brain
Observed (total)a pvalueb
Oxidative phosphorylation 25 (108) 5.9461026
Ribosome 22 (80) 4.4961027
Amyotrophic lateral sclerosis 3 (17) 0.0117 Gas6 signaling pathway 4 (18) 0.0117 Long-term depression 16 (73) 0.0117 TNF-asignaling pathway 7 (34) 0.0117 PDGF signaling pathway 4 (27) 0.0130
Gap junction 16 (81) 0.0258
Long-term potentiation 14 (64) 0.0258 GnRH signaling pathway 15 (90) 0.0345 Regulation of actin cytoskeleton 22 (193) 0.0345 Insulin signaling pathway 11 (91) 0.0359 Alanine and aspartate metabolism 3 (30) 0.0416 EGF signaling pathway 9 (41) 0.0416
Tight junction 17 (112) 0.0416
Regulation of Ck1/Cdk5 3 (9) 0.0416 IGF signaling pathway 8 (54) 0.0452
a‘‘Observed’’ means the number of genes regulated by chitosan in this pathway.
‘‘Total’’ means the total number of genes in this pathway.
bp
-Value was calculated on WebGestalt web site (http://bioinfo.vanderbilt.edu/ webgestalt/login.php) by hypergeometric test.
has been shown that PPARs play important roles in the pathogenesis of various disorders of central nervous system. For examples, activation of PPARs suppresses inflammation in peripheral macrophages and in models of human autoimmune diseases [35]. Activation of all PPAR isoforms has been found to be protective in murine models of multiple sclerosis, Alzheimer’s disease, and Parkinson’s diseases [36,37]. In this study, ex vivo
imaging showed that chitosan activated the PPAR activity in the brain and the KEGG pathway analysis showed that chitosan significantly regulated the expression of genes involved in amyotrophic lateral sclerosis (p= 0.012). These findings suggested that chitosan might exhibit the beneficial effect on the neurode-generative diseases, such as multiple sclerosis, Alzheimer’s disease, and Parkinson’s diseases.
In addition to brain, chitosan also evoked the PPAR activity in the stomach. KEGG pathway analysis further revealed that the half of chitosan-regulated pathways in the stomach was related to glucose or lipid metabolism. It has been shown that chitosan and its derivatives markedly prevent the time course-related rise of serum glucose levels in diabetic mice [38]. Moreover, chitosan is well known for its hypotriglyceridemic and hypocholesterolemic effects [39], and exhibits anti-obesity and anti-diabetic effects [1,9– 11]. Previous studies showed that chitosan and its derivatives may bind to bile salt components and free fatty acids, resulting in the disrupted lipid absorption in the gut and the increased faecal fat excretion [40]. Chitosan also downregulates the adipogenic molecules such as fatty acid binding protein and glucose transporter 4 via PPAR and CCAAT/enhancer-binding protein
a pathways, resulting in the inhibited adipogenesis and differen-tiation of 3T3-L1 adipocytes [12,13]. Additionally, plasma proteome analysis showed that chitosan increases the level of
adiponectin and decreases the levels of obesity-related proteins, such as resistin, retinol-binding protein 4, TNF-aand interleukin-6 (IL-interleukin-6), contributing to the anti-diabetic and anti-obesity potentials in ob/ob mice [10]. Our data showed that chitosan significantly regulated the IL-6 and TNF-asignaling pathways in the guts, which were consistent with previous findings. Moreover, we newly identified that chitosan significantly regulated the glucose metabolic pathways, such as glycolysis/gluconeogenesis and insulin signaling pathway, which might contribute to the hypoglycemic effect of chitosan.
Microarray data showed that chitosan downregulated the expressions of apoB and ghrelin genes in the stomach. ApoB, a large amphipathic protein, is mainly expressed in the liver and is present on very-low density lipoproteins (VLDL), intermediate density lipoproteins, and low-density lipoproteins. ApoB is required for the formation of VLDL in the liver. Binding of apoB to the microsomal transport protein results in the incorporation of lipids into the apoB molecule and leads to the formation of VLDL particles [30,41]. In clinical practice, apoB can be used as a marker to estimate the total number of atherogenic lipoprotein particles [42]. Elevated apoB is a hallmark of several inherited disorders associated with atherosclerosis [43]. However, patients with extremely low levels of apoB seem to be protected against cardiovascular diseases [44]. Because apoB is an essential component of lipoprotein, the down-regulated expression of apoB gene by chitosan might contribute to the hypotriglyceridemic and hypocholesterolemic effects of chitosan. Ghrelin is a peptide hormone mainly produced by the stomach. Ghrelin is a potent stimulator of growth hormone secretion [45]. Moreover, it is the only circulatory hormone that potently enhances the feeding and weight gain, increases the gastrointestinal mobility, and regulates Table 3.Expression levels of ghrelin, apoB, xpo4, pin1, penk1, and prdx2 genes by qPCR.
Samplea Average C
Tof target Average CTof GAPDH DCTb DDCTc Relative to mock
Ghrelin
Mock 17.7760.02 17.5660.02 0.2160.03 0.0060.03 1.00
Chitosan 21.2060.02 17.5760.01 3.6360.02 3.4260.02 0.09 ApoB
Mock 26.1460.02 17.5660.02 8.5860.03 0.0060.03 1.00
Chitosan 29.0260.05 17.5760.01 11.4560.05 2.8660.05 0.13 Xpo4
Mock 27.2060.11 18.5660.10 8.6460.15 0.0060.15 1.00
Chitosan 26.8160.07 18.9360.05 7.8860.09 20.7660.09 1.70 Pin1
Mock 24.1160.02 18.5660.10 5.5460.10 0.0060.10 1.00
Chitosan 24.0460.04 18.9360.05 5.1160.07 20.4360.07 1.35 Penk1
Mock 25.0760.04 18.3960.04 6.6860.06 0.0060.06 1.00
Chitosan 22.3660.06 17.7660.10 4.6060.12 22.0860.12 4.23 Prdx2
Mock 22.0060.00 18.3960.04 3.6160.04 0.0060.04 1.00
Chitosan 20.2560.07 17.7660.10 2.4960.12 21.1260.12 2.18
aThe RNAs from stomach (ghrelin, apoB, xpo4, and pin1 genes) and brain (penk1 and prdx2 genes) were analyzed for indicated genes by qPCR. bThe
DCTvalue is determined by subtracting the average CTof GAPDH from that of target gene. The standard deviation of the difference is calculated from the standard
deviations of the target gene and GAPDH.
cThe calculation ofDDC
Tinvolves subtraction by theDCTcalibrator value. This is a subtraction of an arbitrary constant, so the standard deviation ofDDCTis the same as
the standard deviation of theDCTvalue.
doi:10.1371/journal.pone.0034969.t003
the energy homeostasis [30,45]. Furthermore, ghrelin-based components may have therapeutic effects in treating malnutrition [31]. Because ghrelin has a great impact on the food intake or body weight, the down-regulated expression of ghrelin gene by chitosan might explain why chitosan exhibited the anti-obestic effect.
In conclusion, we applied PPAR bioluminescent imaging-guided transcriptomic analysis to evaluate the organs that chitosan acted on and to analyze the molecular mechanisms of chitosan in this study. We found that administration of chitosan induced the PPAR-driven bioluminescent signals in brain and stomach. Microarray analysis showed that several pathways associated with lipid and glucose metabolism were regulated by chitosan. Moreover, we newly identified that chitosan may exhibit hypocholestemic and anti-obestic effects via downregulated expression of apoB and ghrelin genes. These findings suggested the feasibility of PPAR bioluminescent imaging-guided transcrip-tomic analysis on the evaluation of chitosan-affected metabolic
responsesin vivo. Moreover, we newly identified that downregu-lated expression of apoB and ghrelin genes were the novel mechanisms for chitosan-affected metabolic responsesin vivo.
Supporting Information
Table S1 Expression levels of chitosan-regulated genes in the stomach.
(PDF)
Table S2 Expression levels of chitosan-regulated genes in the brain.
(PDF)
Author Contributions
Conceived and designed the experiments: CHK TYH. Performed the experiments: CYH. Analyzed the data: CYH TYH. Wrote the paper: CHK CYH TYH.
References
1. Mhurchu CN, Dunshea-Mooij C, Bennett D, Rodgers A (2005) Effect of chitosan on weight loss in overweight and obese individuals: a systematic review of randomized controlled trials. Obes Rev 6: 35–42.
2. Baldrick P (2010) The safety of chitosan as a pharmaceutical excipient. Regul Toxicol Pharmacol 56: 290–299.
3. Khor E, Lim LY (2003) Implantable applications of chitin and chitosan. Biomaterials 24: 2339–2349.
4. Jayakumar R, Chennazhi KP, Muzzarelli RAA, Tamura H, Nair SV, et al. (2010) Chitosan conjugated DNA nanoparticles in gene therapy. Carbohydr Polym 79: 1–8.
5. Jayakumar R, Menon D, Manzoor K, Nair SV, Tamura H (2010) Biomedical applications of chitin and chitosan based nanomaterials - a short review. Carbohydr Polym 82: 227–232.
6. Jayakumar R, Nair SV, Selvamurugan N, Prabaharan M, Tokura S, et al. (2010) Novel carboxymethyl derivatives of chitin and chitosan materials and their biomedical applications. Prog Mater Sci 55: 675–709.
7. Jayakumar R, Prabaharan M, Nair SV, Tamura H (2010) Novel chitin and chitosan nanofibers in biomedical applications. Biotechnol Adv 28: 142–150. 8. Jayakumar R, Prabaharan M, Sudheesh Kumar PT, Nair SV, et al. (2011)
Biomaterials based on chitin and chitosan in wound dressing applications. Biotechnol Adv 29: 322–337.
9. Baker WL, Tercius A, Anglade M, White CM, Coleman CI (2009) A meta-analysis evaluating the impact of chitosan on serum lipids in hypercholester-olemic patients. Ann Nutr Metab 55: 368–374.
10. Kumar SG, Rahman MA, Lee SH, Hwang HS, Kim HA, et al. (2009) Plasma proteome analysis for anti-obesity and anti-diabetic potentials of chitosan oligosaccharides inob/obmice. Proteomics 9: 2149–2162.
11. Liu SH, Chang YH, Chiang MT (2010) Chitosan reduces gluconeogenesis and increases glucose uptake in skeletal muscle in streptozotocin-induced diabetic rats. J Agric Food Chem 58: 5795–5800.
12. Cho EJ, Rahman MA, Kim SW, Baek YM, Hwang HJ, et al. (2008) Chitosan oligosaccharides inhibit adipogenesis in 3T3-L1 adipocytes. J Microbiol Biotechnol 18: 80–87.
13. Rahman A, Kumar SG, Kim SW, Hwang HJ, Baek YM, et al. (2008) Proteomic analysis for inhibitory effect of chitosan oligosaccharides on 3T3-L1 adipocyte differentiation. Proteomics 8: 569–581.
14. Escher P, Wahli W (2000) Peroxisome proliferator-activated receptors: insight into multiple cellular functions. Mutat Res 448: 121–138.
15. Perissi V, Rosenfeld MG (2005) Controlling nuclear receptors: the circular logic of cofactor cycles. Nat Rev Mol Cell Biol 6: 542–554.
16. Shah A, Rader DJ, Millar JS (2010) The effect of PPAR-a agonism on apolipoprotein metabolism in humans. Atherosclerosis 210: 35–40.
17. Martin H (2010) Role of PPAR-cin inflammation. Prospects for therapeutic intervention by food components. Mutat Res 690: 57–63.
18. Coll T, Rodrı¨guez-Calvo R, Barroso E, Serrano L, Eyre E, et al. (2009) Peroxisome proliferator-activated receptor (PPAR) b/d: a new potential therapeutic target for the treatment of metabolic syndrome. Curr Mol Pharmacol 2: 46–55.
19. Bensinger SJ, Tontonoz P (2008) Integration of metabolism and inflammation by lipid-activated nuclear receptors. Nature 454: 470–477.
20. Cho MC, Lee K, Paik SG, Yoon DY (2008) Peroxisome proliferators-activated receptor (PPAR) modulators and metabolic disorders. PPAR Res 2008: 679137. 21. Hsiang CY, Chen YS, Ho TY (2009) Nuclear factor-kB bioluminescence imaging-guided transcriptomic analysis for the assessment of host-biomaterial interactionin vivo. Biomaterials 30: 3042–3049.
22. Chang CT, Lin H, Ho TY, Li CC, Lo HY, et al. (2011) Comprehensive assessment of host responses to ionizing radiation by nuclear factor-kB bioluminescence imaging-guided transcriptomic analysis. PLoS ONE 6: e23682. 23. Chang CT, Ho TY, Lin H, Liang JA, Huang HC, et al. (2012) 5-Fluorouracil induced intestinal mucositis via nuclear factor-kB activation by transcriptomic analysis andin vivobioluminescence imaging. PLoS ONE 7: e31808. 24. Wu SL, Chen JC, Li CC, Lo HY, Ho TY, et al. (2009) Vanillin improves and
prevents trinitrobenzene sulfonic acid-induced colitis in mice. J Pharmacol Exp Ther 330: 370–376.
25. Cheng WY, Lien JC, Hsiang CY, Wu SL, Li CC, et al. (2009) Comprehensive evaluation of a novel nuclear factor-kB inhibitor, quinoclamine, by transcrip-tomic analysis. Brit J Pharmacol 157: 746–756.
26. Ho TY, Chen YS, Hsiang CY (2007) Noninvasive nuclear factor-kB bioluminescence imaging for the assessment of host-biomaterial interaction in transgenic mice. Biomaterials 28: 4370–4377.
27. Kanehisa M, Goto S, Furumichi M, Tanabe M, Hirakawa M (2009) KEGG for representation and analysis of molecular networks involving diseases and drugs. Nucleic Acids Res 38: D355–360.
28. Ciana P, Biserni A, Tatangelo L, Tiveron C, Sciarroni AF, et al. (2007) A novel peroxisome proliferator-activated receptor responsive element-luciferase report-er mouse reveals gendreport-er specificity of preport-eroxisome prolifreport-erator-activated receptor activity in liver. Mol Endocrinol 21: 388–400.
29. Zambelli F, Pesole G, Pavesi G (2009) Pscan: finding over-represented transcription factor binding site motifs in sequences from regulated or co-expressed genes. Nucleic Acids Res 37: W247–252.
30. Kim E, Young SG (1998) Genetically modified mice for the study of apolipoprotein B. J Lipid Res 39: 703–723.
31. Castaneda TR, Tong J, Datta R, Culler M, Tschop MH (2010) Ghrelin in the regulation of body weight and metabolism. Front Neuroendocrinol 31: 44–60. 32. Heneka MT, Landreth GE (2007) PPARs in the brain. Biochim Biophys Acta
1771: 1031–1045.
33. Peters JM, Hollingshead HE, Gonzalez FJ (2008) Role of peroxisome-proliferator-activated receptorb/d(PPARb/d) in gastrointestinal tract function and disease. Clin Sci 115: 107–127.
34. Jarmila V, Vavrı´kova´ E (2011) Chitosan derivatives with antimicrobial, antitumour and antioxidant activities - a review. Curr Pharm Des 7: 3596–3607. 35. Lovett-Racke AE, Hussain RZ, Northrop S, Choy J, Rocchini A, et al. (2004) Peroxisome proliferator-activated receptor alpha agonists as therapy for autoimmune disease. J Immunol 172: 5790–5798.
36. Kummer MP, Heneka MT (2008) PPARs in Alzheimer’s Disease. PPAR Res 2008: 403896.
37. Schintu N, Frau L, Ibba M, Caboni P, Garau A, et al. (2009) PPAR-c-mediated neuroprotection in a chronic mouse model of Parkinson’s disease. Eur J Neurosci 29: 954–963.
38. Hayashi K, Ito M (2002) Antidiabetic action of low molecular weight chitosan in genetically obese diabetic KK-Ay mice. Biol Pharm Bull 25: 188–192. 39. Sumiyoshi M, Kimura Y (2006) Low molecular weight chitosan inhibits obesity
induced by feeding a high-fat diet long-term in mice. J Pharm Pharmacol 58: 201–207.
40. Kanauchi O, Deuchi K, Imasato Y, Shizukuishi M, Kobayashi E (1995) Mechanism for the inhibition of fat digestion by chitosan and for the synergistic effect of ascorbate. Biosci Biotechnol Biochem 59: 786–790.
41. Lenich C, Brecher P, Makrides S, Chobanian A, Zannis VI (1988) Apolipoprotein gene expression in the rabbit: abundance, size, and distribution of apolipoprotein mRNA species in different tissues. J Lipid Res 29: 755–764. 42. Sniderman AD (2005) Apolipoprotein B versus non-high-density lipoprotein
43. Rosenson RS (2009) Management of non-high-density lipoprotein abnormali-ties. Atherosclerosis 207: 328–335.
44. Benn M (2009) Apolipoprotein B levels, APOB alleles, and risk of ischemic cardiovascular disease in the general population, a review. Atherosclerosis 206: 17–30.
45. Kojima M, Hosoda H, Date Y, Nakazato M, Matsuo H, et al. (1999) Ghrelin is a growth-hormone-releasing acylated peptide from stomach. Nature 402: 656–660.