Dynamic Metabolite Profiling in an Archaeon
Connects Transcriptional Regulation to
Metabolic Consequences
Horia Todor1, Jessica Gooding2, Olga R. Ilkayeva2, Amy K. Schmid1,3,4*
1Department of Biology, Duke University, Durham, North Carolina, United States of America,2Sarah W. Stedman Nutrition and Metabolism Center, Duke Molecular Physiology Institute, Departments of
Pharmacology and Cancer Biology and Medicine, Duke University Medical Center, Durham, North Carolina, United States of America,3University Program in Genetics and Genomics, Duke University, Durham, North Carolina, United States of America,4Center for Systems Biology, Duke University, Durham, North Carolina, United States of America
*amy.schmid@duke.edu
Abstract
Previous work demonstrated that the TrmB transcription factor is responsible for regulating the expression of many enzyme-coding genes in the hypersaline-adapted archaeon Halo-bacterium salinarumvia a direct interaction with acis-regulatory sequence in their promot-ers. This interaction is abolished in the presence of glucose. Although much is known about the effects of TrmB at the transcriptional level, it remains unclear whether and to what extent changes in mRNA levels directly affect metabolite levels. In order to address this question, here we performed a high-resolution metabolite profiling time course during a change in nutrients using a combination of targeted and untargeted methods in wild-type andΔtrmB strain backgrounds. We found that TrmB-mediated transcriptional changes resulted in wide-spread and significant changes to metabolite levels across the metabolic network. Addition-ally, the pattern of growth complementation using various purines suggests that the mis-regulation of gluconeogenesis in theΔtrmBmutant strain in the absence of glucose results in low phosphoribosylpyrophosphate (PRPP) levels. We confirmed these low PRPP levels using a quantitative mass spectrometric technique and found that they are associated with a metabolic block inde novopurine synthesis, which is partially responsible for the growth defect of theΔtrmBmutant strain in the absence of glucose. In conclusion, we show how transcriptional regulation of metabolism affects metabolite levels and ultimately,
phenotypes.
Introduction
The regulation of metabolism is a key challenge faced by all organisms. In unpredictable and fluctuating environments, cells must produce the same metabolic outputs to thrive. Although many central metabolic processes are well conserved across many species [1] and have been
OPEN ACCESS
Citation:Todor H, Gooding J, Ilkayeva OR, Schmid AK (2015) Dynamic Metabolite Profiling in an Archaeon Connects Transcriptional Regulation to Metabolic Consequences. PLoS ONE 10(8): e0135693. doi:10.1371/journal.pone.0135693
Editor:Ivan Berg, University of Freiburg, GERMANY
Received:May 5, 2015
Accepted:July 24, 2015
Published:August 18, 2015
Copyright:© 2015 Todor et al. This is an open access article distributed under the terms of the
Creative Commons Attribution License, which permits unrestricted use, distribution, and reproduction in any medium, provided the original author and source are credited.
Data Availability Statement:All relevant data are within the paper and its Supporting Information files.
Funding:This material is based upon work supported by the National Science Foundation (nsf. gov) under grant numbers 1052290 and MCB-1417750 to AKS, by Duke University (duke.edu) startup funds to AKS, and by the National Institutes of Health (nih.gov) under grant number K01-GM109320-02 to JG. The funders had no role in study design, data collection and analysis, decision to publish, or preparation of the manuscript.
thoroughly characterized, variations of these canonical pathways and peripheral metabolic pro-cesses have not been extensively studied. The availability of high-throughput untargeted meta-bolomics techniques such as LC-MS/MS has led to a better understanding of the metabolic abilities and preferences of different microbes [2]. However, a complete understanding of metabolism and its regulation is still missing in many understudied organisms such as the archaea. Although archaea represent much of the microbial diversity in many environments, relatively little is known about their metabolism and its regulation. Previous work on archaeal metabolism suggests that allosteric regulation of enzymes is limited compared to the allosteric regulation of enzymes in eukaryotes and bacteria [3], suggesting an important role for tran-scriptional regulation. For example, haloarchaeal glutamate dehydrogenase does not respond to ADP and GDP [4], and pyruvate kinase fromH.salinarum, an enzyme functioning at a cen-tral branch point in metabolism, exhibits only limited allosteric regulation [5]. Despite the importance of transcriptional regulation in controlling enzyme levels and flux through metabo-lism, a global analysis of the effects of transcription on metabolism has not yet been performed. Such an analysis can provide a deeper understanding of how cells respond to nutrient perturba-tions and how these changes affect the physiology of the organism.
Previous work identified the TrmB family of transcriptional regulators as regulators of car-bon metabolism. Biochemical assays in the hyperthermophilic archaeonPyrococcus furiosus
demonstrated that TrmB binds DNA in the absence of its inducing sugar. Depending on the position of the TrmBcis-regulatory sequence relative to the transcription start site, TrmB can both activate and repress transcription [6]. A TrmB homologue in the related hyperthermo-phileThermococcus kodakarensis, was shown to function as a global transcriptional regulator of gluconeogenic and glycolytic pathways [7]. In the hypersaline-adapted model archaeal spe-cies,Halobacterium salinarum, TrmB functions as a central regulator of carbon metabolism. TrmB directly regulates over 100 genes in the absence of glucose [8] and indirectly affects the expression of 182 genes. Many of these genes encode enzymes involved in diverse metabolic pathways such as gluconeogenesis, amino acid metabolism, cobalamin (vitamin B12) synthesis and purine synthesis. Despite sharing a common regulator, dynamic gene expression profiling suggests that these pathways are differentially regulated by TrmB and other regulators [9], which raises the possibility that TrmB is a global metabolic regulator. When bound to DNA, TrmB activates the expression of some genes, including genes encoding enzymes involved in gluconeogenesis and represses the expression of other genes, such as those encoding enzymes involved in glycolysis [8]. The addition of glucose abolishes TrmB-DNA binding, likely via a conformational change caused by a direct interaction with TrmB [8,10]. The abolition of TrmB binding results in de-repression of repressed genes and de-activation of previously activated genes. A strain harboring an in-frame deletion oftrmB(ΔtrmB) has been generated [8]. This strain exhibits altered gene expression, impaired growth, and other abnormal physiology in the absence of glucose. Since TrmB does not bind DNA in the presence of glucose, theΔtrmB
mutant strain exhibits wild-type growth rate and physiology when glucose is added to the medium [8].
Intriguingly, previous work suggests thatH.salinarumcannot metabolize glucose for energy. No active transport of glucose [11] has been shown; no phosphofructokinase gene or enzyme activity [12,13] has been found; glucose cannot be used as the sole carbon source [14];
andH.salinarumcannot convert13C labeled glucose to13C labeled pyruvate [13]. In a previous
study, we addressed this contradiction by showing that TrmB transcriptionally regulates the production of sugars used to glycosylate the S-layer cell surface protein [15]. Additionally, we demonstrated that TrmB–DNA binding is well correlated with growth rate because S-layer gly-cosylation is proportional to growth. These observations suggested that TrmB transcriptional
regulation of peripheral pathways such as purine, cobalamin, and aromatic amino biosynthesis provides a growth rate input into their specialized regulatory subnetworks [15].
Although the gene expression changes caused by TrmB and their evolutionary rationale have been explored [8,9,15], it remains unclear whether TrmB affects metabolite levels and, if so, how these changes are connected to the morphological and growth defects observed in the
ΔtrmBmutant strain under gluconeogenic conditions. Because TrmB regulates a large and diverse regulon, understanding how mis-regulation of these genes affects metabolism can reveal novel enzymes and hitherto unrecognized connections between metabolic pathways. For these reasons, here we conducted metabolomics profiling experiments in theΔtrmBmutant strain and theΔura3isogenic parent strain over a time course of 10 hours, which included a glucose stimulus. By interpreting the time course metabolite data in the context of previously collected dynamic gene expression and TrmB-DNA binding measurements [9], we investigated which changes in metabolite levels are caused by shifts in gene expression, and which changes in metabolite levels drive shifts in gene expression and physiology. We found that TrmB-medi-ated changes in gene expression are both directly and indirectly associTrmB-medi-ated with significant shifts in metabolite levels across the metabolic network. Additionally, clustering of temporal metabolite patterns in both strains revealed significant enrichment of functional categories in specific clusters, suggesting that the metabolic modularity observed at the transcriptional level [9] continues at the metabolite level. In addition to a general understanding of metabolite changes, our data also provided insights into the functioning and regulation of certain path-ways. Specifically, we found that the down-regulation of genes encoding gluconeogenic enzymes in theΔtrmBmutant strain in the absence of glucose leads to a defect in phosphoribo-sylpyrophosphate (PRPP) production, which causes a metabolic block in purine biosynthesis. We present evidence suggesting that this metabolic block is responsible for the up-regulation of genes encoding enzymes involved in purine synthesis in theΔtrmBmutant strain in the absence of glucose. This block in purine synthesis is partially responsible for the growth defect of theΔtrmBmutant strain in the absence of glucose. Taken together, these results further both a general understanding of the effects of transcriptional regulation on metabolite level and a deeper understanding of the regulation of specific pathways.
Results and Discussion
TrmB-driven transcriptional regulation directly and specifically affects
the levels of certain metabolites
Many metabolic processes are regulated both transcriptionally and post-transcriptionally inH.
salinarumand other archaea [3,9,16]. Therefore, in order to determine whether and how
reproducibility between different cultures, extraction solvents, and detection methods. Based on the regression fit of the untargeted GC-MS to the targeted data (Fig 1), previously quantified gamma-glutamyl cysteine levels [20], and previously quantified NAD levels [21], metabolites with intracellular concentrations in or below the single millimolar range were detected by all three of the untargeted assays (S1 Table). Taken together, these data suggest that metabolomics profiling inH.salinarumis a reproducible and sensitive method for assessing intracellular metabolite concentrations (Fig 1), and validated the untargeted data to be used in subsequent analyses.
A total of 125 metabolites were detected in the untargeted samples. Of these, 91 were posi-tively ascribed to known compounds and classified into 8 pathways (Table 1,S1 Table). The temporal profiles of all 125 metabolites were grouped into 6 clusters using hierarchical cluster-ing in order to determine their response to glucose perturbation and the dependence of this response on TrmB (Fig 2,S1 Fig). We found that metabolites in specific pathways were signifi-cantly enriched in certain clusters (Table 2,S2 Table). Additionally, while some clusters showed similar patterns in theΔtrmBknockout mutant and theΔura3isogenic parent strain, many showed distinct patterns between strains (Fig 2,S1 Fig,S2 Fig). Specifically, cluster 3, which is significantly enriched for nucleotides such as adenosine and guanosine (p<0.005)
and cluster 4, which is significantly enriched in peptides (p<0.01) exhibited the most
Fig 1. Correlation of untargeted and targeted metabolite measurements.Untargeted metabolite levels are well correlated with targeted measurements of amino acids and organic acids. Each data point on the graph corresponds to a timepoint, metabolite, and strain (n = 162; 2 strains, 9 metabolites, 9 timepoints). Each metabolite is shown using a different symbol (see legend). Detections in theΔura3strain are shown in black and detections in theΔtrmB strain are shown in red. Log-log linear regression of targeted and untargeted concentrations is shown in grey.
doi:10.1371/journal.pone.0135693.g001
significant differences between theΔtrmBknockout mutant and theΔura3isogenic parent strain in the absence of glucose but not in its presence (S2 Fig). Both cluster 3 and cluster 4 include unidentified metabolites (S2 Table), suggesting that TrmB may be involved in the regu-lation of unidentified metabolic pathways. In contrast to these clusters, cluster 5 metabolites exhibited a similar level between theΔtrmBmutant strain and theΔura3isogenic parent strain in the absence of glucose, but diverged after the addition of glucose (Fig 2,S1 Fig). This pattern may be due to different amino acids remaining in the media due to the mis-regulated metabo-lism of theΔtrmBmutant strain. Consistent with this hypothesis, many of the metabolites in cluster 5 are branched chain amino acids and their derivatives, which are known to be metabo-lized during midlogarithmic phase [22]. The previously observed difference in sugar levels [15] between theΔtrmBmutant strain and theΔura3isogenic parent strain in the absence of glu-cose was not recapitulated in the untargeted dynamic data (cluster 2). This is because the filter-based sample collection method used to harvest the samples for untargeted dynamic analysis resulted in ~3 fold more dilute samples than the centrifugation-based method used to collect the samples for the previous study [15], resulting in a lack of carbohydrate detections in this study prior to the addition of glucose. Specifically, prior to glucose addition only 145 out of a possible 390 peaks (13 compounds, 2 strains, 5 replicates, 3 timepoints) were detected for com-pounds annotated as carbohydrates (S1 Table). Nevertheless, the overall number and quantity of metabolites detected was similar across the two strains (S1 Table), ruling out the possibility that the observed differences in metabolite levels were simply due to systemic deficiencies in theΔtrmBmutant. Together, these data suggest that TrmB, a transcription factor regulating metabolic enzyme-coding genes [8,9], is required to maintain wild-type metabolite levels in specific pathways, including purines, peptides, and unknown pathways during nutrient perturbations.
Temporal dynamics of growth recovery
In order to understand how changes in metabolite levels affect the physiology ofH.salinarum
before and after the addition of glucose, we sampled the optical density of the cultures of the
ΔtrmBmutant strain and theΔura3isogenic parent strain every 10 minutes before, during, and after the addition of glucose during mid-log growth in CDM (Materials and Methods). We cal-culated the instantaneous growth rate during each of these 10 minute periods in order to deter-mine how growth rate changes after the addition of glucose. The addition of glucose to the
Δura3isogenic parent did not appear to cause a significant change in growth rate (Fig 3A,S3 Fig). In contrast, the growth rate of theΔtrmBmutant strain is low prior to the addition of
Table 1. Metabolites detected using untargeted methods.
Pathway Number
Unidentified 34
Amino acid 34
Lipids 16
Carbohydrate 13
Cofactors, Prosthetic Groups, Electron Carriers 7
Xenobiotics 7
Nucleotide 6
Peptide 6
Secondary metabolism 2
glucose, but recovers to a level similar to that of theΔura3isogenic parent strain approximately 200 minutes after glucose addition (Fig 3B,S3 Fig).
In order to determine which metabolites may be linked to changes in growth rate, we calcu-lated the correlation between the level of each metabolite at each time point in each strain and the instantaneous growth rate at those time points in those strains. Seven of the 125 metabolites were significantly anticorrelated with growth rate, including three gamma-glutamyl amino acids as well as unidentified metabolites (Table 3). Based on the presence of many gamma-glu-tamyl amino acids as well as 5-oxoproline in our data set, it appears thatH.salinarum pos-sesses a functional gamma-glutamyl cycle [23]. Although the function of this gamma-glutamyl cycle in the haloarchaea remains to be uncovered, gamma-glutamylcysteine, a key intermedi-ate, was found to be the major low molecular weight thiol inH.salinarum[20], functioning like glutathione to buffer redox stress. Additionally, gamma-glutamylcysteine was shown to be required for tolerance of certain redox stresses in the related halophileHaloferax volcanii[24]. These observations suggest that the anticorrelation between gamma-glutamyl amino acid levels and growth rate may be due to increased activity of the gamma-glutamyl cycle related to the redox imbalance experienced by theΔtrmBmutant strain in the absence of glucose [8], although further experiments are required to test this possibility. Five of the 125 metabolites detected were significantly correlated with instantaneous growth rate, with the metabolite pro-files matching the growth propro-files in both strain backgrounds (Table 3). These included purine compounds (e.g. adenosine, guanosine, NAD+), suggesting that a defect in purine metabolism may contribute to the growth defect of theΔtrmBknockout mutant strain.
Purine synthesis is negatively regulated by purine levels
Since TrmB is a transcriptional regulator that has been shown to bind near the promoter of some of genes encoding enzymes involved inde novopurine synthesis [8], we reasoned that the defect in purine levels we observed in theΔtrmBmutant in the absence of glucose (Fig 2, Cluster 3,S1 Fig) may be due to mis-regulation of genes encoding purine synthesis enzymes due to the lack of TrmB. In order to address this question, the expression levels of genes encod-ing enzymes involved in purine biosynthesis (data from [9]) were compared to the purine metabolite levels (Fig 4, Materials and Methods) in both theΔtrmBmutant strain and its iso-genicΔura3parent strain. The previously published expression data were collected over the
Fig 2. Clustering of metabolite patterns.Figure depicts six clusters of metabolite patterns. Logged, mean-scaled and normalized combinedΔura3(black lines) andΔtrmB(red lines) data are shown. Each cluster graph depicts metabolite data for individual metabolites across 5 biological replicate cultures (thinner lines) and the mean expression profile for the cluster (thicker lines). Arrow depicts when glucose was added to a final concentration of 5%.
doi:10.1371/journal.pone.0135693.g002
Table 2. Significance of enrichment of functional categories in clusters of metabolite patterns.
Cluster Pathway Correctedp-value
Cluster 1 N/A 6.65E-06
Cluster 2 Carbohydrate 6.08E-09
Cluster 3 Xenobiotics 0.000901
Nucleotide 0.003562
Secondary metabolism 0
Cluster 4 Peptide 0.008786
Cluster 5 Lipids 0.00306
Peptide 0.004867
Cluster 6 Amino acid 1.90E-06
Fig 3. Growth rate during glucose addition.Instantaneous growth rate of theΔura3parent strain (A) and
ΔtrmBmutant strain (B) during the glucose addition (black lines) and control (grey lines) time course. Cells were grown in Complete Defined Medium (CDM). Error bars represent the standard error from the mean of 3 biological replicate cultures.
doi:10.1371/journal.pone.0135693.g003
same time course and growth conditions as the metabolite levels measured here, so these data could be compared at each time point. A strong negative correlation (R2>0.55,p<10−3,Fig
4A) was detected between gene expression and purine level across both strains and nutrient conditions. This suggests that, although previous high throughput TF-DNA binding experi-ments detected weak TrmB binding at purine biosynthesis genes [8], TrmB plays an indirect role in regulating the expression of genes encoding enzymes involved in purine synthesis, con-sistent with insights gleaned from dynamic gene expression profiles [9]. The negative correla-tion observed is consistent with the hypothesis that the transcripcorrela-tion of purine synthesis genes is negatively regulated by the availability of purines through a different transcription factor or another mechanism, similar to what has been observed inEscherichia coliandSaccharomyces
cerevisiae[25,26] and consistent with inferences from our dynamic transcriptomic data [9].
Interpreted in this light, the elevated expression of genes coding for enzymes involved in purine biosynthesis and the lack of purines in theΔtrmBstrain in the absence of glucose suggest a metabolic block inde novopurine biosynthesis (Fig 4B and 4C), perhaps caused by the role of TrmB in regulating gluconeogenesis to produce precursors to purine biosynthesis [27].
A defect in purine synthesis is partially responsible for the
Δ
trmB
growth
defect under gluconeogenic conditions
In order to test the hypothesis that the growth defect of theΔtrmBmutant strain in the absence of glucose,Fig 3) may be caused by inhibited purine synthesis due to a metabolic block, we assayed the growth of theΔtrmBmutant and its isogenic parent strainΔura3in response to purine addition (Materials and Methods). Previous work has shown that purines are readily taken up byH.salinarumand integrated into biomass and nucleic acids [21]. Adenosine signif-icantly, but incompletely, complemented the growth defect of theΔtrmBstrain in the absence of glucose (p<0.01,Fig 5A,Table 4). Once taken up by the cell, adenosine is converted to
ino-sine monophosphate (IMP). IMP can be converted to either GMP or AMP. These nucleotides can then be assimilated into RNA, phosphorylated to tri-nucleotides and otherwise function in the cell (Fig 5B, 21). Although adenosine partially complemented the growth defect of the
ΔtrmBstrain in the absence of glucose, adenine did not (Fig 5A,Table 4). Since the enzymatic activity of adenine phosphoribosyltransferase, which uses PRPP to phosphoribosylate adenine into AMP (Fig 5B), has been detected inH.salinarum[21], and since the gene encoding ade-nine phosphoribosyltransferase (VNG0559G) is expressed at the same level in both strains
Table 3. Metabolites significantly correlated with growth rate in theΔtrmBmutant strain and theΔura3isogenic parent strain.
Correlation R2 Correctedp-Value
X - 16071 Negative 0.5128 4.800E-02
X - 16682 Negative 0.5763 1.300E-02
N-acetylthreonine Negative 0.5927 9.000E-03
tryptophanol Negative 0.6294 3.800E-03
gamma-glutamylvaline Negative 0.6441 2.600E-03
gamma-glutamylalanine Negative 0.668 1.400E-03
gamma-glutamyl-2-aminobutyrate Negative 0.7107 4.000E-04
X - 20525 Positive 0.5379 2.920E-02
NAD+ Positive 0.5915 9.200E-03
adenosine Positive 0.6444 2.600E-03
guanosine Positive 0.6667 1.400E-03
N-carbamoylaspartate Positive 0.6687 1.300E-03
Fig 4. Levels of purine metabolites and purine synthesis genes.(A) Expression of genes encoding enzymes involved inde novopurine synthesis is negatively correlated to intracellular purine levels. Each point represents the average of the log-transformed, mean-centered and normalized gene expression in purine synthesis genes (X-axis, Materials and Methods, [9]) plotted against the average of the log-transformed, mean-centered and normalized level of adenosine and guanosine (Y-axis, Materials and Methods) in theΔura3parent strain andΔtrmBmutant strain at each timepoint (n = 20; ten timepoints, two
regardless of glucose level (S4 Fig, [8]), these data suggest that there is insufficient PRPP pres-ent to phosphoribosylate the adenine into AMP to complempres-ent the growth defect. Guanosine was also unable to complement the growth defect of theΔtrmBstrain in the absence of glucose (Fig 5A,Table 4), likely becauseH.salinarumlacks GMP reductase activity, which is required to convert GMP from guanosine to AMP [21]. Interestingly, supplementation with guanine causes no change in the growth of theΔura3isogenic parent strain, but appears to adversely affect the growth of theΔtrmBknockout (p<4x10⁻⁵,Fig 5A,Table 4). This observation is
con-sistent with guanine addition further decreasing PRPP levels (and hence AMP levels) via increased competition for PRPP by guanine phosphoribosyltransferase. Since GMP cannot be converted to AMP, this would result in a decrease in effective purine concentration if PRPP concentration is limiting. Taken together, these data suggest that PRPP levels are depressed in theΔtrmBmutant in the absence of glucose. Since PRPP is required in the absence of purine supplementation for the initial step ofde novopurine biosynthesis, a defect in PRPP contrib-utes to the defect in purine levels in theΔtrmBmutant in the absence of glucose, partially con-tributing to theΔtrmBgrowth defect.
PRPP is found at a low level in
Δ
trmB
mutant strain in the absence of
glucose
PRPP and most other polar compounds were not detected in our untargeted metabolomics studies due to diversion of the first minute of the LC column to avoid buildup of salt inside the instrument. Therefore, in order to determine if PRPP limitation is associated with the growth defect of theΔtrmBmutant growing in the absence of glucose, we assayed PRPP levels using a targeted LC-MS method [28] in theΔtrmBmutant strain and itsΔura3isogenic parent strain in the presence and absence of glucose. We detected PRPP in theΔtrmBmutant strain with glucose andΔura3isogenic parent strain with or without glucose but not in theΔtrmBmutant strain in the absence of glucose, suggesting that PRPP levels were significantly lower in the
ΔtrmBmutant strain grown without glucose (Fig 6). Taken together with the gene expression and growth complementation data (Figs4and5), this observation strongly suggests that a defi-ciency in PRPP, the precursor ofde novopurine synthesis, contributes partially to the growth defect of theΔtrmBmutant strain in the absence of glucose.
Recent work suggests that halophiles generate PRPP via a modified oxidative pentose phos-phate pathway (OPPP) proceeding from glucose-6-phosphos-phate, to 6-phosphogluconate, ribu-lose-5-phosphate, ribose-5-phosphate and ultimately to PRPP [29]. In order to determine which of these steps is inhibited in theΔtrmBmutant strain in the absence of glucose, we com-pared the expression level of the genes encoding the enzymes involved in each step of the path-way in both theΔura3andΔtrmBmutant strains in the presence and absence of glucose from previously collected transcriptomic data ([9],Fig 7). The expression of all genes encoding enzymes in the OPPP was either significantly higher or the same in theΔtrmBmutant strain in the absence of glucose compared to theΔura3parent strain and theΔtrmBstrain in the pres-ence of glucose (Fig 7). These observations suggest that the lack of PRPP in theΔtrmBmutant strain in the absence of glucose is due to insufficient levels of glucose-6-phosphate rather than transcriptional downregulation of the OPPP. This hypothesis is consistent with the role of
strains). Error bars represent standard error from the mean of the 11 genes or the 2 metabolites. Dotted trendline represents the linear regression between purine level and the expression of genes encoding enzymes involved in purine synthesis. (B) Temporal profile of the expression of genes encoding enzymes involved in purine synthesis (Materials and Methods, [9]) over the glucose stimulus time course in theΔura3 (black lines) andΔtrmB(red lines) strains. (C) Temporal profile of purine levels over the metabolomics time course in theΔura3(black lines) andΔtrmB(red lines) strains (Materials and Methods).
Fig 5. Growth complementation with purine compounds.(A) The average growth potential (Materials and Methods) of theΔura3parent strain (dark bars) andΔtrmBmutant strain (light bars) in complete defined medium (CDM), CDM supplemented with 5% glucose (CDM+ Gluc), and CDM supplemented with 100μM of adenine (CDM+Ade), adenosine (CDM+AdeN), guanine (CDM+Gua), and guanosine (CDM+GuaN). Error bars represent the standard error from the mean of 7 biological replicate cultures. (B) Simplified diagram of purine salvage inH.salinarumadapted from [21].
TrmB as the sole, direct activator of genes encoding enzymes involved in gluconeogenesis [8,9] required to maintain sufficient glucose levels as well as with previously described deficiency in sugar levels in theΔtrmBmutant strain in the absence of glucose [15].
Conclusions
Understanding the regulation of metabolism in archaea remains a central challenge to success-fully tapping the vast reservoir of pathways and compounds in these organisms for industrial applications. Previous studies have identified TrmB as a central transcriptional regulator of metabolism inH.salinarum. In order to understand how transcriptional regulation of enzyme coding genes affects metabolism, we performed targeted and untargeted measurements of the metabolome ofH.salinarumduring a change in nutrient conditions. We found that the tran-scriptional regulation causes substantial changes in intracellular metabolite levels, which cause changes in physiology. Specifically, we identified a metabolic block inde novopurine synthesis in theΔtrmBmutant strain in the absence of glucose, which is partially responsible for the observed growth rate defect. Combining dynamic metabolite and gene expression data, we showed that this block was due to a defect in PRPP caused by mis-regulation of genes encoding enzymes involved in gluconeogenesis and therefore a lack of OPPP substrates. Taken together, these data suggest that transcriptional regulation of enzyme coding genes is an important mechanism for regulating metabolism.
Materials and Methods
Strains
Halobacterium salinarumNRC-1 (ATCC strain 700922) was used as the wild-type strain
back-ground. Experiments were performed in two previously constructed strains, one containing an in-frame deletion ofVNG1451C(Δura3ΔtrmB, [8]) and its isogenic parent strain,Δura3 [30].
Growth conditions and growth rate calculation
Cells were grown routinely in Complete Defined Medium (CDM) containing 19 amino acids [9] as indicated in the figures. The medium was supplemented with 50μg ml-1uracil to
com-plement theura3deletion. Cultures were routinely grown at 42°C while shaking at 225 r.p.m. under low ambient light.
In order to assess instantaneous growth rate during glucose addition, 200μl cultures of the
ΔtrmBmutant strain and its isogenic parent strainΔura3 were grown at 42°C under continu-ous shaking (~225 r.p.m.) in a Bioscreen C automated growth curve analysis system (Growth Curves USA, Piscataway, NJ) to mid-logarithmic phase. Glucose, sucrose control, or nothing was added to the wells once mid-logarithmic phase was reached. Optical density at 600 nm was measured every 10 minutes for each sample during the duration of the experiment.
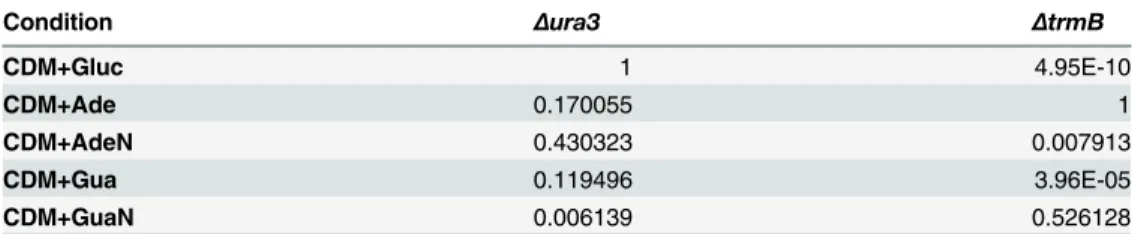
Table 4. Bonferroni correctedp-values of the T-test of difference in growth compared to complete defined medium (CDM) without additives.
Condition Δura3 ΔtrmB
CDM+Gluc 1 4.95E-10
CDM+Ade 0.170055 1
CDM+AdeN 0.430323 0.007913
CDM+Gua 0.119496 3.96E-05
CDM+GuaN 0.006139 0.526128
Instantaneous growth rate was calculated from the log transformed and LOWESS-smoothed data using the bsd Analysis Function previously described [15]. In order to account for osmotic effects, instantaneous growth rate in the cultures to which glucose was added was calculated by adding the difference of the glucose and sucrose instantaneous growth rates at each time point to the growth rate of the untreated control.
To measure the growth of theΔtrmBmutant strain and its isogenic parent strainΔura3 in CDM supplemented with 100μM concentration of the purines indicated inFig 5, 200μl
cul-tures were grown in a Bioscreen C as described above except that optical density at 600 nm was measured every 30 minutes. Area under the log-transformed growth curve (growth potential) was used as the growth metric to convey information about both growth rate and carrying capacity of the culture. These calculations are packaged into the bsd Analysis Function previ-ously described [15].
Fig 6. PRPP levels in theΔura3andΔtrmBstrains with and without glucose.PRPP levels detected in theΔura3parent strain (dark bars) and theΔtrmBmutant strain (light bars). Error bars represent the standard error from the mean of 8 biological replicate cultures. Detection limit calculated from a standard curve is shown as a dashed grey line.
doi:10.1371/journal.pone.0135693.g006
Fig 7. Expression of OPPP enzyme-coding genes in theΔura3andΔtrmBstrains with and without glucose.The expression of genes encoding enzymes involved in the OPPP is not deficient in theΔtrmB mutant in the absence of glucose. Bar plots show log10 gene expression normalized to theΔura3parent strain in the absence of glucose for genes encoding each step in the OPPP (data from [8]) in theΔura3parent strain (dark bars) andΔtrmBmutant strain (light bars) in the absence and presence of glucose. Error bars represent standard error from the mean of at least 5 microarrays.
Collection and quantification of metabolomics time course samples
Cells were grown to mid-logarithmic phase (OD ~ 0.3) in CDM as described above. For meta-bolomics time courses, 10 ml aliquots were removed from the continuously shaking cultures of both theΔura3andΔtrmBstrains at time points as indicated inTable 5. Cells were immedi-ately filtered using a Millipore SteriFlip 0.22μm filter and washed with 10 ml basal salts media.
SinceH.salinarumlyses readily in methanol and other solvents because of its requirement for high salinity, cells were lysed on the membrane filter using 1 ml of ice-cold 80% methanol with extraction standards, ice-cold 100% methanol with extraction standards, or 1 ml 50% acetoni-trile with 0.3% Formic acid as indicated (Table 5). Samples were immediately snap frozen at -80°C. Untargeted samples were analyzed at Metabolon Corp. (Durham, NC), and targeted samples were analyzed at the Stedman Center for Nutrition and Metabolism, Duke Molecular Physiology Institute (Durham, NC) using previously validated methods (Table 5; [18,19,28,
31]). For both the untargeted samples measured at Metabolon and the samples used for the purine panel, the first minute of the LC column was diverted to avoid salt buildup in the instrument.
Table 5. Summary of metabolite extraction and quantitation methods.
Method Time Points Analyzed
Replicates Method Details Extraction
Solvent
Analysis Reference
Targeted OA Panel
-60, 0, 5, 10, 20, 45, 90, 180, 360
Δura3–6 replicates, ΔtrmB–2
replicates
Organic acids were quantified using methods described previously [19] employing Trace Ultra GC coupled to ISQ MS operating under Xcalibur 2.2 (Thermo Fisher Scientific, Austin, TX).
50% Acetonitrile + 0.3% Formic Acid
[19]
Targeted AA Panel
-60, 0, 5, 10, 20, 45, 90, 180, 360
Δura3–6 replicates, ΔtrmB–2
replicates
Amino acids were quantified byflow injection tandem mass spectrometry using sample preparation methods described [18]. Data were acquired using a Waters Acquity UPLC system equipped with a TQ (triple quadrupole) detector and a data system controlled by MassLynx 4.1 operating system (Waters, Milford, MA).
50% Acetonitrile + 0.3% Formic Acid
[18]
Untargeted LC/MS pos
-240, -60, 0, 5, 10, 20, 45, 90, 180, 360
5 replicates Measurements were performed by UPLC-MS/MS (positive mode) using a Waters Acquity UPLC with an acidic mobile phase (solvent A: 0.1% formic acid in H2O, solvent B: 0.1% formic acid in methanol) on a 2.1 × 100 mm Waters BEH C18 1.7μm particle column and a Thermo-Finnigan linear trap quadrupole mass spectrometer as described previously [31].
80% Methanol [31]
Untargeted LC/MS neg
-240, -60, 0, 5, 10, 20, 45, 90, 180, 360
5 replicates Measurements were performed by UPLC-MS/MS (positive mode) using a Waters Acquity UPLC with a basic mobile phase (solvent A: 6.5 mM ammonium bicarbonate pH 8.0, solvent B: 6.5 mM ammonium bicarbonate in 98% methanol) on a 2.1 × 100 mm Waters BEH C18 1.7μm particle column and a Thermo-Finnigan linear trap quadrupole mass spectrometer as described previously [31].
80% Methanol [31]
Untargeted GC/MS
-240, -60, 0, 5, 10, 20, 45, 90, 180, 360
5 replicates Measurements were performed on a Thermo-Finnigan Trace DSQ fast-scanning single-quadrupole mass spectrometer. Electron impact ionization at 70 eV was used and the column temperature was ramped between 60 and 340°C with helium as carrier gas as previously described [31].
80% Methanol [31]
Purine Panel +Glucose,-Glucose
8 replicates Samples were quantified as previously described [28] using a reverse-phase ion-pairing method. PRPP was detected by the fragmentation of 389 m/z to 177 m/z at a fragmentor voltage of 105 V and collision energy of 18 V.
100% Methanol [28]
doi:10.1371/journal.pone.0135693.t005
Normalization, outlier removal, and clustering of untargeted data
Each sample from the untargeted GC and LC-MS data was normalized by the coefficients of a linear regression between its log-transformed values and the mean of all log-transformed sam-ples. Outlier removal was performed after normalization using Dixon’s test with ap-value cut-off of 0.05 for each metabolite in each strain at each time point. Remaining data were averaged for each time point, strain and metabolite. For a given time point, when a metabolite was not detected in any of the 5 replicates, the minimum value of the metabolite from the remaining data was used as the value for that time point. The log-transformed scaled and centered metab-olite measurements were clustered by hierarchical clustering with 6 clusters using the complete linkage method. P-values of significant differences betweenΔura3parent strain and theΔtrmB
mutant strain were calculated using a Welch’s two sided T-test at each timepoint for each clus-ter (S2 Fig). Enrichment within each cluster was calculated using a Bonferroni corrected hyper-geometric test on the categories provided by Metabolon for each metabolite.
Analysis of purine metabolites and purine genes
The log-transformed, mean-centered and normalized time course gene expression data [9] for genes encoding enzymes involved in purine synthesis (prsA,purB,purC,purD,purE,purF,
purH,purK,purl,purL2,purM,purU,VNG2371C) were averaged at each time point during the
glucose addition time course in theΔtrmBmutant strain andΔura3parent strain (n = 20). These measurements were correlated using a linear model to the averaged log-transformed mean-centered and normalized data for guanosine and adenosine measured at the same time points.
Supporting Information
S1 Fig. Heatmap representation of metabolite patterns.Figure depicts six clusters of metabo-lite patterns. Logged, mean-scaled and normalized combinedΔura3(right) andΔtrmB(left) data are shown. Cluster 1 is shown in black, cluster 2 is shown in red, cluster 3 is shown in blue, cluster 4 is shown in green, cluster 5 is shown in orange and cluster 6 is shown in yellow. (PDF)
S2 Fig.p-values of difference between theΔura3andΔtrmBstrains for each of the six clus-ters.Figure depicts the negative log10p-value (higher value is more significant) of the T-test between metabolite levels in theΔura3andΔtrmBstrains for each of the six clusters of metabo-lite patterns at each time point. Arrow depicts when glucose was added to a final concentration of 5%.
(PDF)
S3 Fig. Optical density over the course of glucose additon.Mean optical density of 3 biologi-cal replicate cultures of theΔura3parent strain (A) andΔtrmBmutant strain (B) during the glucose addition (black lines), control (dark grey lines), and sucrose control (light grey lines) time course. Cells were grown in Complete Defined Medium (CDM).
(PDF)
S4 Fig. Expression of the gene encoding adenine phosphoribosyltransferase in theΔura3
bars represent standard error from the mean of at least 5 microarrays. (PDF)
S1 Table. Raw and normalized untargeted metabolite data used in the study.
(XLSX)
S2 Table. Metabolites in each of the six clusters.
(XLSX)
Acknowledgments
We would like to acknowledge Dr. Christopher B. Newgard, Duke Molecular Physiology Insti-tute, for helpful conversations and for his support of metabolomics profiling in archaea.
Author Contributions
Conceived and designed the experiments: HT AKS. Performed the experiments: HT JG ORI. Analyzed the data: HT. Contributed reagents/materials/analysis tools: HT JG ORI AKS. Wrote the paper: HT AKS.
References
1. Cunchillos C, Lecointre G (2005) Integrating the universal metabolism into a phylogenetic analysis. Mol Biol Evol 22: 1–11. PMID:15356277
2. Patti GJ, Yanes O, Siuzdak G (2012) Innovation: Metabolomics: the apogee of the omics trilogy. Nat Rev Mol Cell Biol 13: 263–269. doi:10.1038/nrm3314PMID:22436749
3. Siebers B, Schonheit P (2005) Unusual pathways and enzymes of central carbohydrate metabolism in Archaea. Curr Opin Microbiol 8: 695–705. PMID:16256419
4. Leicht W, Werber MM, Eisenberg H (1978) Purification and characterization of glutamate dehydroge-nase fromHalobacteriumof the Dead Sea. Biochemistry 17: 4004–4010. PMID:708691
5. de Médicis E, Laliberté J-F, Vass-Marengo J (1982) Purification and properties of pyruvate kinase from Halobacterium cutirubrum. Biochimica et Biophysica Acta (BBA)—Protein Structure and Molecular Enzymology 708: 57–67.
6. Lee SJ, Engelmann A, Horlacher R, Qu Q, Vierke G, et al. (2003) TrmB, a sugar-specific transcriptional regulator of the trehalose/maltose ABC transporter from the hyperthermophilic archaeon Thermococ-cus litoralis. J Biol Chem 278: 983–990. PMID:12426307
7. Kanai T, Akerboom J, Takedomi S, van de Werken HJ, Blombach F, et al. (2007) A global transcrip-tional regulator inThermococcus kodakaraensiscontrols the expression levels of both glycolytic and gluconeogenic enzyme-encoding genes. J Biol Chem 282: 33659–33670. PMID:17875647 8. Schmid AK, Reiss DJ, Pan M, Koide T, Baliga NS (2009) A single transcription factor regulates
evolu-tionarily diverse but functionally linked metabolic pathways in response to nutrient availability. Mol Syst Biol 5: 282. doi:10.1038/msb.2009.40PMID:19536205
9. Todor H, Sharma K, Pittman AM, Schmid AK (2013) Protein-DNA binding dynamics predict transcrip-tional response to nutrients in archaea. Nucleic Acids Res 41: 8546–8558. doi:10.1093/nar/gkt659 PMID:23892291
10. Krug M, Lee SJ, Boos W, Diederichs K, Welte W (2013) The three-dimensional structure of TrmB, a transcriptional regulator of dual function in the hyperthermophilic archaeonPyrococcus furiosusin com-plex with sucrose. Protein Sci 22: 800–808. doi:10.1002/pro.2263PMID:23576322
11. Severina L.O. NVP, and Plakunov V.K. (1990) Glucose transport into the extremely halophilic archae-bacteria. Arch Microbiol 155: 131–136.
12. Ng WV, Kennedy SP, Mahairas GG, Berquist B, Pan M, et al. (2000) Genome sequence of Halobacter-ium species NRC-1. Proc Natl Acad Sci U S A 97: 12176–12181. PMID:11016950
13. Sonawat HM, Srivastava S, Swaminathan S, Govil G (1990) Glycolysis and Entner-Doudoroff path-ways inHalobacterium halobium: some new observations based on 13C NMR spectroscopy. Biochem Biophys Res Commun 173: 358–362. PMID:2256927
14. Gochnauer MB, Kushner DJ (1969) Growth and nutrition of extremely halophilic bacteria. Can J Micro-biol 15: 1157–1165. PMID:5370997
15. Todor H, Dulmage K, Gillum N, Bain JR, Muehlbauer MJ, et al. (2014) A transcription factor links growth rate and metabolism in the hypersaline adapted archaeonHalobacterium salinarum. Mol Microbiol 93: 1172–1182. doi:10.1111/mmi.12726PMID:25060603
16. Esser D, Pham TK, Reimann J, Albers SV, Siebers B, et al. (2012) Change of carbon source causes dramatic effects in the phospho-proteome of the archaeonSulfolobus solfataricus. J Proteome Res 11: 4823–4833. doi:10.1021/pr300190kPMID:22639831
17. Villas-Boas SG, Hojer-Pedersen J, Akesson M, Smedsgaard J, Nielsen J (2005) Global metabolite analysis of yeast: evaluation of sample preparation methods. Yeast 22: 1155–1169. PMID:16240456 18. Ferrara CT, Wang P, Neto EC, Stevens RD, Bain JR, et al. (2008) Genetic networks of liver metabolism
revealed by integration of metabolic and transcriptional profiling. PLoS Genet 4: e1000034. doi:10. 1371/journal.pgen.1000034PMID:18369453
19. Jensen MV, Joseph JW, Ilkayeva O, Burgess S, Lu D, et al. (2006) Compensatory responses to pyru-vate carboxylase suppression in islet beta-cells. Preservation of glucose-stimulated insulin secretion. J Biol Chem 281: 22342–22351. PMID:16740637
20. Newton GL, Javor B (1985) gamma-Glutamylcysteine and thiosulfate are the major low-molecular-weight thiols in halobacteria. J Bacteriol 161: 438–441. PMID:2857165
21. Stuer-Lauridsen B, Nygaard P (1998) Purine salvage in two halophilic archaea: characterization of sal-vage pathways and isolation of mutants resistant to purine analogs. J Bacteriol 180: 457–463. PMID:
9457844
22. Gonzalez O, Gronau S, Pfeiffer F, Mendoza E, Zimmer R, et al. (2009) Systems analysis of bioenerget-ics and growth of the extreme halophileHalobacterium salinarum. PLoS Comput Biol 5: e1000332. doi: 10.1371/journal.pcbi.1000332PMID:19401785
23. Orlowski M, Meister A (1970) The gamma-glutamyl cycle: a possible transport system for amino acids. Proc Natl Acad Sci U S A 67: 1248–1255. PMID:5274454
24. Malki L, Yanku M, Borovok I, Cohen G, Mevarech M, et al. (2009) Identification and characterization of gshA, a gene encoding the glutamate-cysteine ligase in the halophilic archaeonHaloferax volcanii. J Bacteriol 191: 5196–5204. doi:10.1128/JB.00297-09PMID:19525351
25. Cho BK, Federowicz SA, Embree M, Park YS, Kim D, et al. (2011) The PurR regulon inEscherichia coli K-12 MG1655. Nucleic Acids Res 39: 6456–6464. doi:10.1093/nar/gkr307PMID:21572102
26. Pinson B, Vaur S, Sagot I, Coulpier F, Lemoine S, et al. (2009) Metabolic intermediates selectively stim-ulate transcription factor interaction and modstim-ulate phosphate and purine pathways. Genes Dev 23: 1399–1407. doi:10.1101/gad.521809PMID:19528318
27. Gonzalez O, Gronau S, Falb M, Pfeiffer F, Mendoza E, et al. (2008) Reconstruction, modeling & analy-sis ofHalobacterium salinarum R-1metabolism. Mol Biosyst 4: 148–159. doi:10.1039/b715203e PMID:18213408
28. Sinha RA, Farah BL, Singh BK, Siddique MM, Li Y, et al. (2014) Caffeine stimulates hepatic lipid metab-olism by the autophagy-lysosomal pathway in mice. Hepatology 59: 1366–1380. doi:10.1002/hep.
26667PMID:23929677
29. Pickl A, Schonheit P (2015) The oxidative pentose phosphate pathway in the haloarchaeonHaloferax volcaniiinvolves a novel type of glucose-6-phosphate dehydrogenase—The archaeal Zwischenfer-ment. FEBS Lett 589: 1105–1111. doi:10.1016/j.febslet.2015.03.026PMID:25836736
30. Peck RF, Dassarma S, Krebs MP (2000) Homologous gene knockout in the archaeonHalobacterium salinarumwith ura3 as a counterselectable marker. Mol Microbiol 35: 667–676. PMID:10672188 31. Albrecht E, Waldenberger M, Krumsiek J, Evans A, Jeratsch U, et al. (2014) Metabolite profiling reveals
new insights into the regulation of serum urate in humans. Metabolomics 10: 141–151. PMID: