109
Pakistan Veterinary Journal
ISSN: 0253-8318 (PRINT), 2074-7764 (ONLINE)Accessible at: www.pvj.com.pk
The Effect of Fish Size and Condition on the Contents of Twelve Essential and Non Essential
Elements in
Aristichthys nobilis
M. Naeem*, A. Salam, S. S. Tahir1 and N. Rauf 1
Institute of Pure and Applied Biology, Bahauddin Zakariya University, Multan 60800; 1Central Laboratory for Environmental Analysis, Pakistan Environmental Protection Agency, Islamabad, Pakistan
*Corresponding author: [email protected]
A R T I C L E H I S T O R Y A B S T R A C T
Received: Revised: Accepted:
November 29, 2010 January 03, 2011 January 07, 2011
Key words:
Aristichthys nobilis Metal Composition Fish size
Condition factor Predictive equation
The correlation coefficients between fish size (body weight and total length) and metal contents (Na, K, Ca, Mg, Mn, Fe, Cu, Zn, Cr, Co, Cd and Pb) in whole fish (Aristichthys nobilis) were determined. A total of 71 fish samples were collected from hatcheries and fish reservoirs located in Islamabad and Fatehjung. Highly significant (P<0.001) relationship between metal concentrations and fish size was found. Most of the metals (Na, K, Ca, Mg, Cu, Zn, Cr, Cd and Pb) showed an isometric increase, while Mn, Fe and Co showed an allometric increase in with increasing body weight. All metals showed isometric increase, while, Na, Mn, Fe, Cu, and Co showed positive allometric growth in relation to total length. The correlation coefficient (r) between different variables and wet body weight, condition factor was found highly significant (P<0.001) in examined fish except for Na, Ca, Cu, Zn, Cd and Pb while for total length the same results found except Ca, Cd, Zn and Pb. Variance inflation factor values of regression coefficients in multiple regression analysis for each variable were lesser than 10. The metal levels of the examined fish were lower than the recommended values in fish and fishery products set by FAO.
©2011 PVJ. All rights reserved
To Cite This Article: Naeem M, A Salam, SS Tahir and N Rauf, 2011. The effect of fish size and condition on the
contents of twelve essential and non essential elements in Aristichthys nobilis from Pakistan. Pak Vet J, 31(2): 109-112.
INTRODUCTION
In aquatic environment, fish reflects the effects of numerous interacting biotic and abiotic factors. Mostly the variation in elemental concentration in fish tissue has been attributed to variation in size and age (Phillips, 1980). Many studies have focused attention on the dependence between the contents of metals and the size (weight and length) of these fish (Kroupa and Hartvich, 1990; Falandysz, 1994; Kostecki, 2000). Variation of elemental concentration in fish tissue due to size has been reported (Salam et al., 2002; Canli and Atli, 2002; Farkas et al., 2003; Luczynska and Tonska, 2006; Promya and Chitmanat,2011). Jezierska and Witeska (2001) reported that smaller younger fish accumulate more metal (except mercury) than larger, older fish, which may stem from the higher metabolic rate.
There are many other factors which influence elemental concentration levels in fish. These include seasonal differences in fish metabolic rate which determines the physiological condition of fish (Kargin,
1996; Farkas et al., 2002; Ashraf et al., 2011). Variation in elemental concentration depending on condition of fish is due to relative dilution effect of lipid content of tissues (Farkas et al., 2002). According to Farkas et al. (2003), concentration of trace metals in fish is influenced in a remarkable degree by the physiological condition of organisms. This is an important for comparative bio-monitoring studies. The concentrations themselves are the result of uptake and release processes, with elements characteristic kinetics and their biological half time (Von Burg and Greenwood, 1991). It helps to study the environmental dependent variation in the levels of toxic metals found in culture-able fish and to initiate correlation studies related to percent trace metals level in whole body of fish in relation to body size and condition factor. It also generates a realistic picture of the bioaccumulation pattern of the metals in this species.
This study investigates relationship of fish size and nutritional quality, occurrence of trace metals and further identifies the optimum size, i.e. total length and body weight, of this species suitable for human consumption.
Pak Vet J, 2011, 31(2): 109-112.
110
MATERIALS AND METHODS
A total of 71 Bighead carp (Aristichthys nobilis) of body length ranging from 8.8-47.81 cm and body weight from 6.86-1766.0 g were sampled from reservoir of Fish Seed Hatchery Islamabad and Nursery unit Shahpur, Fathejang during the month of April, 1997 using a cast net and were transported live to the laboratory. Each fish was weighed and length was measured before further experimentation. Each fish was dried whole to a constant weight in a drying oven (Gallen Kamp, England) at 50-60°C.
Analytical reagent grade chemicals supplied by Merck were used without further purification for the purpose of elemental analysis. Selected elements for analysis were Na, K, Ca, Mg, Mn, Fe, Cu, Zn, Cr, Co, Cd and Pb. One gram of dried fish powder sample was ashed in a muffle furnace at 500°C for 6 hours. The ash contents were digested in 10 mL (70%) HNO3 on a hot plate at 82-100°C, heated to dryness and diluted up to 25 mL with deionized water. These solutions were aspirated into atomic absorption spectrophotometer and absorbance measurement was used for each element in flame atomization mode as described by manufacturer. Elemental concentrations were computed by a computer program CPFAAS (Ansari and Iqbal, 1993).
As variation in elemental concentration are related to body weight, total length and condition factor, the inter-relationships of these variables are examined by the following multiple regression model:
Y = a + b1 W + b2 X
Where a, intercept: b1, b2 are regression coefficients (slopes), W is wet body weight and X is either total length (TL) or condition factor (K) and Y is different body constituents. Additionally, Pearson correlation coefficients (r) between these variables were estimated. VIF (Variance inflation factor) are used as an indicator of multi-collinearity. The VIF for each independent variable should be less than 10. Regression analysis and calculation of correlation coefficients were carried out with the help of a computer package (Lotus 1-2-3). Paired t test was applied to know the differences between various elements tested in wet and dry carcasses. Statistical analyses for coefficient of determination for multiple regression analysis (MRA) were performed using Minitab statistical package program.
RESULTS
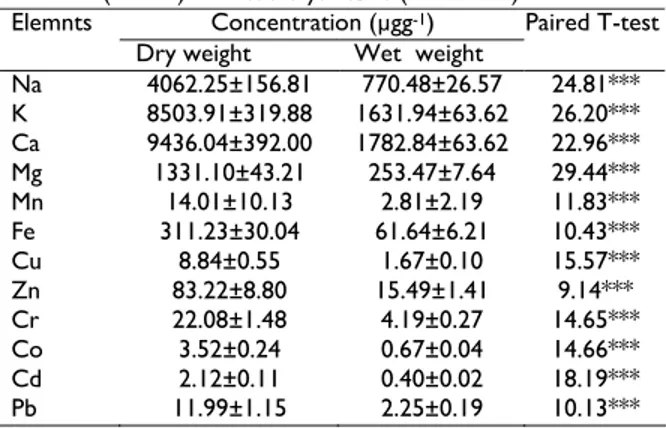
The values of various elemental concentrations found in the carcasses of Aristichthys nobilis (whole fish on dry and wet weight basis) are given in Table 1. In this study, Ca showed the highest, while Cd showed the lowest mean values in both wet and dry body weight. Highly significant (P<0.001) difference between elemental composition in wet and dry body weight of fish was found (Table 1).
It was observed total quantity of metals (Na, K, Ca, Mg, Cu, Zn, Cr, Cd and Pb) increased isometrically (b=1.0) while Mn, Fe and Co showed positive allometric (b>1.0) growth with increasing body weight (Table 2). It was observed thatK, Ca, Mg, Zn, Cr, Cd and Pb showed isometric growth (b=3.0). However, Na, Mn, Fe, Cu, and Co showed positive allometry (b>3.0) with increasing
body length. Predictive models have been found to be highly significant (Table 3).
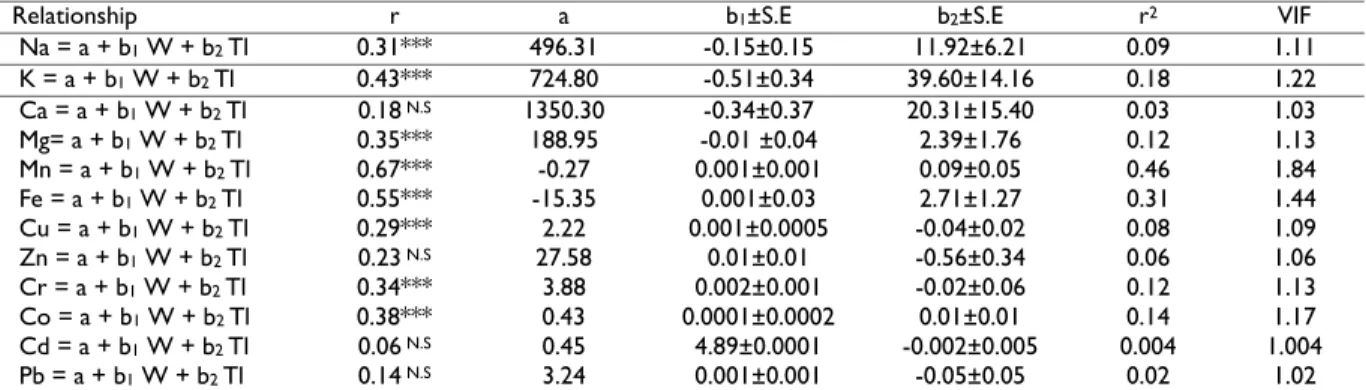
The correlation coefficient (r) between different variables and wet body weight (W), condition factor (K) the value of (r) found to be highly significant (P<0.001) except for Na, Ca, Cu, Zn, Cd and Pb (Table 4). Multiple regression analysis between different variables and wet body weight (W), total length (Tl), the values of correlation coefficient (r) were found highly significant (P<0.001) except for Ca, Zn, Cd and Pb (Table 5). Table 1: Grand mean±S.E values of elemental concentration in
carcasses (n = 71) of Aristichthys nobilis (whole fish)
Concentration(µgg-1)
Elemnts
Dry weight Wet weight
Paired T-test
Na 4062.25±156.81 770.48±26.57 24.81***
K 8503.91±319.88 1631.94±63.62 26.20***
Ca 9436.04±392.00 1782.84±63.62 22.96***
Mg 1331.10±43.21 253.47±7.64 29.44***
Mn 14.01±10.13 2.81±2.19 11.83***
Fe 311.23±30.04 61.64±6.21 10.43***
Cu 8.84±0.55 1.67±0.10 15.57***
Zn 83.22±8.80 15.49±1.41 9.14***
Cr 22.08±1.48 4.19±0.27 14.65***
Co 3.52±0.24 0.67±0.04 14.66***
Cd 2.12±0.11 0.40±0.02 18.19***
Pb 11.99±1.15 2.25±0.19 10.13***
***: P<0.001
Table 2: Regression parameters for A. nobilis: Log body burden element (g) = a+b Log wet body weight (g). Underlined values are not significantly different from b=1.0 (n=71)
a=Intercept; b=slope; S.E=Standard Error; r=Correlation Coefficient; ***: P<0.001, N.S>0.05
Table 3: Regression parameters for A. nobilis: Log body burden element (g)=a + b Log total length (cm). Underlined values are not significantly different from b=1.0 (n=71)
Total length(cm)
Element a b S.E (b) r t value
Na -0.18 3.73 0.22 0.90*** 3.33 **
K 0.17 3.65 0.54 0.63*** 1.22 N.S
Ca 0.60 3.40 0.46 0.67*** 0.87 N.S
Mg -0.21 3.35 0.58 0.57*** 0.88 N.S
Mn -4.44 4.91 0.35 0.86*** 5.51***
Fe -2.68 4.67 0.23 0.93*** 7.22***
Cu -2.46 3.48 0.15 0.96*** 3.22 **
Zn -1.34 3.35 0.18 0.91*** 1.93 N.S
Cr -2.53 3.72 0.46 0.70*** 1.55 N.S
Co -4.53 4.62 0.31 0.87*** 5.22***
Cd -2.82 3.28 0.26 0.84*** 1.07 N.S
8.80 to 47.81
Pb -2.30 3.40 0.32 0.79*** 1.28 N.S
a= Intercept; b=slope; S.E=Standard Error; r=Correlation Coefficient; ***: P<0.001, N.S>0.05
Wet body weight (g)
Elements a b S.E (b) r t value
Na 2.55 1.11 0.07 0.89*** 1.63 N.S
K 2.84 1.09 0.16 0.63*** 0.54 N.S
Ca 3.10 1.01 0.14 0.66*** 0.04 N.S
Mg 2.25 0.99 0.17 0.57*** 0.03 N.S
Mn -0.89 1.48 0.10 0.87*** 4.73***
Fe 0.68 1.41 0.06 0.94*** 6.48***
Cu 0.05 1.04 0.04 0.99*** 1.33 N.S
Zn 1.10 1.00 0.05 0.91*** 0.01 N.S
Cr 0.19 1.11 0.14 0.69*** 0.77 N.S
Co -1.14 1.37 0.09 0.87*** 3.88***
Cd -0.45 0.99 0.08 0.84*** 0.19 N.S
6.86 to 1766.0
Pak Vet J, 2011, 31(2): 109-112.
111 In the present study, all metals showed isometric growth in relation to body weight and total length except Mn, Fe and Co which showed positive allometry in relation whereas Na which showed positive allometry in relation to total length only. Salam et al. (1996) has reported similar results for Oreochromis nilotica in which different metals showed no dependence on body weight or total length except Na, K, Sn, and Pb which showed positive allometry. It is suggested that the concentration of some elements remained constant while others increased or decreased linearly with increase in fish size, probably due to the reason that some metals accumulate at higher while others at lesser rate compared to its rate of excretion as fish grows in size..
The heavy metals like Na, K, Ca, Mg, Cu, Zn, Cr, Cd and Pb were found to increase in direct proportion to increase in body weight indicating isometric increase. Similar isometric increase in relation to body weight has also been reported by Ansari et al. (2006) in Zn, Cu and Ca and in Cu, Cr and Cd by Naeem et al. (2010). In the present study, Mn, Fe and Co showed positive allometry indicating significant proportional increase in metal concentration with increasing body weight. Similarly, Mn and Fe increased in Tor putitora asreported by Salam et al. (1994). However, Ansari et al. (2006) reported isometric increase in Fe and Cu concentrations with increasing body weight in Puntius chola, while isometric increase in Mn and Co and negative isomertery in Fe concentration studied by Naeem et al. (2010) in Onchorhynchus mykiss. These variations may be due to
difference in foraging methods, metabolic rate and size of fish.
When multiple predictive equations were applied for determining elemental concentration from wet body weight and total length or condition factor, a highly significant correlations were observed in most of the cases. Variance inflation factor of regression coefficients for each variable were lesser than 10, indicating precision of estimates.
Paired t-test analyses indicated significant (P<0.001) difference in elemental composition in wet and dry body weight of Aristichthys nobilis (Table 1). The values of inorganic element concentration obtained with A. nobilis were compared with the values already reported in the literature for various fresh water fishes whether cultured or wild. It was observed that interspecific variations in elemental concentrations exist which could possibly be due to the nature of their habitat, meat quality or gradual accumulation of pollutants entering the aquatic ecosystem.
Conclusions
On the basis of the results obtained, it is concluded that the concentration of some elements remained constant while others increased or decreased linearly with increased fish. Additionally, the mean metal concentrations were below the maximum tolerance levels for human consumption established by FAO and thus consumption of the fishes of studied sites is safe for human consumption.
Table 4: Multiple regression relationships in A. nobilis (n=71) involving body weight (W, g.) and condition factor (K) with body
burden element (g) = a + b1 W + b2 K (wet wt)
Relationship r a b1±S.E b2±S.E r2 VIF
Na = a + b1 W + b2 K 0.23 N.S 848.66 0.16±0.10 -125.43±205.38 0.05 1.06
K = a + b1 W + b2 K 0.35*** 746.12 0.07±0.23 743.68±474.18 0.12 1.14
Ca = a + b1 W + b2 K 0.26 N.S 2738.80 0.50±0.24 -1009.79±488.34 0.07 1.07
Mg= a + b1 W + b2 K 0.33*** 281.59 0.06 ±0.03 -47.42±57.40 0.11 1.12
Mn = a + b1 W + b2 K 0.70*** -2.68 0.002±0.0007 4.19±1.48 0.49 1.95
Fe = a + b1 W + b2 K 0.54*** -37.39 0.03±0.020 74.69±41.45 0.29 1.42
Cu = a + b1 W + b2 K 0.22 N.S 1.36 0.0003±0.0003 0.15±0.07 0.05 1.05
Zn = a + b1 W + b2 K 0.18 N.S 27.74 0.001±0.005 -10.92±11.01 0.03 1.03
Cr = a + b1 W + b2 K 0.36*** 5.55 0.003±0.0009 -2.10±1.99 0.13 1.14
Co = a + b1 W + b2 K 0.40*** 0.92 0.0004±0.0001 -0.38±0.32 0.16 1.19
Cd = a + b1 W + b2 K 0.17 N.S 0.18 -9.04±7.52 0.0007±0.15 0.03 1.03
Pb = a + b1 W + b2 K 0.22N.S 4.89 0.001±0.0007 -2.69±1.46 0.05 1.05
r=Multiple correlation coefficient; a=intercept; b1±S.E and b2±S.E=regression coefficient; r2=proportion of variance due to regression;
VIF=Variance inflation factor, ***P<0.001; N.S.>0.05
Table 5: Multiple regression relationships in A. nobilis (n=71) involving body weight (W; g) and total length(TL; cm) with body
burden element (g) = a + b1 W + b2 TL (wet wt)
Relationship r a b1±S.E b2±S.E r2 VIF
Na = a + b1 W + b2 Tl 0.31*** 496.31 -0.15±0.15 11.92±6.21 0.09 1.11
K = a + b1 W + b2 Tl 0.43*** 724.80 -0.51±0.34 39.60±14.16 0.18 1.22
Ca = a + b1 W + b2 Tl 0.18 N.S 1350.30 -0.34±0.37 20.31±15.40 0.03 1.03
Mg= a + b1 W + b2 Tl 0.35*** 188.95 -0.01 ±0.04 2.39±1.76 0.12 1.13
Mn = a + b1 W + b2 Tl 0.67*** -0.27 0.001±0.001 0.09±0.05 0.46 1.84
Fe = a + b1 W + b2 Tl 0.55*** -15.35 0.001±0.03 2.71±1.27 0.31 1.44
Cu = a + b1 W + b2 Tl 0.29*** 2.22 0.001±0.0005 -0.04±0.02 0.08 1.09
Zn = a + b1 W + b2 Tl 0.23 N.S 27.58 0.01±0.01 -0.56±0.34 0.06 1.06
Cr = a + b1 W + b2 Tl 0.34*** 3.88 0.002±0.001 -0.02±0.06 0.12 1.13
Co = a + b1 W + b2 Tl 0.38*** 0.43 0.0001±0.0002 0.01±0.01 0.14 1.17
Cd = a + b1 W + b2 Tl 0.06 N.S 0.45 4.89±0.0001 -0.002±0.005 0.004 1.004
Pb = a + b1 W + b2 Tl 0.14 N.S 3.24 0.001±0.001 -0.05±0.05 0.02 1.02
r=Multiple correlation coefficient; a=intercept; b1±S.E and b2±S.E=regression coefficient; r2=proportion of variance due to regression;
Pak Vet J, 2011, 31(2): 109-112.
112
Acknowledgements
The authors greatly acknowledge the Central Laboratory for Environmental Analysis, Pakistan Environmental Protection Agency, Islamabad, Pakistan for necessary help to make this research possible.
REFERENCES
Ansari TM and M Iqbal, 1993. CPFAAS: A computer program for comprehensive treatment of data in flame atomic absorption spectrometery. J Anal Environ Chem, 2: 84-89.
Ashraf M, A Zafar, A Rauf, S Mehboob and NA Qureshi, 2011. Nutritional values of wild and cultivated silver carp (Hypophthalmichthys molitrix) and grass carp (Ctenopharyngodon idella). Int J Agric Biol, 13: 210– 214.
Canli M and G Atli, 2002. The relationships between heavy metal (Cd, Cr, Cu, Fe, Pb, Zn) levels and the size of six Mediterranean fish species. Environ Pollut, 121: 29–136.
Falandysz J, 1994. Metal content in the muscular tissue of turbot Psetta maxima from the Gdansk Bay, Bromat. Chem Toksykol, 27: 37-39.
FAO, 1983. Compilation of legal limits for hazardous substances in fish and fishery products. FAO Fishery Circular No. 464, pp: 5-100.
Farkas A, J Salanki and A Specziar, 2003. Age- and size-specific patterns of heavy metals in the organs of freshwater fish Abramis brama L. populating a low-contaminated site. Water Res, 37: 959–964.
Farkas A, J Salanki and A Specziar, 2002. Relation between growth and the heavy metal concentration in organs of bream Abramis brama L. populating Lake Balaton. Arch EnvironContam Toxicol, 43: 236–243. Jaffar M, M Ashraf and A Rasool, 1988. Heavy metal
contents in some selected local freshwater fish and relevant waters. Pak J Sci Ind Res, 31: 189-193. Jezierska B and M Witeska, 2001. Accumulation of
metals in fish the effect of intrinsic factors . Age and size-In: Metal toxicity to fish. Monografie, 42: 95-98.
Kargin F, 1996. Seasonal changes in levels of heavy metals in tissues of Mullus barbatus and Sparus aurata collected from Iskenderum Gulf (Turkey). Water Air Soil Pollut, 90: 557-562.
Kostecki M, 2000. Heavy metals in flesh and liver of some fish species in Dzierzno Duze Dam-Reservoir. Arch Ochr Srod, 26: 109-125.
Kroupa M and P Hartvich, 1990. Concentrations of some heavy metals in fish. ZivocisnaVyroba, 35: 937-943. Luczynska J and E Tonska, 2006. The effect of fish size
on the content of zinc, iron, copper, and manganese in the muscles of perch (Perca fluviatilis L.) and pike (Esox lucisus L.). Arch Pol Fish, 14: 5-13.
Naeem M, A Salam, SS Tahir and N Rauf, 2010.
Assessment of the essential element and toxic heavy metals in hatchery reared Oncorhynchus mykiss. Int J Agric Biol, 12: 935–938.
Phillips DJH, 1980. Quantitative Aquatic biological indicators. Applied Science Publishers, London, pp: 488-493.
Promya J and C Chitmanat,2011.The effects of Spirulina platensis and Cladophora algae on the growth performance, meat quality and immunity stimulating capacity of the African sharptooth catfish (Clarias gariepinus). Int J Agric Biol, 13: 77–82.
Salam A, M Naeem, TM Ansari, JM Akhtar and N Tariq, 1996. Effect of body size on trace metal concentrations in hatchery reared Oreochromis nilotica. Biologia, 42: 19-26.
Salam A and TM Ansari, QA Akhtar and M Naeem, 1994. Changes in the elemental composition of river mahseer, Tor putitora in relation to body size. Acta Sci, 4: 85-94.
Salam A, TM Ansari N Tariq and QA Akhtar, 2002. Effect of body size on Metal concentrations in farmed Cirrhinus mrigala. Asian Fish Sci, 15: 329-334. Von Burg, R and MR Greenwood, 1991. Mercury. In: