Related Quantitative Traits
Camilla Noelle Rathcke1*, Johan Holmkvist2, Torben Jørgensen3, Knut Borch-Johnsen4, Torben Hansen2, Oluf Borbye Pedersen2,5,6, Henrik Vestergaard1,6
1Department of Endocrinology, Herlev Hospital, University of Copenhagen, Copenhagen, Denmark,2Hagedorn Research Institute, Gentofte, Denmark,3Research Centre for Prevention and Health, Glostrup Hospital, University of Copenhagen, Copenhagen, Denmark,4Steno Diabetes Center, Gentofte, Denmark,5Faculty of Health Sciences, University of Aarhus, Aarhus, Denmark,6Faculty of Health Sciences, University of Copenhagen, Copenhagen, Denmark
Abstract
Background:CHI3LIencoding the inflammatory glycoprotein YKL-40 is located on chromosome 1q32.1. YKL-40 is involved
in inflammatory processes and patients with Type 2 Diabetes (T2D) have elevated circulating YKL-40 levels which correlate with their level of insulin resistance. Interestingly, it has been reported that rs10399931 (2329 G/A) ofCHI3LIcontributes to
the inter-individual plasma YKL-40 levels in patients with sarcoidosis, and that rs4950928 (2131 C/G) is a susceptibility polymorphism for asthma and a decline in lung function. We hypothesized that single nucleotide polymorphisms (SNPs) or haplotypes thereof theCHI3LIlocus might influence risk of T2D. The aim of the present study was to investigate the putative
association between SNPs and haplotype blocks ofCHI3LIand T2D and T2D related quantitative traits.
Methods/Principal Findings:Eleven SNPs ofCHI3LIwere genotyped in 6514 individuals from the Inter99 cohort and 2924
individuals from the outpatient clinic at Steno Diabetes Center. In cas-control studies a total of 2345 T2D patients and 5302 individuals with a normal glucose tolerance test were examined. We found no association between rs10399931 (OR, 0.98 (CI, 0.88–1.10), p = 0.76), rs4950928 (0.98 (0.87–1.10), p = 0.68) or any of the other SNPs with T2D. Similarly, we found no significant association between any of the 11 tgSNPs and T2D related quantitative traits, all p.0.14. None of the identified haplotype blocks ofCHI3LIshowed any association with T2D, all p.0.16.
Conclusions/Significance:None of the examined SNPs or haplotype blocks ofCHI3LIshowed any association with T2D or
T2D related quantitative traits. Estimates of insulin resistance and dysregulated glucose homeostasis in T2D do not seem to be accounted for by the examined variations ofCHI3LI.
Citation:Rathcke CN, Holmkvist J, Jørgensen T, Borch-Johnsen K, Hansen T, et al. (2009) Variation inCHI3LIin Relation to Type 2 Diabetes and Related Quantitative Traits. PLoS ONE 4(5): e5469. doi:10.1371/journal.pone.0005469
Editor:Adrian Vella, Mayo Clinic College of Medicine, United States of America ReceivedJanuary 19, 2009;AcceptedMarch 29, 2009;PublishedMay 7, 2009
Copyright:ß2009 Rathcke et al. This is an open-access article distributed under the terms of the Creative Commons Attribution License, which permits
unrestricted use, distribution, and reproduction in any medium, provided the original author and source are credited.
Funding:This study was supported by grants from Novo Nordisk and the European Union (InterAct, grant LSHMCT-2006-037197; EUGENE2, grant LSHM-CT-2004-512013), the Research Foundation of Herlev Hospital; the Research Foundation of Copenhagen County; the Danish Medical Research Council and the Swedish Research Council (J.H.), Timber Merchant Vilhelm Bangs Foundation; Aase and Ejnar Danielsens Foundation and The Danish Diabetes Association. The funders had no role in the study design, data collection and analysis, decision to publish, or preparation of the manuscript.
Competing Interests:The authors have declared that no competing interests exist. * E-mail: [email protected]
Introduction
The primary molecular defects in Type 2 diabetes (T2D) remain largely unknown, but it is widely recognized that both genetic and environmental risk factors have interacting roles in the pathogen-esis and the progression of the disease. However, recent discoveries have led to a progress in the understanding of the molecular genetic background of T2D brought forward by genome-wide association (GWA) studies which have dramatically increased the number of validated type 2 diabetes loci with modest impact on relative diabetes risk [1–3]. Several loci of interest may be located in the region of human chromosone 1q21–24 which shows replicated linkage to T2D in at least eight populations including North European Caucasian families, Pima Indians and Old Order Amish [1]. Furthermore, linkage analysis has also provided evidence for linkage of the metabolic syndrome (central obesity, dyslipidemia, hyperglycemia and hypertension) to 1q23–31 [4]. These regions as well as other closely related regions of
chromosome 1 are under intense search for identification of T2D susceptibility genes.
Chitinase 3-like 1 (CHI3LI) encoding the inflammatory glycoprotein YKL-40 is located in a phylogenetically highly conserved area on chromosome 1q32.1. YKL-40 is involved in inflammatory processes and extracellular matrix remodelling including angiogenesis and functions as a growth factor for several cell types [5]. Studies have shown, that patients with T2D have elevated plasma YKL-40 levels [6,7] which correlate with insulin resistance and with their diabetic lipid profile, but not with estimates of glycemic regulation [6]. Also patients with type 1 diabetes (T1D) have elevated YKL-40 levels which increase with increasing levels of albuminuria [8].
study of gene expression in Epstein-Barr virus-transformed lymphoblastoid cells from children with asthma [10] and is shown to be predictive of asthma, bronchial hyperresponsiveness and reduced lung function [11]. SinceCHI3LI is a susceptibility gene for asthma with elevated circulating YKL-40 levels as a biomarker, it is possible that one of these single nucleotide polymorphisms (SNPs) or another gene variation with which they could be in tight linkage disequilibrium with may be functional in relation to T2D. Applying a HapMap–based tgSNP approach the objective of the present study was to investigate the putative association of common variation in the CHI3LI locus with T2D, obesity and several T2D associated quantitative traits.
Methods
Ethics Statement
Informed written consent was obtained from all participants before participation. The study was approved by the Ethical Committees of Copenhagen and Aarhus and was in accordance with the principle of the Helsinki Declaration II.
Study population
A total of 11 tgSNPs (including the rs10399931 and rs4950928) covering all haplotype blocks in CHI3LI locus was genotyped. Genotyping was performed in 9438 individuals including Inter99, a population-based sample of unrelated, middle-aged Danish individuals living in the greater Copenhagen area, and 2924 individuals recruited from the outpatient clinic at Steno Diabetes Center.
The Inter99 study population has been described in detail previously [12]. In brief, both participants from the Inter99 cohort and individuals recruited from the outpatient clinic were characterized by an oral glucose tolerance test (OGTT). Impaired glucose homeostasis (IFG, IGT and diabetes) was defined according to WHO criteria after a 75 g OGTT [13] giving a classification of normal glucose tolerance (NGT; n = 5302), impaired fasting glycemia (IFG; n = 540), impaired glucose tolerance (IGT; n = 830) or screen-detected untreated T2D (SDU DM; n = 294). Missing data was seen in 421 individuals (4.5%) and a total of 2091 individuals had known T2D. The participants were investigated for an association between genotype and quantitative metabolic traits; individuals with known type 2 diabetes were excluded from these analyses. All participants were of Danish nationality.
Biochemical and anthropometric measurements
Height and body weight were measured in light indoor clothes and without shoes, and BMI was calculated as weight (kg) divided by (height (m))2. Waist circumference was measured in the standing position midway between the iliac crest and the lower costal margin and hip circumference at its maximum.
In both Inter99- and Steno Diabetes Center participants, blood samples were drawn in the fasting state after a 12-h overnight fast. Plasma glucose was analysed by a glucose oxidase method (Granutest, Merck, Darmstadt, Germany). HbA1Cwas measured
by ion-exchange high performance liquid chromatography (normal reference range: 4.1–6.4%) and serum insulin (excluding des(31, 32) and intact proinsulin) was measured using the AutoDELFIA insulin kit (Perkin-Elmer/Wallac, Turku, Finland). Serum C-peptide concentrations were measured by a time-resolved fluoroimmunoassay (AutoDELFIA C-peptide kit; Per-kin-Elmer/Wallac, Turku, Finland).
Serum triglyceride and total and HDL-cholesterol were analysed using enzymatic colorimetric methods (GPO-PAP and
CHOD-PAP, Roche Molecular Biochemicals, Mannheim, Ger-many). HOMA-IR was calculated as fasting plasma glucose [mmol/l] multiplied by fasting serum insulin [pmol/l] and divided by 22.5. Insulinogenic index at 30 min was calculated as fasting serum insulin subtracted from plasma insulin at 30 min [pmol/l] divided by plasma glucose at 30 min [mmol/l].
Genotyping
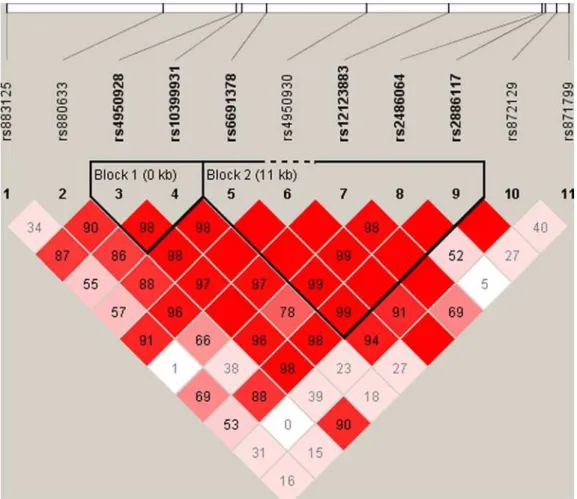
SNPs in a region 22 kb upstream and 10 kb downstream of CHI3LI were chosen from the HapMap project (www.hapmap. org). Haplotype tgSNPs were selected from the HapMap data using TAGGER [14]. TAGGER was used with a 5% MAF cut off, agressive tagging (r2.0.8). Two haplotype blocks with 2 and 5 SNPs, respectively, and with similar structures in both patients with T2D and in controls were identified (Figure 1). The other tgSNPs were not included in the haplotype block analyses since they were not part of any block. Genotyping was performed using TaqMan allelic discrimination (Kbioscience, Herts, UK) with a success rate .97.0%. Discordance was 0% as judged from re-genotyping of 965 random duplicate samples. Genotype distribu-tion obeyed Hardy Weinberg Equilibrium (HWE), all p.0.25.
Statistical analyses
Logistic regression analyses were used to analyse differences in allele and genotype frequencies between case and control subjects; analyses were adjusted for age, sex and BMI where appropriate. The statistical analyses were performed using RGui version 2.5.0 (available at http://www.r-project.org). The haplotype block analyses were analysed for an association with T2D after adjustment for age, sex and BMI. Haplotype analyses were performed using PLINK [15]. P-values are not adjusted for multiple testing.
Results
Clinical characteristics for the Inter99 cohort and the individuals recruited at Steno Diabetes Center are presented in Table 1. A total of 2345 T2D patients and 5302 individuals with a normal glucose tolerance test were identified.
Overall we found no association of rs10399931, rs4950928 or any of the other tgSNPs ofCHI3LIwith T2D after adjustment for age, sex, BMI and glucose tolerance, all p.0.25 (Table 2). In similar analyses, none of the tgSNPs were associated with impaired fasting glucose (IFG) or impaired glucose tolerance (IGT), although a borderline protective association with IGT was detected for rs12123883 (Table S1 and S2).
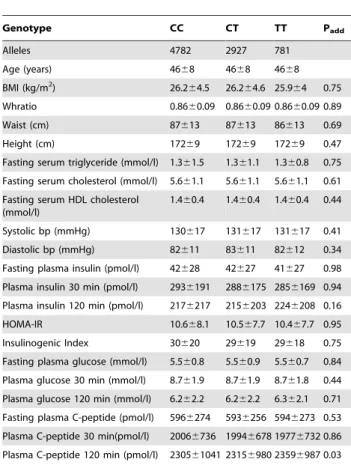
Table 3 and 4 show the multiadjusted association of rs10399931 and rs4950928 with BMI and other T2D related quantitative traits among NGT, IFG, IGT and screen-detected untreated T2D in Inter99 and Steno Diabetes Center collected individuals. We found a significant association between rs10399931 and the serum C-peptide concentration after 2 hours, p = 0.03, but in all we found no significant association between rs10399931 or rs4950928 and any of the T2D quantitative traits. Similarly, none of the other SNPs showed any associations (data not shown).
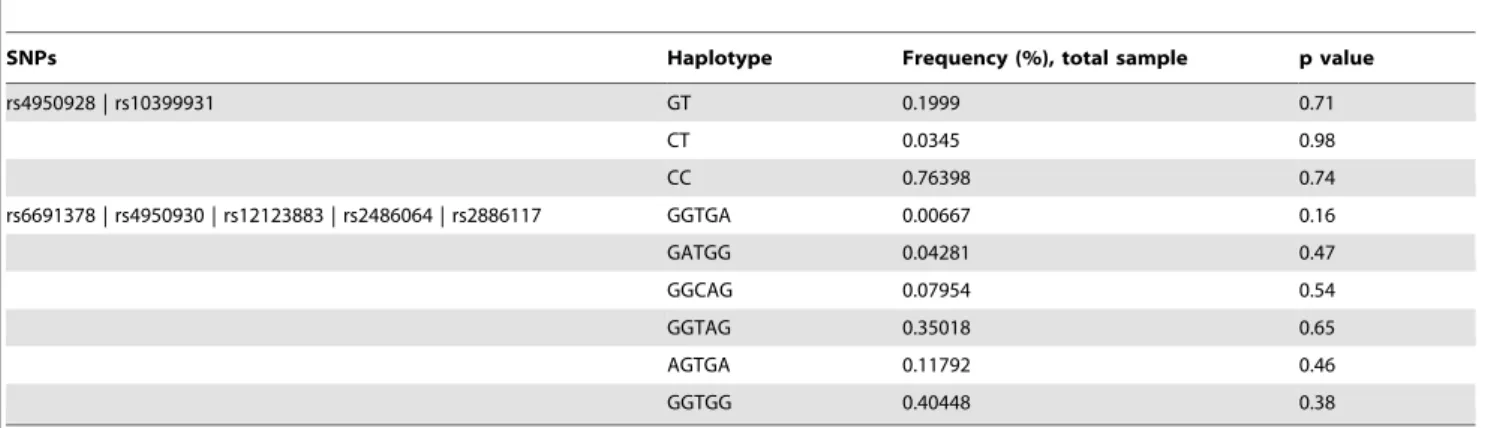
The two identified haplotype blocks ofCHI3LIdid not show any association with T2D (Table 5).
Discussion
from patients with T2D [6,7] and from patients with T1D where it also correlates with increasing levels of albuminuria [8]. In our study, we have exmained 11 tgSNPs covering the common
variation (MAF.5%) inCHI3LIincluding the SNPs rs10399931 and rs4950928 which previously have been found to contribute to interindividual variations in circulating YKL-40 levels in patients with sarcoidosis [9] and asthma [11], respectively. Furthermore, CHI3LI has been found to be a susceptibility gene for asthma, since rs4950928 is predictive of asthma, bronchial hyperrespon-siveness and reduced lung function.
A total of 9438 individuals have been examined, but no significant association of rs10399931, rs4950928 or any of the other tgSNPs of CHI3LI were found with T2D or any of the intermediate T2D related quantitative traits. A borderline protective association with IGT was detected for rs12123883, but rs12123883 is a rare SNP with only few homozygotes and the protective association is most likely a chance finding. Furthermore, the p-value would not withstand correction for multiple testing considering the number of tests performed. On the same line, none of the two identified haplotype blocks showed any association with T2D.
In association analyses of rs10399931 and SNPs analysed in the DGI genome wide association scan study, rs10399931 is in LD with rs4950929 (r2= 0.74) and rs946263 (r2= 0.78). Other correlations had r2-values,0.05. In the DGI genome wide association scan study, no significant associations of rs4950929 with any of the type 2 diabetic phenotypic traits were found, but the rs946263 G-allele was nominally found to be associated with T2D (p = 0.027) [16]. rs946263, which is a synonymous SNP located 29639 base pairs from the translational start site in Figure 1. Linkage disequilibrium (LD) pattern of the investigated variations ofCHI3L1.
doi:10.1371/journal.pone.0005469.g001
Table 1.Clinical data for study sample.
Complete sample SDC sample Inter99 cohort
N (m/w) 9438 (4834/4604) 2924 (1665/1259) 6514 (3169/3345) NGT 5302 (2456/2846) 734 (334/400) 4568 (2122/2446) IFG 540 (391/149) 32 (18/14) 508 (373/135) IGT 830 (414/416) 123 (66/57) 707 (348/359) SDU DM 294 (187/107) 39 (27/12) 255 (160/95) Known DM 2051 (1259/801) 1946 (1200/755) 105 (59/46) NGT age (years) 4769 5869 4568 NGT BMI (kg/m2) 25.6
69.1 25.968.7 25.564.1 T2D age (years) 60612 62611 5167 T2D BMI (kg/m2) 30.1
65.5 30.065.5 30.465.6 T2D HbA1c (%) 7.861.7 8.161.6 7.161.7
CHI3LI, is also in perfect LD (r2= 1.0) with rs4950928, which accounts for approximately 10% of the variance in plasma YKL-40 levels in asthma patients [11]. Beside the LD of rs10399931 and rs4950928 with rs946263, none of the examined SNPs or haplotype blocks of CHI3LI seem to be of any significance for the T2D diagnosis or any of the T2D related quantitative traits. Since the encoded inflammatory protein, YKL-40, of CHI3LI seems to be both a marker of inflammation and endothelial dysfunction [5,17] it is possible that it is the endothelial dysfunction and the later micro- and macrovascular complications of T2D that accounts for the elevated YKL-40 levels in T2D patients. In endothelial dysfunction, elevated YKL-40 levels seem to play a role in relation to cell migration, reorganization and tissue remodelling as a response to endothelial damage [18–20].
The possible assocation between YKL-40 and vascular damage is supported by the finding of an independent association between elevated circulating YKL-40 levels and increasing levels of albuminuria in T1D patients [8]. Elevated plasma YKL-40 is also found to be associated with the presence and extent of coronary artery disease as assessed by coronary angiography [21] and just recently, YKL-40 levels have been found to be elevated in patients with myocardial infarction [22]. Furthermore, increasing YKL-40 levels do predict cardiovascular mortality in individuals without known DM or CHD after adjustment for known CV risk factors and markers [7].
Substantial evidence supports the notion that endothelial dysfunction and low-grade inflammation play a major pathophys-iological role in the development of insulin resistance and the
Table 2.Case control association studies of 2345 T2D patients and 5302 glucose tolerant control participants in relation to the 11 tgSNPs ofCHI3LI.
SNP Allele MAF Genotype Genotype distribution Additive model p value
(major/minor) (%) All NGT, n (%) T2D, n (%) OR (CI)
rs883125 C/G 15.6 CC 3546 (71.8) 1574 (71.0) 0.98 (0.86–1.12) 0.78
CG 1280 (25.9) 591 (26.7)
GG 114 (2.3) 51 (2.3)
rs880633 C/T 46.3 CC 1470 (30.0) 645 (29.4) 1.00 (0.90–1.10) 0.96
CT 2416 (49.3) 1077 (48.8)
TT 1018 (20.7) 483 (21.8)
rs4950928 C/G 20.4 CC 3159 (63.6) 1402 (63.4) 0.98 (0.87–1.10) 0.68
CG 1612 (32.4) 716 (32.4)
GG 197 (4.0) 93 (4.2)
rs10399931 C/T 23.7 CC 2894 (58.8) 1287 (58.4) 0.98 (0.88–1.10) 0.76
CT 1754 (35.6) 791 (35.9)
TT 273 (5.6) 126 (5.7)
rs6691378 G/A 12.6 GG 3840 (77.7) 1690 (76.4) 1.08 (0.94–1.25) 0.29
GA 1030 (20.9) 487 (22.0)
AA 69 (1.4) 34 (1.6)
rs4950930 G/A 4.0 GG 4512 (91.6) 2053 (92.5) 0.96 (0.76–1.20) 0.70
GA 399 (8.1) 157 (7.1)
AA 13 (0.3) 10 (0.5)
rs12123883 T/C 7.4 TT 4235 (85.5) 1906 (85.7) 0.95 (0.79–1.14) 0.58
TC 684 (13.8) 305 (13.7)
CC 37 (0.7) 13 (5.8)
rs2486064 G/A 42.3 GG 1636 (33.0) 742 (33.7) 0.97 (0.87–1.07) 0.48
GA 2406 (48.6) 1057 (48.0)
AA 909 (18.4) 402 (18.3)
rs2886117 G/A 12.9 GG 3809 (76.6) 1679 (75.8) 1.04 (0.90–1.20) 0.59
GA 1078 (21.7) 500 (22.6)
AA 84 (1.7) 36 (1.6)
rs872129 A/G 7.2 AA 4183 (84.5) 1910 (86.1) 0.91 (0.76–1.09) 0.32
AG 730 (14.8) 298 (13.4)
GG 35 (0.7) 11 (0.5)
rs871799 G/C 9.2 GG 4028 (81.3) 1821 (82.3) 0.96 (0.81–1.13) 0.60
GC 873 (17.6) 376 (17.0)
CC 54 (1.1) 16 (0.7)
progression to manifest T2D [23–29]. We have previously shown, that YKL-40 levels are elevated in patients with T2D where it correlates with insulin resistance as assessed by the HOMA model and with levels of triglycerides and non-esterified fatty acids [6]. Since we found no association of any of the tgSNPs and surrogate markers of insulin resistance or the diabetic lipid profile in the present study, it does not seem to be any of these tgSNPs that explain the previously found correlation with these variables [6].
Multiple genes on different chromosomes may influence inflammatory biomarker levels and may have a potential role in the development of insulin resistance through a low-grade inflammatory state [30–33]. In proximity of the YKL-40 encoding gene, locus 1q32.2 has been documented to influence the plasma levels of ICAM-1[30], an adhesion molecule well-documented to participate in endothelial dysfunction and the development of T2D [23,25]. However, association studies between YKL-40 and ICAM-1, either at protein or transcript levels, have not been conducted. Neither have association studies of variations ofCHI3L1in relation to micro- or macrovascular conditions never been made.
In conclusion, both rs10399931 and rs4950928 are in high LD with rs946263 which is reported to associate with phenotypic traits
of T2D in DGI [16]. However, neither rs1039991 nor rs4950928 nor any other tgSNPs ofCHI3LI which were investigated in the present study are associated with T2D or T2D related quantitative traits including estimates of insulin resistance and dysregulated glucose homeostasis in the examined approximately 9500 Danes. Further studies are required to determine YKL-40 levels as a marker of inflammation in the prediabetic state and the role of CHI3LIin the pathogenesis of T2D.
Supporting Information
Table S1 Case control association studies of 540 individuals with impaired fasting glucose (IFG) and 5302 glucose tolerant control participants in relation to the 11 tgSNPs of CHI3LI.
Found at: doi:10.1371/journal.pone.0005469.s001 (0.08 MB DOC)
Table S2 Case control association studies of 830 individuals with impaired glucose tolerance (IGT) and 5302 glucose tolerant control participants in relation to the 11 tgSNPs of CHI3LI Found at: doi:10.1371/journal.pone.0005469.s002 (0.08 MB DOC)
Table 3.Association of rs10399931 ofCHI3LIand T2D related
quantitative traits among NGT, IFG, IGT and screen-detected untreated T2D in Inter99 and Steno Diabetes Center collected individuals.
Genotype CC CT TT Padd
Alleles 4782 2927 781
Age (years) 4668 4668 4668
BMI (kg/m2) 26.2
64.5 26.264.6 25.964 0.75 Whratio 0.8660.09 0.8660.09 0.8660.09 0.89 Waist (cm) 87613 87613 86613 0.69 Height (cm) 17269 17269 17269 0.47 Fasting serum triglyceride (mmol/l) 1.361.5 1.361.1 1.360.8 0.75 Fasting serum cholesterol (mmol/l) 5.661.1 5.661.1 5.661.1 0.61 Fasting serum HDL cholesterol
(mmol/l)
1.460.4 1.460.4 1.460.4 0.44
Systolic bp (mmHg) 130617 131617 131617 0.41 Diastolic bp (mmHg) 82611 83611 82612 0.34 Fasting plasma insulin (pmol/l) 42628 42627 41627 0.98 Plasma insulin 30 min (pmol/l) 2936191 2886175 2856169 0.94 Plasma insulin 120 min (pmol/l) 2176217 2156203 2246208 0.16 HOMA-IR 10.668.1 10.567.7 10.467.7 0.95 Insulinogenic Index 30620 29619 29618 0.75 Fasting plasma glucose (mmol/l) 5.560.8 5.560.9 5.560.7 0.84 Plasma glucose 30 min (mmol/l) 8.761.9 8.761.9 8.761.8 0.44 Plasma glucose 120 min (mmol/l) 6.262.2 6.262.2 6.362.1 0.71 Fasting plasma C-peptide (pmol/l) 5966274 5936256 5946273 0.53 Plasma C-peptide 30 min(pmol/l) 20066736 19946678 19776732 0.86 Plasma C-peptide 120 min (pmol/l) 230561041 23156980 23596987 0.03
Data presented as mean (SD). Analyses adjusted for age, gender, BMI, glucose tolerance (NGT, IFG, IGT and screen-detected untreated T2D).
T2D, type 2 diabetes; NGT, normal glucose tolerance; IFG, impaired fasting glucose; IGT, impaired glucose tolerance; add, additive; dom, dominant; res, recessive; bmi, body mass index; whratio, waist-to-hip ratio; hdl, high density lipoprotein; bp, blood pressure; HOMA-IR, insulin resistance according to HOMA model.
doi:10.1371/journal.pone.0005469.t003
Table 4.Association of rs49509028 ofCHI3LIand T2D related
quantitative traits among NGT, IFG, IGT and screen-detected untreated T2D in Inter99 and Steno Diabetes Center collected individuals.
Genotype CC CG GG Padd
Alleles 5172 2635 334
Age (years) 4668 4668 4668
BMI (kg/m2) 26.2
64.5 26.164.6 25.863.8 0.14 Whratio 0.8660.09 0.8660.09 0.8660.09 0.43 waist (cm) 87613 86613 86612 0.56 Height (cm) 17269 17269 17269 0.91 Fasting serum triglyceride (mmol/l) 1.361.4 1.361.1 1.360.9 0.85 Fasting serum cholesterol (mmol/l) 5.661.1 5.661.1 5.661.1 0.28 Fasting serum HDL cholesterol
(mmol/l)
1.460.4 1.460.4 1.460.4 0.36
Systolic bp (mmHg) 130617 131617 130617 0.53 Diastolic bp (mmHg) 82611 83611 82611 0.72 Fasting plasma insulin (pmol/l) 42628 41627 41625 0.35 Plasma insulin 30 min (pmol/l) 2956191 2876174 2766151 0.36 Plasma insulin 120 min (pmol/l) 2186215 2156216 2176191 0.54 HOMA-IR 10.667.9 10.467.8 10.166.8 0.47 Insulinogenic Index 30620 29619 28617 0.41 Fasting plasma glucose (mmol/l) 5.560.8 5.560.9 5.560.7 0.54 Plasma glucose 30 min (mmol/l) 8.761.9 8.761.8 8.761.8 0.94 Plasma glucose 120 min (mmol/l) 6.262.1 6.262.2 6.362.2 0.52 Fasting plasma C-peptide (pmol/l) 5976276 5866253 5916267 0.85 Plasma C-peptide 30 min(pmol/l) 20146738 19886676 19456709 0.54 Plasma C-peptide 120 min (pmol/l) 231461042 23016982 23366968 0.17
Data presented as mean (SD). Analyses adjusted for age, gender, BMI, glucose tolerance (NGT, IFG, IGT and screen-detected untreated T2D).
T2D, type 2 diabetes; NGT, normal glucose tolerance; IFG, impaired fasting glucose; IGT, impaired glucose tolerance; add, additive; dom, dominant; res, recessive; bmi, body mass index; whratio, waist-to-hip ratio; hdl, high density lipoprotein; bp, blood pressure; HOMA-IR, insulin resistance according to HOMA model.
Acknowledgments
We wish to thank A. Forman, I.-L. Wantzin and M. Stendal for technical assistance and Michel Kristensen, Arne Nielsen and Grete Lademann for management and secretarial support.
Author Contributions
Conceived and designed the experiments: CNR TJ KBJ TH OBP HV. Performed the experiments: CNR TJ KBJ TH OBP HV. Analyzed the data: CNR JH. Contributed reagents/materials/analysis tools: CNR JH TH HV. Wrote the paper: CNR. Critical revision of the manuscript: JH TJ KBJ TH OBP HV.
References
1. McCarthy MI (2003) Growing evidence for diabetes susceptibility genes from genome scan data. Curr Diab Rep 3: 159–67.
2. McCarthy MI, Zeggini E (2006) Genetics of type 2 diabetes. Curr Diab Rep 6: 147–54.
3. McCarthy MI, Zeggini E (2007) Genome-wide association scans for Type 2 diabetes: new insights into biology and therapy. Trends Pharmacol Sci 28: 598–601.
4. Langefeld CD, Wagenknecht LE, Rotter JI, Williams AH, Hokanson JE, et al. (2004) Linkage of the metabolic syndrome to 1q23–q31 in Hispanic families: the Insulin Resistance Atherosclerosis Study Family Study. Diabetes 53: 1170–4. 5. Rathcke CN, Vestergaard H (2006) YKL-40, a new inflammatory marker with
relation to insulin resistance and with a role in endothelial dysfunction and atherosclerosis. Inflamm Res 55: 221–7.
6. Rathcke CN, Johansen JS, Vestergaard H (2006) YKL-40, a biomarker of inflammation, is elevated in patients with type 2 diabetes and is related to insulin resistance. Inflamm Res 55: 53–9.
7. Rathcke CN, Raymond I, Kistorp C, Hildebrandt P, Faber J, et al. (2009) Low grade inflammation as measured by levels of YKL-40: Association with an increased overall and cardiovascular mortality rate in an elderly population. Int J Cardiol. In Press.
8. Rathcke CN, Persson F, Tarnow L, Rossing P, Vestergaard H (2009) YKL-40, a marker of inflammation and endothelial dysfunction, is elevated in patients with Type 1 Diabetes and increases with levels of albuminuria. Diabetes Care. In Press.
9. Kruit A, Grutters JC, Ruven HJ, van Moorsel CC, van den Bosch JM (2007) A CHI3L1 gene polymorphism is associated with serum levels of YKL-40, a novel sarcoidosis marker. Respir Med 101: 1563–71.
10. Dixon AL, Liang L, Moffatt MF, Chen W, Heath S, et al. (2007) A genome-wide association study of global gene expression. Nat Genet 39: 1202–7. 11. Ober C, Tan Z, Sun Y, Possicj JD, Pan L, et al. (2008) Effect of variation in
CHI3L1 on serum YKL-40 level, risk of asthma, and lung function. N Engl J Med 358: 1682–91.
12. Jorgensen T, Borch-Johnsen K, Thomsen TF, Ibsen H, Glumer C, et al. (2003) A randomized non-pharmacological intervention study for prevention of ischaemic heart disease: baseline results Inter99. Eur J Cardiovasc Prev Rehabil 10: 377–86.
13. Alberti KG, Zimmet PZ (1998) Definition, diagnosis and classification of diabetes mellitus and its complications. Part 1: diagnosis and classification of diabetes mellitus provisional report of a WHO consultation. Diabet Med 15: 539–53.
14. de Bakker PI, Yelensky R, Pe’er I, Gabriel SB, Daly MJ, et al. (2005) Efficiency and power in genetic association studies. Nat Genet 37: 1217–23.
15. Purcell S, Neale B, Todd-Brown K, Thomas L, Ferreira MA, et al. (2007) PLINK: a tool set for whole-genome association and population-based linkage analyses. Am J Hum Genet 81: 559–75.
16. Saxena R, Voight BF, Lyssenko V, Burtt NP, de Bakker PI, et al. (2007) Genome-wide association analysis identifies loci for type 2 diabetes and triglyceride levels. Science 316: 1331–6.
17. Johansen JS (2006) Studies on serum YKL-40 as a biomarker in diseases with inflammation, tissue remodelling, fibroses and cancer. Dan Med Bull 53: 172–209.
18. Shackelton LM, Mann DM, Millis AJ (1995) Identification of a 38-kDa heparin-binding glycoprotein (gp38k) in differentiating vascular smooth muscle cells as a member of a group of proteins associated with tissue remodeling. J Biol Chem 270: 13076–83.
19. Malinda KM, Ponce L, Kleinman HK, Shackelton LM, Millis AJ (1999) Gp38k, a protein synthesized by vascular smooth muscle cells, stimulates directional migration of human umbilical vein endothelial cells. Exp Cell Res 250: 168– 73.
20. Millis AJ, Hoyle M, Kent L (1986) In vitro expression of a 38,000 dalton heparin-binding glycoprotein by morphologically differentiated smooth muscle cells. J Cell Physiol 127: 366–72.
21. Kucur M, Isman FK, Karadag B, Vural VA, Tavsanoglu S (2007) Serum YKL-40 levels in patients with coronary artery disease. Coron Artery Dis 18: 391–6. 22. Nojgaard C, Host NB, Christensen IJ, Poulsen SH, Egstrup K, et al. (2008) Serum levels of YKL-40 increases in patients with acute myocardial infarction. Coron Artery Dis 19: 257–63.
23. Meigs JB, Hu FB, Rifai N, Manson JE (2004) Biomarkers of endothelial dysfunction and risk of type 2 diabetes mellitus. JAMA 291: 1978–86. 24. Pickup JC (2004) Inflammation and activated innate immunity in the
pathogenesis of type 2 diabetes. Diabetes Care 27: 813–23.
25. Kolb H, Mandrup-Poulsen T (2005) An immune origin of type 2 diabetes? Diabetologia 48: 1038–50.
26. Eckel RH, Grundy SM, Zimmet PZ (2005) The metabolic syndrome. Lancet 365: 1415–28.
27. Festa A, Hanley AJ, Tracy RP, D’Agostino R Jr, Haffner SM (2003) Inflammation in the prediabetic state is related to increased insulin resistance rather than decreased insulin secretion. Circulation 108: 1822–30.
28. Rutter MK, Meigs JB, Sullivan LM, D’Agostino RB Sr, Wilson PW (2004) C-reactive protein, the metabolic syndrome, and prediction of cardiovascular events in the Framingham Offspring Study. Circulation 110: 380–5. 29. Ingelsson E, Hulthe J, Lind L (2008) Inflammatory markers in relation to insulin
resistance and the metabolic syndrome. Eur J Clin Invest 38: 502–9. 30. Dupuis J, Larson MG, Vasan RS, Massaro JM, Wilson PW, et al. (2005)
Genome scan of systemic biomarkers of vascular inflammation in the Framingham Heart Study: evidence for susceptibility loci on 1q. Atherosclerosis 182: 307–14.
31. Pantsulaia I, Trofimov S, Kobyliansky E, Livshits G (2002) Genetic and environmental influences on IL-6 and TNF-alpha plasma levels in apparently healthy general population. Cytokine 19: 138–46.
Table 5.CHI3LIhaplotype association studies in relation to T2D.
SNPs Haplotype Frequency (%), total sample p value
rs4950928 | rs10399931 GT 0.1999 0.71
CT 0.0345 0.98
CC 0.76398 0.74
rs6691378 | rs4950930 | rs12123883 | rs2486064 | rs2886117 GGTGA 0.00667 0.16
GATGG 0.04281 0.47
GGCAG 0.07954 0.54
GGTAG 0.35018 0.65
AGTGA 0.11792 0.46
GGTGG 0.40448 0.38
Data show the association with T2D for the 2 haplotype blocks of 2 respectively 5 genotyped SNPs inCHI3LI. Haplotype tgSNPs were selected from the HapMap data using TAGGER.
32. de Maat MP, Bladbjerg EM, Hjelmborg JB, Bathum L, Jespersen J, et al. (2004) Genetic influence on inflammation variables in the elderly. Arterioscler Thromb Vasc Biol 24: 2168–73.