Spatial analysis of the
tuberculosis treatment dropout,
Buenos Aires, Argentina
I Área de Relaciones Internacionales.
Facultad Latinoamericana de Ciencias Sociales. Buenos Aires, Argentina
II Área Salud, Economía y Sociedad. Centro
de Estudios de Estado y Sociedad. Buenos Aires, Argentina
III Consejo Nacional de Investigaciones
Científicas y Técnicas. Buenos Aires, Argentina
IV Departamento de Epidemiologia e Métodos
Quantitativos. Escola Nacional de Saúde Pública. Fundação Oswaldo Cruz. Rio de Janeiro, RJ, Brasil
V Instituto de Medicina Social. Universidade
do Estado do Rio de Janeiro. Rio de Janeiro, RJ, Brasil
Correspondence: José Ueleres Braga
Departamento de Epidemiologia e Métodos Quantitativos – Fiocruz
Pavilhão João Lyra Filho
Rua São Francisco Xavier, 524 7º andar, blocos D/E, 6º andar, bloco E Maracanã
20550-013 Rio de Janeiro, RJ, Brasil E-mail: [email protected] Received: 2/18/2014 Approved: 11/2/2014
ABSTRACT
OBJECTIVE: Identify spatial distribution patterns of the proportion of nonadherence to tuberculosis treatment and its associated factors.
METHODS: We conducted an ecological study based on secondary and primary data from municipalities of the metropolitan area of Buenos Aires, Argentina. An exploratory analysis of the characteristics of the area and the distributions of the cases included in the sample (proportion of nonadherence) was also carried out along with a multifactor analysis by linear regression. The variables related to the characteristics of the population, residences and families were analyzed.
RESULTS: Areas with higher proportion of the population without social security beneits (p = 0.007) and of households with unsatisied basic needs had a higher risk of nonadherence (p = 0.032). In addition, the proportion of nonadherence was higher in areas with the highest proportion of households with no public transportation within 300 meters (p = 0.070).
CONCLUSIONS: We found a risk area for the nonadherence to treatment characterized by a population living in poverty, with precarious jobs and dificult access to public transportation.
DESCRIPTORS: Tuberculosis, drug therapy. Medication Adherence. Socioeconomic Factors. Health Inequalities. Ecological Studies.
María Belén HerreroI
Silvina ArrossiII,III
Silvina RamosII
Although tuberculosis (TB) is a curable disease that can be prevented, it is an important public health issue in Argentina. Each year, more than 10,000 new cases and more than 800 deaths caused by this disease are reported. The geographic distribution of TB in the country is not uniform as in the rest of the world.a The
nonadherence to treatment is considered one of the main obstacles for the control of the disease due to the consequences of its discontinuation, associated with the social vulnerability of patients.7
TB persists as a public health problem, despite the low cost of its diagnosis and treatment. These measures are part of the strategy of the directly observed treat-ment, short-course (DOTS) recommended by the World Health Organization (WHO) to reduce the nonadherence to the treatment,25 which were adopted in Argentina and implemented with the Programa Nacional de Control de la Tuberculosis (PNCTB – National Tuberculosis Control Program).b Although the
implementation of the DOTS strategy has been carried out in the country for the last 10 years, the proportion of cases who have gave up treatment was 12.0% in 2010, one of the highest in recent years.c
Studies address the treatment adherence from a focus based on environmental factors12,24 and the individual factors related to the patient.1,4,5,13,16,18,22
The occurrence of TB and its consequences to health are related to the social conditions.20 To understand its behavior in a territory and its determinants it is essential to establish equitable actions that aim at reducing inequalities and improve adherence to the treatment. d The ecological studies aims to identify,
based on social characteristics and on the territory, relations with the distribution of diseases and health outcomes, considering the different hierarchical levels of the determinants.3,9,14
Despite the importance of such studies, in Argentina no studies can be found about the characteristics of social groups and the area where they live and the relationship with the nonadherence to the TB treatment.
INTRODUCTION
The objective of this study was to identify patterns of spatial distribution of the proportion of nonadherence to the tuberculosis treatment and its associated factors.
METHODS
This spatial-ecological study was conducted in seven municipalities of the Sixth Health Region (6th HR)
in the Buenos Aires metropolitan area (BAMA) (where there are 116 census fractions – Figure 1): Almirante Brown, Avellaneda, Berazategui, Esteban Echeverría, Ezeiza, Lomas de Zamora and Quilmes. The two other municipalities that are also part of the 6th HR (Lanus and Florencio Varela) could not be
included because the locations did not have an Ethics Committee to evaluate the cross-sectional protocol of the study that provides the georeferenced cases (adherence and nonadherence).e
The 6th HR has about 3,653,000 inhabitants, and it is
the most populated region of Buenos Aires.f It also
concentrates 13.0% of all reported cases of TB in the country and it is the sanitary region that has the largest number of TB cases in the province every year, with the highest dropout index (25.0%) and the lowest DOTS coverage (12.0%).c
The database and mapping of the National Census of Population and Households (2001), of the Instituto Nacional de Estadísticas y Censos (INDEC – National Institute of Statistics and Censuses) were used as a secondary data source.g All cases reported, from
house-holds in the municipal districts selected by the 6th HR
and treated at health services located in the region in 2007, were referenced. This was possible because these individuals participated in a study that aims to identify the foreknowledge of the nonadherence to tuberculosis treatment in these municipalities.1 We also calculated
the proportion of nonadherence to the TB treatment for the census fractions (analysis units in this study) of the municipalities of 6th HR.
The information has been grouped into three types of indicators according to the census classiication.g The
characteristics of the area were considered according
a Instituto Nacional de Enfermedades Respiratorias “Dr. Emilio Coni”. Notificación de casos de tuberculosis en la República Argentina.
Período 1980-2011. Buenos Aires: Ministerio de Salud; 2012.
b Zerbini EV, Darnaud RMH, Prieto VG. Programa Nacional de Control de la Tuberculosis: Normas Técnicas 2008. 3. ed. Santa Fé: Instituto
Nacional de Enfermedades Respiratorias Dr. Emilio Coni; 2008.
c Instituto Nacional de Enfermedades Respiratorias “Dr. Emilio Coni”. Resultado del tratamiento de la tuberculosis pulmonar ED(+) en la
República Argentina. Período 1980-2010. Buenos Aires: Ministerio de Salud; 2012.
d Acosta LSW. O mapa de Porto Alegre e a tuberculose: distribuição espacial e determinantes sociais [dissertation]. Porto Alegre (RS):
Faculdade de Medicina da UFRGS; 2008.
e Arrossi S, Herrero MB, Faccia K, Greco A, Ramirez Lijó S, Aizemberg L et al. Evaluación de los factores predictivos de la no-adherencia
al tratamiento de la tuberculosis en municipios seleccionados del área metropolitana de Buenos Aires: estudio colaborativo multicéntrico. Buenos Aires: Ministerio de Salud de la Nación; 2008 (ECM 2008).
to the presence of wastewater treatment; electricity per household; gas network; at least one block paved; regular waste collection service at least twice a week; public transportation within 300 m. The proportion of households was considered according to the type of the pavement’s predominant material, water supply system, presence or absence of public water network, and type of health service.
We considered the following: proportion of house-holds grouped according to overcrowding (three or more persons per room); lack of basic needs (over-crowding, housing, sanitation, education, and subsis-tence capacity); index of household material privation (IHMP);h economic situation of the family; and the
presence of refrigerator, freezer, landline or cell phone, microwave, computer with Internet connection, kitchen with sink and piped water in the residence.
We considered the proportion of population according to sex, age, health plan, marital status and literacy. Moreover, we considered the ratio of individuals according to educational level, state of activity and of retirement contribution (contributes and is discounted; does not contribute nor receive discount; no remuneration).
The statistical software package Stata 10.0 and two geographic information systems, ArcView 3.2 and GeoDA 8, were used to elaborate maps and perform the spatial analysis. The dropout rate was calculated by dividing the number of cases of nonadherence by the total number of patients who have started the
h According to the National Institute of Statistics and Censuses (INDEC), and the Index of Household Material Privation (IHMP) it is a variable
that identifies the residences according to their material deprivation in two dimensions – material and patrimonial resources. In relation to the Unsatisfied Basic Needs (UBN), the households with this characteristic have at least one of the following indicators of deprivation: overcrowding (more than 3 persons per room); housing (living in an improper location [leased place, hotel or pension room, shack, place without rooms], not considering house, apartment and farm); health conditions (without water-closet); school attendance (with at least one school-age child [6-12 years] who do not attend school); subsistence capacity (with four or more individuals per family unit, whose responsible has not concluded the third grade of Elementary School).
treatment in each unit of analysis (census fraction). The Bayesian and Freeman-Tukey square-root transforma-tions, empirical for these measures, were calculated having as a reference the set of fractions of the munic-ipal census. The thematic maps with these proportions were elaborated to choose the most appropriate way to present the spatial distribution patterns.
The exploratory analysis of the area characteristics and the nonadherence ratio distribution were also performed. The multifactorial analysis was performed with linear regression. In this model, the indepen-dent variables were the sociodemographic and socio-economic characteristics of the groups and the areas related to dropout cases. The dependent variable was the “nonadherence”. The variables applied in the multiple linear regression model were those that had a signii-cant association (p < 0,20) in the bivariate analysis. The inal model included variables with a signiicance level of p = 0.05 and those considered essential for the explanatory model.
The study protocol was approved by the Ethics Committee of each hospital included.
RESULTS
The city of Avellaneda had residences with better overall conditions and available basic services. It was also the city with the lowest variations for each indicator of the census fractions. On the other hand, the city of Ezeiza, with the worst situation concerning most part of the analyzed indicators, had high variations in the
census fractions. The distribution of the population was more homogeneous among municipalities, although the city of Avellaneda generally has the best situation regarding indicators (Table 1).
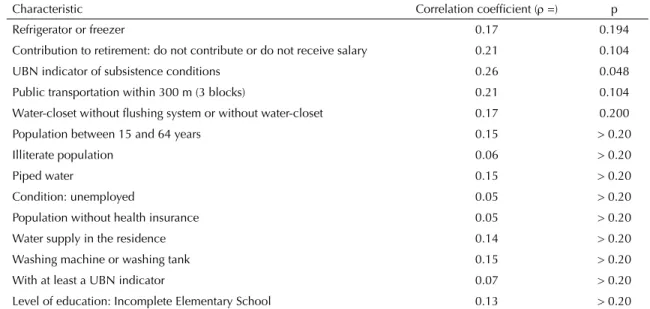
The risk of nonadherence was higher in areas with highest proportion of households without public trans-portation within 300 m (ρ = 0.21), as well as in areas with the highest proportion of residences that do not have refrigerator (with or without freezer) (ρ = 0.17) and those that have water-closet without flushing system or without water-closet (ρ = 0.17). The risk of nonadherence to the treatment was higher in areas with the highest proportion of households with UBN
related to subsistence (ρ = 0.26) and with a greater proportion of active population composed of workers that do not receive nor make social security contribu-tions (ρ = 0.21) (Table 2).
The employed population groups – those that do not receive from nor contribute to the system of Social Security Retirement – were more prone to nonad-herence (p = 0.007). Those who had the subsistence capacity as a deprivation of a basic need also had higher risk of not adhering to the treatment (p = 0.032). The probability of nonadherence increased for households that do not have public transportation network in area
Table 1. Characteristics of the area, residences, households and population related to the cases of tuberculosis. Sixth Health
Region (6th HR), Buenos Aires, Argentina, 2001.
Characteristic
Existence (%)
AB AV BZ EE EZ LZ QM Total
% % % % % % % %
Area and residences characteristics
Electricity per household 96.0 100 98.3 98.9 97.5 98.7 95.3 97.2 Paved Street 73.0 100 75.4 72.4 78.2 87.2 72.8 76.1 Waterwaste and sewage treatment system 13.0 85.3 73.8 4.9 2.0 6.7 59.0 37.5 Garbage collection service 87.3 100 95.3 89.8 97.2 92.9 88.7 91.5 Gas pipeline network 63.6 97.8 87.9 64.0 62.0 75.3 69.7 72.2 Electrical power installation 44.5 100 99.7 41.3 30.1 89.3 92.7 74.4 Deprived dwelling 34.8 2.4 23.1 38.0 39.3 31.0 30.0 30.7 Ceramic floors, flag stone or mosaic 48.1 75.8 56.2 41.3 38.4 53.0 52.5 50.4 Water supply in the residence 64.3 76.7 78.7 58.7 52.3 69.1 74.2 69.0 Public transportation within 300 m 90.2 100 89.9 85.2 81.8 89.9 84.9 87.2 Characteristics of households and population
Kitchen with piped water 62.0 77.5 75.2 56.0 48.7 68.4 71.2 66.1 Microwave oven 9.8 27.7 14.1 10.6 9.1 10.1 14.2 12.4 Overcrowding 7.1 10.2 5.8 7.2 8.7 6.3 5.9 6.4 Water-closet without flushing system or without water-closet 28.6 0.7 17.6 31.1 32.1 25.0 23.1 24.4 Refrigerator (with or without freezer) 81.8 77.6 85.1 81.0 76.5 82.0 82.4 81.9 Computer (with or without Internet) 8.9 23.6 13.7 10.1 9.2 9.7 12.5 11.6 Literate population 84.1 91.7 85.3 83.9 83.3 86.7 85.8 85.2 Population without health insurance 63.7 33.0 57.8 63.2 62.7 63.7 54.8 59.0 Telephone (landline, mobile or both) 53.1 69.5 58.3 53.9 49.0 54.8 54.4 54.8 No material deprivation in the residences 34.7 65.7 43.6 33.9 31.6 38.7 41.5 39.3 With material deprivation in the residences 21.4 0.2 16.1 21.7 23.2 19.7 19.0 19.2 With at least a UBN indicator 20.7 4.4 17.2 19.3 20.2 18.8 23.0 19.9 With UBN per subsistence condition 7.0 1.4 6.2 4.9 5.8 18.3 21.1 11.8 With one spouse unemployed or inactive 50.8 50.1 48.2 53.0 52.7 48.7 49.9 50.3 Population that contributes to or receives retirement funds 12.6 27.7 15.2 13.0 13.6 13.2 17.3 15.1 Unemployed population 17.5 12.3 18.7 16.0 14.5 19.8 17.3 17.3 Sources: Cross-sectional study (ECM, 2008)e and National Census of Population and Households, INDEC, 2001.g
within 300 m (p = 0.070). However these results were not statistically signiicant (Table 3).
Regarding the proportion of the active population that make no contributions to retirement funds, we could observe two stripes with lighter areas and a peripheral area demarcated out of it (dark areas) (Figure 2, A). We also observed a concentration of census fractions of the population that do not make retirement contri-butions nor receive them. The same pattern of distribu-tion was observed in all the region, that is, dark areas at the peripheral region and lighter color fractions at central areas where is the largest proportion of drop-outs. Regarding UBN related to subsistence capacity (Figure 2, B), the highest percentage of residences with this deprivation is concentrated mainly in two uniform places: Lomas de Zamora and Quilmes. About the avail -ability of public transportation within 300 m (Figure 2, C), we observed three stripes with lighter areas and a periphery demarcated beyond these areas, with lower percentages of availability of this service, where the proportion of nonadherence was higher, predominantly in Lomas de Zamora, the border with the capital, in the
city of Quilmes, mainly between Lomas de Zamora and Almirante Brown border, and most part of Ezeiza.
DISCUSSION
The areas with the highest proportion of population that do not receive nor contribute to retirement funds had a larger proportion of nonadherence to the treat-ment. That situation was also observed in areas with larger amounts of UBN households according to their subsistence capacity, and in the areas with the highest proportion of residences that had no public transport service within 300 m. The latter variable was included in the inal model, albeit its statistical signiicance were close to the signiicance level (p = 0.05), whereas it is the only variable related to accessibility barriers. On the other hand, the model that includes only the irst two indicators (“do not receive beneits from nor make contributions to retirement funds” and “UBN related to subsistence capacity”) do not differ on quality of the adjustment to the model, which also includes the transportation variable.
Table 2. Relationship between sociodemographic and socioeconomic characteristics and the proportion of nonadherence in
the selected municipalities. Sixth Health Region (6th HR), Buenos Aires, Argentina, 2001.
Characteristic Correlation coefficient (ρ =) p
Refrigerator or freezer 0.17 0.194
Contribution to retirement: do not contribute or do not receive salary 0.21 0.104 UBN indicator of subsistence conditions 0.26 0.048 Public transportation within 300 m (3 blocks) 0.21 0.104 Water-closet without flushing system or without water-closet 0.17 0.200 Population between 15 and 64 years 0.15 > 0.20
Illiterate population 0.06 > 0.20
Piped water 0.15 > 0.20
Condition: unemployed 0.05 > 0.20
Population without health insurance 0.05 > 0.20 Water supply in the residence 0.14 > 0.20 Washing machine or washing tank 0.15 > 0.20 With at least a UBN indicator 0.07 > 0.20 Level of education: Incomplete Elementary School 0.13 > 0.20 Source: Original compilation. Cross-sectional study (ECM, 2008)e and National Census of Population and Households, INDEC, 2001.g
Table 3. Multiple regression model for sociodemographic and socioeconomic characteristics related to the dropout proportion
in the selected municipalities. Sixth Health Region (6th HR), Buenos Aires, Argentina, 2001.
The analyzed studies of ecological type are important for diagnosing the population health, especially when the territory is analyzed in an exploratory way for the veriication of the spatial distribution pattern of a partic -ular health event.15-23
Rose19 has claimed that two aspects should be consid-ered in the etiology of health problems: the causes of individual cases and the determinants of disease rates among populations. In this sense, although strategies are essential for the individual risk prevention and
Figure 2. Distribution of the indicators of the multiple regression model and the dropout proportion. Selected municipalities
protection of individuals susceptible to treatment dropout, identifying the dropout determinants among populations is particularly relevant to the control of the disease.23 The analysis of risk variability at the ecological level is essential for understanding the social determinants of health and diseases and allows for the investigation of the hypothesis that the distri-bution of nonadherence in an area is related to the living conditions.23
The ability to inish the treatment is inluenced by the living conditions of the area in which the TB patients live. The proportion of nonadherence was higher in areas with the highest proportion of residences that do not have a public transport network in within 300 m, indicating dificulties related to access and mobility of the population. This indicator may be a proxy for other features of the area related to the availability of resources and services. The highest dropout rate was observed in areas with low levels of piped water and paved streets. The reason why these indicators have not been included in the inal model may be due to the small number of cases that have or not joined the study.
The results indicate higher dropout proportion in areas with the highest proportion of households with poor conditions and lower level of resources, as is the case of residences that have no refrigerator, or have water-closet without lushing system, or do not have water-closet. These results indicate a lower socioeco-nomic level in these areas.
The association between socioeconomic level and nonadherence to TB treatment has been analyzed in different countries and regions.6,8,10,16,22 In our study, the fact that tuberculosis has free treatment suggests that different factors related to treatment costs deter-mine the nonadherence of patients of low socioeco-nomic level.
There are other characteristics of the population associated with the largest dropout proportion, which are related to an increase in socioeconomic status of vulnerability in households with higher job insecurity, with lower levels of formal educa-tion of the head of household, and a lower number of individuals employed per household. The areas that had a higher percentage of households with four or more people per family member employed and which head of household has not completed the third grade of Elementary School (UNB per subsistence capacity) had a higher proportion of nonadherence. This indicator is a proxy for the level of household income according to the quan-tity of family members employed in relation to all members that are part of the family unit. For its turn,
this indicator also measures the lack of goods and services that are necessary to live and for an indi-vidual to feel part of the society based on a concep-tion of poverty as “deprivaconcep-tion”.i These results are
consistent with other studies that indicate that low income households are associated with the worst health outcomes.d On the other hand, this UBN
indicator includes the education level of the head of household. The studies that include the educational level in their analysis found a statistically signifi-cant association with adherence in the areas with a population with lower educational level.d We have
observed an increase in the proportion of nonadher-ence in areas where the population has Incomplete Elementary School. Several studies have shown that education can influence health practices of a population in its association with income level, employment conditions, as well as in its associa-tion with the level of knowledge that people have about these practices.21
The areas with the highest proportion of individ-uals employed without social protection have a higher percentage of nonadherence. Several studies have pointed out the inluence of patients working conditions on the nonadherence to treatment.17 Thus, employment reduces the ability to follow the treatment in the context of high rates of informal employment and low-income without social protec-tion, since that means for patients losing working days and income, i.e., basic income, as shown by Balasubramanian et al.2 In the study by Galiano & Montesinos,11 the highest rate of dropouts was also
associated with the condition of being male, employed and without social protection.
A limitation of this study is the use of the data from the 2001 National Census of Population and Households,h
since the up-to-date socioeconomic indicators were not available in the period in which the nonadherence cases were evaluated. This is the irst study conducted in Argentina with the purpose of detecting spatial distribution patterns of demographic and socioeco-nomic characteristics of the region and its relation with treatment dropout. The technological advances of geographic information systems (GIS) have allowed the incorporation of spatial structure of variables, with the advantage of analyzing the problem as a particularized social phenomenon in socioeconomic and sociodemographic conditions.15,23 The GIS and analysis of secondary data (census) are useful tools to identify the areas and conditions relevant to the process of nonadherence to TB treatment and for the monitoring based on territory to identify the prefer-ential population groups.
The increase in the proportion of nonadherence to TB treatment in 6th HR is related to residences in areas
with the highest proportion of active people that do not contribute to retirement funds, higher proportion of households deprived of basic needs (per subsistence capacity), and higher proportion of households that do not have public transportation within 300 m. Our results
lead us to establish a risk area to the nonadherence to treatment, characterized by a greater proportion of population living in poverty, poor working conditions, and with dificult access to public transportation. This information may result in the adoption of appropriate measures for the treatment of individuals that live in these areas and to reduce the risk of dropout.
1. Arrossi S, Herrero MB, Greco A, Ramos S. Factores predictivos de la no-adherencia al tratamiento de la tuberculosis en municipios del área metropolitana de Buenos Aires, Argentina. Salud Colectiva. 2012;8(1):65-76. DOI:10.1590/S1851-82652012000300012
2. Balasubramanian VN, Oommen K, Samuel R. DOT or not? Direct observation of anti-tuberculosis treatment and patient outcomes, Kerala State, India. The Int J Tuberc Lung Dis. 2000;4(5):409-13.
3. Barata RB. Epidemiologia social.
Rev Bras Epidemiol. 2005;8(1):7-17. DOI:10.1590/S1415-790X2005000100002
4. Braga JU, Pinheiro JS, Matsuda JS, Barreto JAP, Feijão AMM. Fatores associados ao abandono do tratamento da tuberculose nos serviços de atenção básica em dois municípios brasileiros, Manaus e Fortaleza, 2006 a 2008. Cad Saude Colet. 2012;20(2):225-33. 5. Brasil PE, Braga JU. Meta-analysis of factors
related to health services that predict treatment default by tuberculosis patients.
Cad Saude Publica. 2008;24(4):485-502. DOI:10.1590/S0102-311X2008001600003 6. Cáceres FM, Orozco LC. Incidencia y factores
asociados al abandono del tratamiento
antituberculoso. Rev Biomedica. 2007;27(4):498-504. DOI:10.7705/biomedica.v27i4.170
7. Center for Diseases Control. Core curriculum on tuberculosis: What the clinician should know. 4. ed. Atlanta: U.S. Department of Health & Human Services; 2000.
8. Culqui DR, Grijalva CG, Reategui SR, Cajo JM, Suárez LA. Factores pronósticos del abandono del tratamiento antituberculoso en una región endémica del Perú. Rev Panam Salud Publica. 2005;18(1):14-20. DOI:10.1590/S1020-49892005000600003
9. Diez Roux AV. A glossary for multilevel analysis. J Epidemiol Community Health. 2002;56(8):588-94. DOI:10.1136/jech.56.8.588
10. Galdós-Tangüis H, Caylá JÁ, García de Olalla P, Jansá JM, Brugal MT. Factors predicting non-completion of tuberculosis treatment among HIV-infected patients in Barcelona (1987-1996). Int J Tuberc Lung Dis.
2000;4(1):55-60.
11. Galiano M, Montesinos N. Modelo predictivo de abandono del tratamiento antituberculoso para la región Metropolitana de Chile. Enferm Clin. 2005;15(4):192-8. DOI:10.1016/S1130-8621(05)71111-6
12. Gonçalves MJ, Leon AC, Penna ML. A multilevel analysis of tuberculosis associated factors. Rev Salud Publica (Bogota). 2009;11(6):918-30.
13. Herrero MB, Greco A, Ramos S, Arrossi S. Del riesgo individual a la vulnerabilidad social: factores asociados a la no-adherencia al tratamiento de la tuberculosis. Revisión de la literatura. Rev Argent Salud Publica. 2011;2(8):36-42.
14. Krieger N. Glosario de epidemiología social.
Rev Panam Salud Publica. 2002;11(5-6):480-90. DOI:10.1590/S1020-49892002000500028 15. Lima MLC, Ximenes RA, Souza ER, Luna
CF, Albuquerque MFPM. Análise espacial dos determinantes socioeconômicos dos homicídios no estado no Pernambuco.
Rev Saude Publica. 2005;39(2):176-82. DOI:10.1590/S0034-89102005000200006
16. Mishra P, Hansen E, Sabroe S, Kafle K. Socio-economic status and adherence to tuberculosis treatment: a case-control study in a district of Nepal. Int J Tuberc Lung Dis. 2005;9(10):1134-9.
17. Nene B, Jayant K, Arrossi S, Shastri S, Budukh A, Hingmire S, et al. Determinants of women’s participation in cervical cancer screening trial, Maharashtra, India. Bull World Health Organ. 2007;85(4):264-72. DOI:10.2471/BLT.06.031195 18. O’Boyle S, Power J, Ibrahim M, Watson J. Factors affecting patient compliance with anti-tuberculosis chemotherapy using the directly observed treatment short-course strategy (DOTS). Int J Tuberc Lung Dis.
2002;6(4):307-12.
19. Rose G. Sick individuals and sick populations.
Int J Epidemiol. 2001;30(3): 427-32. DOI:10.1093/ije/30.3.427
20. Sabaté E. Adherencia a los tratamientos a largo plazo: pruebas para la acción. Geneva: Organización Mundial de la Salud; Organización Panamericana de la Salud; 2004.
21. Sabates R, Feinstein L. The role of education in the uptake of preventative health care: the case of cervical screening in Britain.
Soc Sci Med. 2006;62(12): 2998-3010. DOI:10.1016/j.socscimed.2005.11.032 22. Sosa Pineda N, Pereira S, Barreto M. Abandono
23. Souza WV, Albuquerque MFPM, Barcelos CC, Ximenes RA, Carvalho MS. Tuberculose no Brasil: construção de um sistema de vigilância de base territorial. Rev Saude Publica. 2005;39(1):82-89. DOI:10.1590/S0034-89102005000100011 24. Ximenes RAA, Albuquerque MFPM, Souza
WV, Montarroyos UR, Diniz GT, Luna CF. Is it
better to be rich in a poor area or poor in a rich area? A multilevel analysis of a case-control study of social determinants of tuberculosis. Int J Epidemiol. 2009;38(5):1285-96.
25. World Health Organization. Treatment of tuberculosis: guidelines for national programmes. 3. ed. Geneva; 2003.
Research supported by the Comisión Nacional Salud Investiga of the Ministry of Health of Argentina, 2008.
Based on the doctoral thesis of María Belén Herrero, titled: “Determinantes sociales de la adherencia al tratamiento de la tuberculosis en el Área Metropolitana de Buenos Aires. Un estudio de corte transversal con análisis jerarquizado”, to be presented in 2015 at the Postgraduate Program in Social Sciences of the Facultad de Ciencias Sociales, Universidad de Buenos Aires.