QTL mapping for yield components and agronomic
traits in a Brazilian soybean population
Josiane Isabela da Silva Rodrigues
1*, Fábio Demolinari de
Mi-randa
2, Newton Deniz Piovesan
1, Adésio Ferreira
3, Marcia
Flo-res da Silva Ferreira
2, Cosme Damião Cruz
4, Everaldo Gonçalves
de Barros
5and Maurilio Alves Moreira
6Abstract: The objective of this work was to map QTL for agronomic traits in a Brazilian soybean population. For this, 207 F2:3 progenies from the cross CS3035P -TA276-1-5-2 x UFVS2012 were genotyped and cultivated in Viçosa-MG, using randomized block design with three replications. QTL detection was carried out by linear regression and composite interval mapping. Thirty molecular markers linked to QTL were detected by linear regression for the total of nine agronomic traits. QTL for SWP (seed weight per plant), W100S (weight of 100 seeds), NPP (number of pods per plant), and NSP (number of seeds per plant) were detected by composite interval mapping. Four QTL with additive effect are promising for marker-assisted selection (MAS). Particularly, the markers Satt155 and Satt300 could be useful in simultaneous selection for greater SWP, NPP, and NSP. Key words: Glycine max, yield, quantitative trait locus, microsatellite markers.
Crop Breeding and Applied Biotechnology 16: 265-273, 2016 Brazilian Society of Plant Breeding. Printed in Brazil http://dx.doi.org/10.1590/1984-70332016v16n4a41
ARTICLE
*Corresponding author: E-mail: [email protected]
Received: 28 November 2014 Accepted: 21 December 2015
1 Universidade Federal de Viçosa (UFV), Departamento de Bioquímica e Biologia
Mo-lecular, Instituto de Biotecnologia Aplicada à
Agropecuária (BIOAGRO), 36.571-000, Viçosa, MG, Brazil. 2 Universidade Federal do Espírito Santo
(UFES), Departamento de Biologia,
29.500-000, Alegre, ES, Brazil 3 UFES, Departamento de Produção Vegetal,
29.500-000, Alegre, ES, Brazil
4 UFV, Departamento de Biologia Geral,
BIO-AGRO 5 Universidade Católica de Brasília, Quadra
SGAN 916, módulo B, bloco C, sala 213, 70.790-160, Brasília, DF, Brazil
6 In memoriam
INTRODUCTION
Soybean is by far the main export product in Brazil, and it is grown almost everywhere in the country. In the 2014/2015 season, its production accounted for 96.243 million tons, which corresponds to 46% of total grain yield in the country (CONAB 2015). Due to its economic importance in the Brazilian agricultural scenario, soybean breeding programs seek to develop more productive cultivars for the various Brazilian conditions.
Traditionally, productive parental lines are used to obtain new cultivars (Carter et al. 2004), which contribute to the narrowing of the genetic base of the improved germplasm, and raises difficulties to obtain further gains in yield. In addition to the low variability in the improved germplasm (Hyten et al. 2006), other factors also hinder the selection of productive cultivars, such as the environmental influence (Ainsworth et al. 2012), which reduces the efficiency of selection of superior genotypes, and the existing negative correlation between
grain yield and protein content (Popovic et al. 2012), since another purpose of breeding programs is the increase in the protein content of the grain. Facing
these difficulties, the knowledge of the genetic control involved with grain yield may direct more effective strategies for selection, such as marker-assisted selection (MAS).
In soybeans, several QTL have recently been mapped for traits related to
QTL are reported for traits related to weight and size of the seeds (Liu et al. 2011, Xu et al. 2011, Han et al. 2012, Sun et al. 2012, Hu et al. 2013, Liu et al. 2013, Pathan et al. 2013, Yesudas et al. 2013, Kato et al. 2014). Moreover, at least six QTL have been reported for grain yield, specifically (Palomeque et al. 2009, Sebastian et al. 2010, Kim et al. 2012, Fox et al. 2015), besides the several QTL mapped for other grain yield components from different populations (Chen et al.
2007, Guzman et al. 2007, Zhang et al. 2010, Liu et al. 2011, Liu et al. 2013).
According to the studies mentioned above, the genetic control of grain yield components involves several loci, and has strong environmental influence. For this reason, molecular markers have been used in the identification and location of QTL for strategies involving MAS, which can be useful in breeding for allowing indirect selection of agronomic traits from early generations and early stages of plant development. By using MAS, unfavorable alleles can be eliminated or greatly reduced at early generations, which allows the evaluation and selection of a small number of plants in the field. In another application, MAS can facilitate the introgression of favorable alleles in commercial materials from
non-adapted germplasm sources.
In spite of the number of QTL available in the literature for grain yield components in soybean, none of the QTL has
been mapped for Brazilian cultivars and/or in Brazilian soil and climate conditions. Thus, this study aims to map QTL for
yield components and agronomic traits from an F2:3 soybean populations, from the cross between a line and a Brazilian
cultivar, aiming at implementing MAS in breeding programs in the country.
MATERIAL AND METHODS
From the cross between the line CS3035PTA276-1-5-2 and the variety UFVS2012, it was obtained a population of 207
F2 plants. The F2 progenies were cultivated in a greenhouse, and young leaves were collected, frozen in liquid nitrogen,
and stored at -80 °C for subsequent DNA extraction. Phenotypic evaluation was carried out in F3 families cultivated in
the field, using a randomized block design with three replications. In each block, it was collected phenotypic values of five individuals per family. Cultivars BARC-8 and Monarca, and the parents CS3035PTA276-1-5-2 and UFVS2012 were also cultivated as controls. This trial was carried out in the Experimental Field Diogo Alves de Mello (lat 20° 45′ S, long 42° 52′ W, alt 650m asl), Viçosa, in the state of Minas Gerais, Brazil. The soil of the region is classified as clayey dystrophic red-yellow latosol.
In the F
3 generation, the following agronomic traits were evaluated: number of days to flowering (NDF), from the
emergence until 50% flowered plants in the row; number of days to maturity (NDM), from the emergence until 95% pods with maturation color; plant height at maturity (PHM), expressed in centimeters, from the ground level up to the last node on the main stem; height of the first pod (HFP), expressed in centimeters; number of nodes at maturity (NNM), counted on the main stem from the cotyledon node, at the R8 stage; number of pods per plant (NPP); seed weight per plant (SWP); weight of one hundred seeds (W100S); and number of seeds per plant (NSP). It was carried out analysis of variance of each variable using the GENES software (Cruz 2013). The statistical model used (family trial with intercalated controls) is illustrated below.
Yij = μ + gi + bj + εij
in which: Yij is the value of the trait for the i-th treatment in the j-th block; m, is the general mean of the treatments; gi, the
effect of the i-th treatment (i = 1,2, ..., t); bj, is the random block effect (j = 1,2, .., r), and εij is the random error of the control,
being εij~NID (0, s 2).
Broad-sense heritability (h2) and the coefficient of experimental variation (CVe) were obtained by the following
estimators:
h2 = (MSF–MSR)/MSF CVe = 100(MSF)0.5/μ
in which: MSF and MSR refer to the mean square of the families and mean square of the residue, respectively, and μ is the general mean. The components of residual variance (σ2), of genotype (σ2
g) and of controls (Фte) were estimated
σ2 = MSR/r
σ2
g = (MSF–QMR)/r
Фte = (MSC–QMR)/r
in which: MSR is the mean square of the residue; MSF is the mean square of the families; MSC is the mean square of the controls; and r is the number of replications. The hypothesis of normal distribution of the nine traits evaluated was tested by the Lilliefors test.
DNA extraction was carried out by the CTAB method, according to Doyle and Doyle (1990). Microsatellite markers used in the experiment were developed by Cregan et al. (1999), and the respective sequences of the pair of primers are available in the database Soybase (http://soybase.org/). PCR reactions were carried out in a total volume of 15 μL containing: Tris-HCl 10 mM, pH 8.3; KCl 50 mM; MgCl2 2 mM; Triton X100 0.1%; 100 μM of each deoxynucleotide; 0.3
μM of each microsatellite primer; a unit of Taq DNA polymerase (Phoneutria); and 30 ng DNA. PCR reactions had initial step at 94 °C for 4 min; 30 cycles of 94 °C for 1 min; 55 °C for 1 min, and 72 °C for 2 min; and a final step at 72 °C for 7 min. Amplification products were separated by electrophoresis in 10% polyacrylamide vertical gels, using 1X TAE buffer (40 mM Tris-acetate and 1 mM EDTA), and running time of three hours at 140 volts. Gels were stained with ethidium
bromide (1µg mL-1) and recorded with the aid of a photodocumentator device Eagle Eye II (Stratagene).
The individual segregation of molecular markers was tested by the chi-square test using the Bonferroni criteria (p <0.05). Molecular markers with an expected segregation (1:2:1) were grouped using a minimum LOD score of 3.0, and maximum recombination frequency of 30%. The Kosambi mapping function was used as a distance measure, and the Rapid Chain Delineation algorithm (RCD) (Doerge 1996) was used to define the order of the markers in the linkage groups. For the construction of the genetic map, it was used the GQMOL software (http://www.ufv.br/dbg/gqmol/gqmol.htm).
The association between the trait and molecular marker was determined by the single marker analysis, using linear regression (i.e., by the regression of the values of each quantitative trait in function of the scores related to the genotypes of the markers). The presence of the QTL in the intervals of the linkage map was evaluated by composite interval mapping for the nine traits (Jansen 1993, Zeng 1994). Selection of cofactors was based on the stepwise regression analysis, at 5% and 10% significance level for the input and output of independent variables, respectively. For some of the intervals, it was used cofactors of the linkage group (LG) and a significant association with the variable by the single marker analysis. The estimates of the additive and dominance value, the coefficient of determination corresponding to the peak of higher statistical significance of the QTL, and the position of each QTL were declared when the maximum likelihood ratio values (LR) exceeded the cut-off critical values (α = 0.05) in each LG. The critical LR values were determined by performing 1000 permutations. QTL analyses were carried out with the aid of the GQMOL (http://www.ufv.br/dbg/gqmol/gqmol/htm).
RESULTS AND DISCUSSION
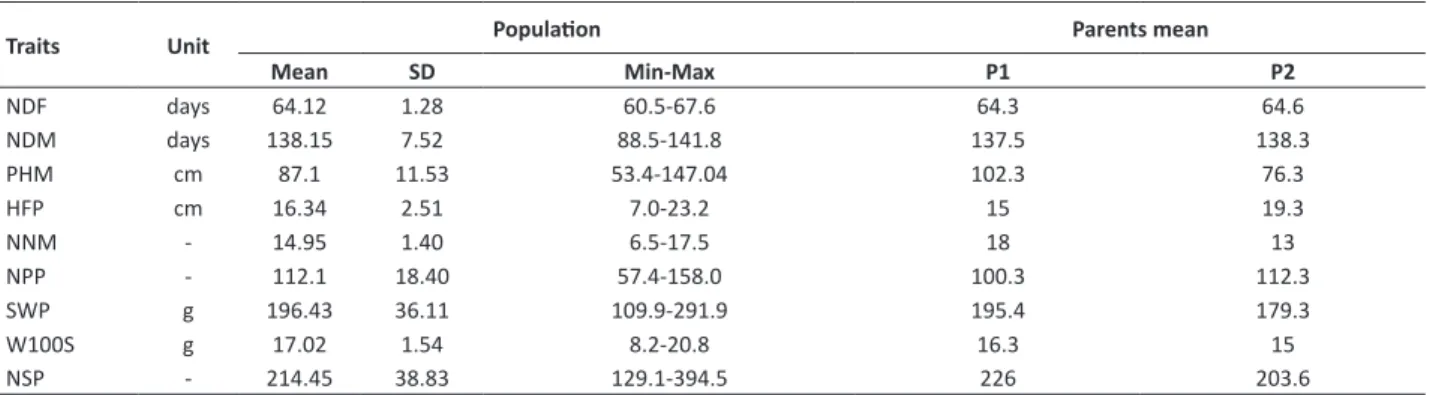
The analysis of variance of the agronomic traits indicated genetic variability for the nine traits at 1% probability, evidencing the potential of the population for QTL analysis (Table 1). The suitability of the population is also evidenced by the contrast observed between the means of the parents for most traits (Table 2). Although there was no difference between the means of the parents for the variables NDF, NDM and W100S, these traits presented transgressive segregation between the F3 families. The ratio CVg/CVe was high for all traits, especially for NDM, NNM and W100S, indicating that
most part of the variation was due to genetic variance. The coefficients of variation presented acceptable values, which were close to those observed by other authors in Brazilian conditions (Pires et al. 2012, Rocha et al. 2012, Barbosa et al. 2013, Torres et al. 2014), indicating good precision in controlling the causes of experimental variation. Broad-sense heritability values between traits ranged from 44.92 to 86.59%, including medium and high values. Estimates close to
those found for the same yield traits are reported in other studies on soybeans (Pooprompan et al. 2006, Vieira et al.
2006, Kim et al. 2012). Higher heritability coefficient was observed for the traits NDM, NNM and W100S, indicating that the phenotypic selection efficiency can be high, since the heritability expresses the proportion of total variance, which is attributed to the genetic variation (Falconer and Mackay 1996). High heritability values for the same traits are also reported by Eskandari et al. (2013) and Palomeque et al. (2009).
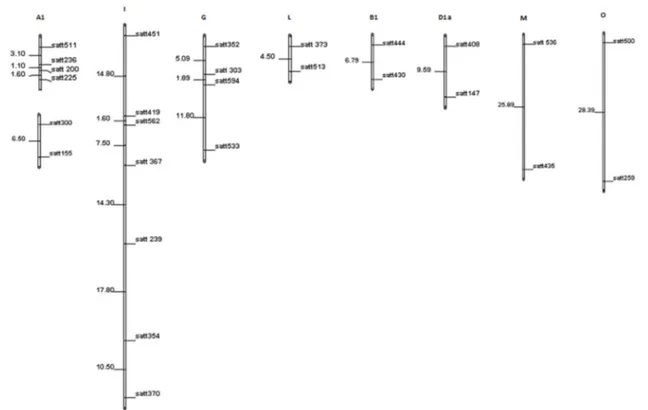
marker was tested using the chi-square test, and three molecular markers presented distorted segregation (Satt352, Satt429, and Satt454). However, these molecular markers did not occur in any of the intervals with significant association with the studied traits. In the linkage analysis, it was obtained nine LG by the grouping of 25 microsatellite markers, representing part of the LG A1, B1, D1a, G, I, M, and O (Figure 1). The position of the molecular markers in each LG coincided with the consensus map of the species, with the exception of the marker Satt370, which was located in LG I, while in the reference map (Song et al. 2004), the same marker is located was the LG D1a. As expected, 23 molecular markers were not grouped in any of the LG, since the distances between the markers were greater than 30 cM, according to the consensus map published by Song et al. (2004). The grouping of the molecular markers used LOD=3 and r=0.30 as criteria, but for eight of the nine LG, grouping also occurred with LOD=5, which shows the consistency of the groups.
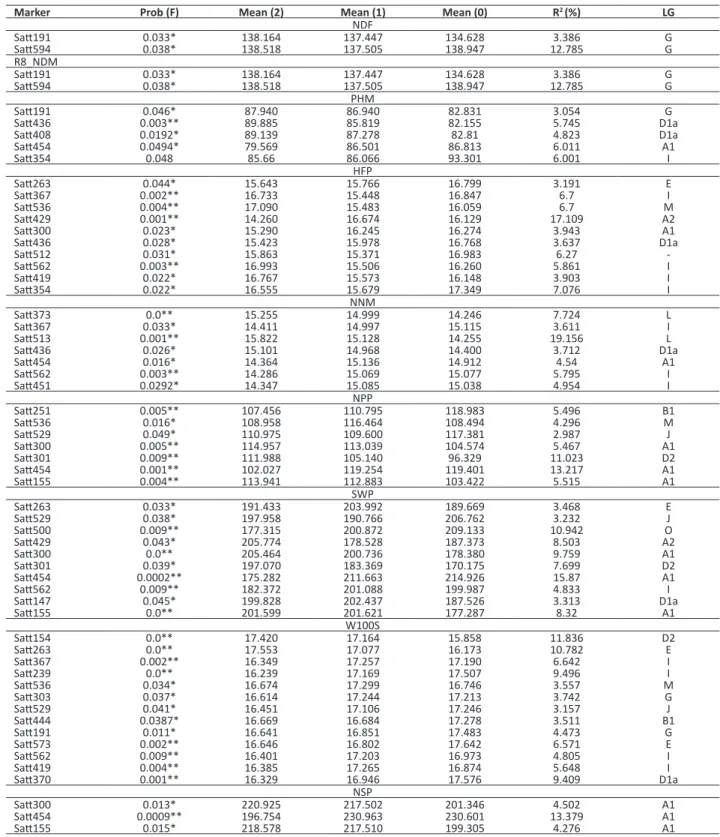
The association between trait and molecular markers was evaluated by means of linear regression, in which the significant effect indicates the existence of an association between a marker and a trait, due to genetic linkage between a marker and a QTL (Schuster and Cruz 2004). The associations detected in this method can be attributed to QTL of major effect and relatively distant from the marker, or to a QTL of minor effect and close to the marker. In total, 59 significant associations between markers and traits were observed in the single marker analysis using linear regression (Table 3). Table 1. Analysis of variance, means, coefficients of variation, and genetic parameter for agronomic traits in F3 generation of the cross between CS3032PTA276-1-5-2 and UFVS2012
Sources of variation df NDF NDM PHM HFP NNM NPP SWP W100S NSP
QM
Block 2 66.66 83.03 2413.27 33.90 8.62 2219.09 4450.41 105.18 23105.47 Treatment 210 6.47** 15.46** 358** 14.18** 5.50** 1025.57** 4135.42** 6.52** 4632.02** F3 Family 206 4.87** 8.83** 324.77** 14.04** 5.00** 967.78** 3919.46** 6.00** 4526.59** Controls 3 85.86** 335.44** 2608.97** 24.22* 41* 3225.41** 14285.80** 23.65** 8891.22* Fam vs Control 1 97.56** 421.57** 451.35* 12.04 2.47 6329.60** 18173.40* 61.54** 13572.77* Residue 420 2.43 2.03 156.77 6.391 0.806 410.34 1702.93 0.80 2493.14 General mean 64.07 138.03 86.99 16.32 14.95 111.66 195.70 16.98 213.81 Family mean 64.12 138.15 87.1 16.34 14.95 112.10 196.43 17.02 214.45 Control mean 61.25 132.16 80.91 15.33 14.5 88.91 157.14 14.74 180.5
σ2g 0.81** 2.26** 55.99** 2.55 1.40** 185.81** 738.34** 1.73** 677.81**
CVg 1.40 1.08 8.59 9.77 7.90 12.15 13.83 7.73 12.14
Heritability (%) 49.96 77 51.72 54.5 83.88 57.6 56.55 86.59 44.92
CV (%) 2.43 1.03 14.39 15.48 6.00 18.14 21.08 5.28 23.35
CVg/CVe 0.57 1.05 0.59 0.63 1.31 0.67 0.65 1.46 0.52
*, ** Significant at 5 and 1% probability by the F test; NDF = number of days to flowering; NDM = number of days to maturity; PHM = plant height at maturity; HFP = height of the first pod; NNM = number of nodes at maturity; NPP = number of pods per plant; SWP = seed weight per plant (g); W100S = weight of one hundred seeds (g); and NSP = number of seeds per plant.
Table 2. Descriptive analysis of the agronomic traits in the F3 generation, and means of the parents CS3032PTA276-1-5-2 (P1) and UFVS2012 (P2)
Traits Unit Population Parents mean
Mean SD Min-Max P1 P2
NDF days 64.12 1.28 60.5-67.6 64.3 64.6
NDM days 138.15 7.52 88.5-141.8 137.5 138.3
PHM cm 87.1 11.53 53.4-147.04 102.3 76.3
HFP cm 16.34 2.51 7.0-23.2 15 19.3
NNM - 14.95 1.40 6.5-17.5 18 13
NPP - 112.1 18.40 57.4-158.0 100.3 112.3
SWP g 196.43 36.11 109.9-291.9 195.4 179.3
W100S g 17.02 1.54 8.2-20.8 16.3 15
NSP - 214.45 38.83 129.1-394.5 226 203.6
Thirty molecular markers presented association with at least one variable, and the number of significant markers for each variable ranged from 2 to 13. Fifteen molecular markers also presented association with more than one trait. QTL for the respective trait in the same linkage groups have been reported (Reinprecht et al. 2006, Chen et al. 2007, Gai et al. 2007, Zhang et al. 2010, Liu et al. 2011, Kim et al. 2012). Other QTL related to these traits can also be found in the
Glicyne max (http://soybase.org/) genomic database.
QTL analysis in the intervals of the linkage map was carried out by composite interval mapping. In this method, additional markers are included as cofactors in the analysis, increasing the accuracy of the estimates of position and effect of the QTL. The inclusion of these markers reduces the effects caused by other QTL out of interval, which increases the power of the test, according to Schuster and Cruz (2004).
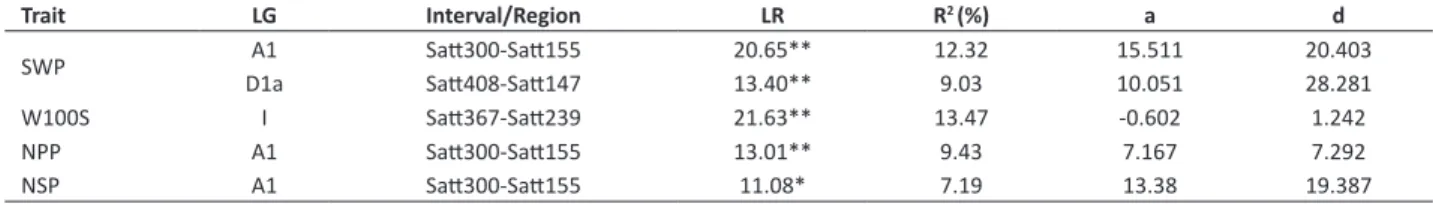
In the QTL analysis by composite interval mapping, it was detected five QTL for four of the nine studied traits (Table 4). Two QTL were identified for SWP, in the linkage groups A1 and D1a, which explained 12.32% and 9.03% of the total phenotypic variation, respectively (Table 4). Another QTL associated with W100S was mapped in LG I. This QTL located in the region of the locus Satt239 explained 13.47% of the variation. Two other QTL associated with NPP and NSP were mapped between the markers Satt300 and Satt155 in LG A1, in the same position of the QTL mapped for SWP. The variation in NPP and NSP explained by the QTL was of 9.43 and 7.19%, respectively. Probably, these QTL may be very close in the region of the marker Satt300, or alternatively, they can be a single QTL associated simultaneously to three variables, according to the hypothesis of pleiotropic effect.
QTL related to yield in LG A1 and I have been reported by other authors. In the same region of the molecular marker
Satt300, in LG A1, Chen et al. (2007) mapped one QTL, which explained 12.56% of the variation in seeds weight per plant, with estimated additive effect of 7.1 g. Another QTL associated with yield in the region of the same marker was mapped by Guzman et al. (2007), which explained 18% of the variation in yield, with estimated additive effect of 60 kg
ha-1. Another QTL for yield in the same region was reported by Palomeque et al. (2009).
Table 3. QTL analysis by single marker for agronomic traits from an F2:3 population derivative from a cross between CS3035PTA276-1-5-2 and UFVS2012
Marker Prob (F) Mean (2) Mean (1) Mean (0) R2 (%) LG
NDF
Satt191 0.033* 138.164 137.447 134.628 3.386 G
Satt594 0.038* 138.518 137.505 138.947 12.785 G
R8_NDM
Satt191 0.033* 138.164 137.447 134.628 3.386 G
Satt594 0.038* 138.518 137.505 138.947 12.785 G
PHM
Satt191 0.046* 87.940 86.940 82.831 3.054 G
Satt436 0.003** 89.885 85.819 82.155 5.745 D1a
Satt408 0.0192* 89.139 87.278 82.81 4.823 D1a
Satt454 0.0494* 79.569 86.501 86.813 6.011 A1
Satt354 0.048 85.66 86.066 93.301 6.001 I
HFP
Satt263 0.044* 15.643 15.766 16.799 3.191 E
Satt367 0.002** 16.733 15.448 16.847 6.7 I
Satt536 0.004** 17.090 15.483 16.059 6.7 M
Satt429 0.001** 14.260 16.674 16.129 17.109 A2
Satt300 0.023* 15.290 16.245 16.274 3.943 A1
Satt436 0.028* 15.423 15.978 16.768 3.637 D1a
Satt512 0.031* 15.863 15.371 16.983 6.27
-Satt562 0.003** 16.993 15.506 16.260 5.861 I
Satt419 0.022* 16.767 15.573 16.148 3.903 I
Satt354 0.022* 16.555 15.679 17.349 7.076 I
NNM
Satt373 0.0** 15.255 14.999 14.246 7.724 L
Satt367 0.033* 14.411 14.997 15.115 3.611 I
Satt513 0.001** 15.822 15.128 14.255 19.156 L
Satt436 0.026* 15.101 14.968 14.400 3.712 D1a
Satt454 0.016* 14.364 15.136 14.912 4.54 A1
Satt562 0.003** 14.286 15.069 15.077 5.795 I
Satt451 0.0292* 14.347 15.085 15.038 4.954 I
NPP
Satt251 0.005** 107.456 110.795 118.983 5.496 B1
Satt536 0.016* 108.958 116.464 108.494 4.296 M
Satt529 0.049* 110.975 109.600 117.381 2.987 J
Satt300 0.005** 114.957 113.039 104.574 5.467 A1
Satt301 0.009** 111.988 105.140 96.329 11.023 D2
Satt454 0.001** 102.027 119.254 119.401 13.217 A1
Satt155 0.004** 113.941 112.883 103.422 5.515 A1
SWP
Satt263 0.033* 191.433 203.992 189.669 3.468 E
Satt529 0.038* 197.958 190.766 206.762 3.232 J
Satt500 0.009** 177.315 200.872 209.133 10.942 O
Satt429 0.043* 205.774 178.528 187.373 8.503 A2
Satt300 0.0** 205.464 200.736 178.380 9.759 A1
Satt301 0.039* 197.070 183.369 170.175 7.699 D2
Satt454 0.0002** 175.282 211.663 214.926 15.87 A1
Satt562 0.009** 182.372 201.088 199.987 4.833 I
Satt147 0.045* 199.828 202.437 187.526 3.313 D1a
Satt155 0.0** 201.599 201.621 177.287 8.32 A1
W100S
Satt154 0.0** 17.420 17.164 15.858 11.836 D2
Satt263 0.0** 17.553 17.077 16.173 10.782 E
Satt367 0.002** 16.349 17.257 17.190 6.642 I
Satt239 0.0** 16.239 17.169 17.507 9.496 I
Satt536 0.034* 16.674 17.299 16.746 3.557 M
Satt303 0.037* 16.614 17.244 17.213 3.742 G
Satt529 0.041* 16.451 17.106 17.246 3.157 J
Satt444 0.0387* 16.669 16.684 17.278 3.511 B1
Satt191 0.011* 16.641 16.851 17.483 4.473 G
Satt573 0.002** 16.646 16.802 17.642 6.571 E
Satt562 0.009** 16.401 17.203 16.973 4.805 I
Satt419 0.004** 16.385 17.265 16.874 5.648 I
Satt370 0.001** 16.329 16.946 17.576 9.409 D1a
NSP
Satt300 0.013* 220.925 217.502 201.346 4.502 A1
Satt454 0.0009** 196.754 230.963 230.601 13.379 A1
Satt155 0.015* 218.578 217.510 199.305 4.276 A1
In LG I, Sebolt et al. (2000) mapped one QTL related to grain yield in two environments in the region of the marker Satt127, at approximately 2 cM from the interval of the QTL mapped in LG I in the present study, according to the reference map (Song et al. 2004). Moreover, from the combined data of five environments, Csanádi et al. (2001) mapped one QTL for the weight of one thousand seeds in the region of the marker Satt562, at approximately 5 cM from the same interval. Reinprechet et al. (2006) also observed an association of the molecular marker Satt367 with the weight of one hundred seeds in three environments. In addition, another marker in the LG I located at approximately 18 cM from Satt367, Satt354, was identified in two of the environments, according to the author. Another QTL in the LG I related to grain
yield (g plant-1) is reported by Du et al. (2009) between the molecular markers Satt102 and Sat419, at approximately 5
cM from the QTL described for W100S in the present study. Palomeque et al. (2009) and Palomeque et al. (2010) also found another marker in the LG I associated with grain yield (kg ha-1) in multiple environments (Satt162). However, this
marker is located in another region of LG I. In addition, another molecular marker related to yield was found in LG D1a, (Sat036), as reported by Orf et al. (1999), explaining 6% of the variation in seed weight (mg seed-1). This marker is found
at approximately 30 cM from the interval of the QTL mapped in this study.
In the present study, it was identified several molecular markers associated with nine agronomic traits, evidencing a large number of QTL involved in the control of the traits, and complexity in the genetic base related to grain yield in soybeans. Although several QLT related to grain yield have been described in the scientific literature, maybe only a few of them have already been confirmed (Kassem et al. 2006, Bernardo 2008, Sebastian et al. 2010). QTL, which have already been selected in breeding programs and/or transferred to new cultivars are rare (Ainsworth et al. 2012). Thus, further studies are still necessary, so that additive QTL was manipulated by MAS.
Table 4. QTL analysis by composite interval mapping for agronomic traits from an F2:3 soybean population
Trait LG Interval/Region LR R2 (%) a d
SWP A1 Satt300-Satt155 20.65** 12.32 15.511 20.403
D1a Satt408-Satt147 13.40** 9.03 10.051 28.281
W100S I Satt367-Satt239 21.63** 13.47 -0.602 1.242
NPP A1 Satt300-Satt155 13.01** 9.43 7.167 7.292
NSP A1 Satt300-Satt155 11.08* 7.19 13.38 19.387
LG = linking group according to Song et al. (2004); R2 = proportion of phenotypic variation explained by the QTL; a = estimated additive effect for the QTL; d = estimated
dominance effect for the QTL; *,** LR values that exceed the cut-off critical values at 5% and 1% probability, respectively. Critical LR values were determined by 1000 permutations. SWP = seed weight per plant (g); W100S = weight of one hundred seeds (g); NPP, number of pods per plant; and NSP = number of seeds per plant.
REFERENCES
Ainsworth EA, Yendrek CR, Skoneczka JA and Long SP (2012) Accelerating yield potential in soybean: potential targets for biotechnological improvement. Plant, cell & environment 35: 38-52.
Barbosa MC, Braccini AL, Scapim CA, Albrecht LP, Piccinin GG and Zucareli C (2013) Desempenho agronômico e componentes da produção de cultivares de soja em duas épocas de semeadura no arenito Caiuá.
Semina: Ciências Agrárias 34: 945-960.
Bernardo R (2008) Molecular markers and selection for complex traits in plants: Learning from the last 20 years. Crop Science 48: 1649-1664.
Carter Jr TE, Nelson RL, Sneller CH and Zhanglin C (2004) Genetic diversity in soybean. In Boerma HR and Specht JE (eds) Soybeans:
improvement, production, and uses. 3rd edn, American Society of
Agronomy, Madison, p. 303-416.
Chen Q, Zhang Z, Liu C, Xin D, Qiu H, Shan D, Shan C and Hu G (2007) QTL Analysis of major agronomic traits in soybean. Agricultural Sciences in China6: 399-405.
CONAB – Companhia Nacional de Abastecimento (2015) Acompanhamento
da safra brasileira/grãos. V.2 - Safra 2014/15. N.12 - Décimo segundo levantamento, Setembro/2015. 136p.
Cregan PB, Jarvik T, Bush AL, Shoemaker RC, Lark KG, Kahler AL, Kaya N, Van Toai TT, Lohnes DG, Chung J and Specht JE (1999) An integrated genetic linkage map of the soybean genome. Crop Science 39: 1464-1490.
Cruz CD (2013) GENES - a software package for analysis in experimental statistics and quantitative genetics. Acta Scientiarum Agronomy
35: 271-276.
Csanádi G, Vollmann J, Stift G and Lelley T (2001) Seed quality QTLs identified in a molecular map of early maturing soybean. Theoretical and Applied Genetics 103: 912-919.
Doerge RW (1996) Constructing genetic maps by rapid chain delineation.
Journal of Quantitative Trait Loci 2: 121-132.
Doyle JJ and Doyle JL (1990) A rapid DNA isolation procedure from small quantities of fresh leaf tissues. Phytochemical Bulletin19: 11-15. Du W, Wang M, Fu S and Yu D (2009) Mapping QTLs for seed yield and
36: 721-731.
Eskandari M, Cober ER and Rajcan I (2013) Genetic control of soybean seed oil: II. QTL and genes that increase oil concentration without decreasing protein or with increased seed yield. Theoretical and Applied Genetics 126: 1677-1687.
Falconer DS and Mackay TFC (1996) Introduction to quantitative genetics. Longman, Edinburgh, 464p.
Fox CM, Cary TR, Nelson RL and Diers BW (2015) Confirmation of a seed yield QTL in soybean. Crop Science 55: 992-998.
Gai J, Wang Y, Wu X and Chen S (2007) A comparative study on segregation analysis and QTL mapping of quantitative traits in plants with a case in soybean. Frontiers of Agriculture in China 1: 1-7.
Guzman PS, Diers BW, Neece DJ, St Martin SK, Leroy AR, Grau CR and Nelson RL (2007) QTL associated with yield in three backcross-derived populations of soybean. Crop Science 47: 111-122.
Han Y, Li D, Zhu D, Li H, Li X, Teng W and Li W (2012) QTL analysis of soybean seed weight across multi-genetic backgrounds and environments. Theoretical and Applied Genetics 125: 671-683.
Hu Z, Zhang H, Kan G, Ma D, Zhang D, Shi G and Yu D (2013) Determination of the genetic architecture of seed size and shape via linkage and association analysis in soybean (Glycine max L. Merr.). Genetica
141: 247-254.
Hyten DL, Song Q, Zhu Y, Choi IY, Nelson RL, Costa JM, Specht JE, Shoemaker RC and Cregan PB (2006) Impacts of genetic bottlenecks on soybean genome diversity. Proceedings of the National Academy
of Science - USA 103: 16666-16671.
Jansen RC (1993) Interval mapping of multiple quantitative trait loci. Genetics 135: 205-211.
Kassem MA, Shultz J, Meksem K, Cho Y, Wood AJ, Iqbal MJ and Lightfoot DA (2006) An updated ‘Essex’by ‘Forrest’linkage map and first composite interval map of QTL underlying six soybean traits. Theoretical and
Applied Genetics 113: 1015-1026.
Kato S, Sayama T, Fujii K, Yumoto S, Kono Y, Hwang TY and Ishimoto M (2014) A major and stable QTL associated with seed weight in soybean across multiple environments and genetic backgrounds. Theoretical and Applied Genetics 127: 1365-1374.
Kim KS, Diers BW, Hyten DL, Mian MAR, Shannon JG and Nelson RL (2012) Identification of positive yield QTL alleles from exotic soybean germplasm in two backcross populations. Theoretical and Applied Genetics 125: 1353-1369.
Liu W, Kim MY, Van K, Lee YH, Li H, Liu X and Lee SH (2011) QTL identification of yield-related traits and their association with flowering and maturity in soybean. Journal of Crop Science and Biotechnology 14: 65-70.
Liu YL, Li YH, Reif JC, Mette MF, Liu ZX, Liu B and Qiu LJ (2013) Identification of quantitative trait loci underlying plant height and seed weight in soybean. The Plant Genome 6: 1-11.
Orf JH, Chase K, Jarvik T, Mansur LM, Cregan PB, Adler FR and Lark KG (1999) Genetics of soybean agronomic traits: comparison of three related recombinant inbred populations. Crop Science39: 1642-1651.
Palomeque L, Li-Jun L, Li W, Hedges B, Cober ER and Rajcan I (2009) QTL in mega-environments: I. Universal and specific seed yield QTL detected in a population derived from a cross of high-yielding adapted x high-yielding exotic soybean lines. Theoretical and Applied Genetics 119: 417-427.
Palomeque L, Liu LJ, Li W, Hedges BR, Cober ER, Smid MP and Rajcan I (2010) Validation of mega-environment universal and specific QTL associated with seed yield and agronomic traits in soybeans. Theoretical and Applied Genetics 120: 997-1003.
Pathan SM, Vuong T, Clark K, Lee JD, Shannon JG, Roberts CA and Sleper DA (2013) Genetic mapping and confirmation of quantitative trait loci for seed protein and oil contents and seed weight in soybean.
Crop Science 53: 765-774.
Pires LPM, Peluzio JM, Cancellier LL, Ribeiro GR, Colombo GA and Afférri FS (2012) Desempenho de genótipos de soja, cultivados na região centro-sul do estado do Tocantins, safra 2009/2010. Bioscience Journal 28: 214-223.
Pooprompan P, Wasee S, Toojinda T, Abe J, Chanprame S and Srinives P (2006) Molecular marker analysis of days to flowering in vegetable soybean (Glycine max (L.) Merrill). Kasetsart Journal 40: 573-581.
Popovic V, Jaksic S, Glamoclija D, Grahovac N, Djekic V and Stefanovic VM (2012) Variability and correlations between soybean yield and quality components. Romanian Agricultural Research 29: 131-138.
Reinprecht Y, Poysa VW, Yu K, Rajcan I, Ablett GR and Pauls KP (2006) Seed and agronomic QTL in low linolenic acid, lipoxygenase-free soybean (Glycine max (L.) Merrill) germplasm. Genome 49: 1510-1527.
Rocha RS, Silva JAL, Neves JA, Sediyama T and Teixeira RC (2012) Desempenho agronômico de variedades e linhagens de soja em condições de baixa latitude em Teresina-PI1. Revista Ciência Agronômica 43: 154-162.
Schuster I and Cruz CD (2004) Estatística genômica aplicada a populações
derivadas de cruzamentos controlados. Editora UFV, Viçosa, 568p.
Sebastian SA, Streit LG, Stephens PA, Thompson JA, Hedges BR, Fabrizius MA, Soper JF, Schmidt DH, Kallem RL, Hinds MA, Feng L and Hoeck JA (2010) Context-specific marker-assisted selection for improved grain yield in elite soybean populations. Crop Science 50: 1196-1206.
Sebolt AM, Shoemaker RC and Diers BW (2000) Analysis of a quantitative trait locus allele from wild soybean that increases seed protein. Crop Science 40: 1438-1444.
Song QJ, Marek LF, Shoemaker RC, Lark KG, Concibido VC, Delannay X, Specht JE and Cregan PB (2004) A new integrated genetic linkage map of soybean. Theoretical and Applied Genetics 109: 122-128. Sun YN, Pan JB, Shi XL, Du XY, Wu Q, Qi ZM and Chen QS (2012)
Torres FE, Silva EC, Teodoro PE (2014) Desempenho de genótipos de soja nas condições edafoclimáticas do ecótono Cerrado-Pantanal. Interações 15: 71-78.
Vieira AJD, Oliveira DA, Soares TCB, Schuster I, Piovesan ND, Martínez CA, Barros EG and Moreira MA (2006) Use of the QTL approach to the study of soybean trait relationships in two populations of recombinant inbred lines at the F7 and F8 generations. Brazilian Journal of Plant Physiology 18: 281-290.
Xu Y, Li HN, Li GJ, Wang X, Cheng LG and Zhang YM (2011) Mapping quantitative trait loci for seed size traits in soybean (Glycine max L. Merr.). Theoretical and Applied Genetics 122: 581-594.
Yesudas CR, Bashir R, Geisler MB and Lightfoot DA (2013) Identification of germplasm with stacked QTL underlying seed traits in an inbred soybean population from cultivars Essex and Forrest. Molecular Breeding 31: 693-703.
Zeng ZB (1994) Precision mapping of quantitative trait loci. Genetics
136: 1457-1468.