Evaluation of Teaching Performance of English Courses by Applying Data
Envelopment Analysis and Two-phase Segmentation
Bernard Montoneri
Author’s Note
Abstract
Effective teaching performance is a crucial factor contributing to students’ learning improvement. Students’ ratings of teachers at the end of each semester can indirectly provide valuable information about teachers’ performance. This paper selects classes of freshmen students taking a course of English in a university of Taiwan from the academic year 2004 to 2006 as the research object. We adopt the data envelopment analysis, a reliable and robust evaluation method, to identify the relative efficiencies of each class. The calculation is performed in two phases. In phase 1, all the classes are in the same pool. The results of numerical analysis in phase 1 are used to clarify whether the existing teaching methods can achieve the desired results and what are the improved methods. Based on the calculation of phase 1, we segment all the classes into 2 groups according to their contribution of output indicators in calculating efficiency values. The empirical results are expected to identify more objective classes and to reveal that the evaluated classes refer to different efficient classes in different phases and their ranking order changes accordingly. This method can help to provide some concrete and practical teaching strategies for the inefficient classes.
Introduction
English remains an indispensable communication tool and a valuable skill for the English as second language learners who expect to enter the job market. In Asian non-Latin speaking countries such as Taiwan, Japan, China, and South Korea, students often struggle to have a good command of the English language in their professional life. Effective teaching performance is a crucial factor contributing to students’ learning improvement. Students’ ratings of teachers at the end of each semester can indirectly provide valuable information about teachers’ performance. Key performance indicators (KPIs) are measures of accomplishment. Without the evaluation of performance based on key factors and indicators, there will be no permanent change and improvement in the enhancement of the quality of educational institutions (Azma, 2010).
methods. Based on the calculation of phase 1, we segment all the classes into 2 groups according to their contribution of output indicators in calculating efficiency values. The empirical results are expected to identify more objective classes and to reveal that the evaluated classes refer to different efficient classes in different phases and their ranking order changes accordingly.
The remainder of this paper is organized as follows: section 2 (literature review) presents some academic studies in relation with our research. Section 3 (methodology and selected evaluated indicators) introduces the DEA model, explains the method used, presents the data and the important indicators discussed in this paper. Section 4 (empirical results and suggestions) presents the obtained numerical results based on the empirical data which include the efficiency analysis and the segmentation analysis. Section 5 draws the conclusions, limitations and directions of future studies.
Literature review
knowledge, and responsibilities, classroom-level student achievement gains, and school-wide achievement gains.
In 2002, the National Committee for the Evaluation of the University System (CNVSU) organized in Italy an expert team to devise a teaching evaluation questionnaire, the Short Form Questionnaire (SFQ), to ensure homogenous evaluation in all Italian universities (Iezzi, 2005). The SFQ defined several indicators, such as the structure of the degree, the organization of the course, didactic activity and study, infrastructures, and interest and satisfaction.
Loveland and Loveland (2003) discussed a large number of suggestions for improving the ratings of 10 factors identified as significant such as (in order of priority) knowledge of the subject, communication skills/ability, enthusiasm for the subject, encouragement of student participation, rapport with students, fairness in grading, timeliness in providing feedback, organization of class, adequacy of text-book and other learning materials, and instructor's preparation for class.
Wolf et al. (2004) described the weaknesses (poor delivery of course contents, being disorganized, inaccessible, and displaying weak teaching skills) and the qualities (being a knowledgeable and strategic teacher, creating a positive learning environment, demonstrating professionalism, demonstrating positive personal traits, and displaying scholarly traits) in faculty teaching performance.
and indicators such as score based on best 3 A levels or equivalent, gender, school, % of graduates who are female, % of graduates who did not attend an independent school, and pass/other. Johnes (2006) shows that measures of the efficiency of departments derived from individuals’ efficiencies are much more highly correlated with department level efficiency scores.
Martin (2006) applied DEA methodology and selected indicators concerning both the teaching and the research activity of the departments of the University of Zaragoza (Spain) in order to assess their performance. The inputs selected were human resources, financial resources and material resources; the outputs were credits registered × experimental coefficient, Ph.D. credits offered, Ph.D. completions, annual research incomes, and scientific production index.
McGowan & Graham (2009) highlighted four indicators contributing most to improved teaching: active/practical learning, teacher/student interactions, clear expectations/learning outcomes, and faculty preparation.
Wu and Li (2009) constructed a performance measure indicators system for higher education using four perspectives: financial, customer, internal process, and learning & growth. Zhou and Wang (2009) applied DEA to analyze the efficiency of 16 universities in China. Their performance indicators are teachers as labor power index, financial power, physical power, number of graduates, and scientific research.
contents, teaching skills, fair grading, and students’ learning performance. They showed that the evaluated classes may refer to different facet reference sets according to their actual values located in lower or higher ranges. As a result, inefficient evaluated classes may compare themselves with efficient evaluated classes in their range and make improvement little by little.
Various studies have been conducted on the KPIs of evaluation, but there is little consensus concerning the choice of indicators to assess the performance of teachers and educational institutions. The main purpose of this research is not to decide which indicators are the most suitable, but to find the more important indicators and help to formulate improvement suggestions for educators.
Methodology and selected evaluated indicators
The efficiency assessment is often conducted by DEA which can measure the relative efficiency of educational institutions from commonly available performance indicators. This paper uses DEA to investigate the indicators contributing to teaching performance in a university of Taiwan. We use students’ ratings of teachers (questionnaires filled at the end of each semester) about the course they follow.
Origins and application of DEA
function and concept of benchmarking and introduced the concept of multiple inputs and multiple outputs. The CCR (ratio) model is nowadays the most widely used DEA model. If the efficiency value of the CCR model equals 1, the evaluated unit is efficient (of optimal performance); if the efficiency value is less than 1, the evaluated unit needs some improvement (Lin et al., 2009; Lee, 2009).
DEA is a reliable and robust evaluation method which has notably been applied to assess the efficiency of educational institutions (Ahn et al., 1989; Johnes & Johnes, 1993; Ng & Li, 2000; Abbott and Doucouliagos, 2003; Johnes, 2006; García-Aracil and Palomares-Montero, 2008). It has also been applied more recently to assess the performance of various courses (Mathematics and Science in Ismail, 2009; English writing courses in Montoneri et al.,2011).
DEA model
Data selecting—input and output indicators
The data source
The study case is a private university established in 1956 in Taiwan. There are approximately 11,000 undergraduate students in the university. The data comes from the university’s online student rating system, which provides student feedback to professors at the end of each semester. Students are required to fill out the questionnaires.
The characteristics of the research object are as follows:
1. Freshmen students in a university of Taiwan from the academic year 2004 to 2006.
2. The classes are randomly selected from around 250 classes among 21 departments. English majors from the Department of English Language, Literature and Linguistics are not included.
3. English is a required course for freshmen for all the departments of the studied university. All the classes follow a similar course to meet the homogeneity of the evaluated object.
4. The English course is a 2-credit course (2 hours/week). Each teacher can choose the text-book of his/her choice. Most of the teachers propose group discussions and role plays during the class.
5. A total of 25 classes taught by full-time and part-time teachers are selected as the decision making units (DMUs), that is, the evaluated units. They are named from D1 to D25.
Department of Social Work and Child Welfare, Department of Applied Chemistry, Department of International Business, Department of Accounting, Department of Tourism, Department of Computer Science and Information Engineering, and Department of Finance.
The characteristics of the data source are as follows:
1. The data are based on questionnaires (10 questions) filled out by the students at the end of each semester for each class. Each question is rated from 1 (very unsatisfied) to 5 (very satisfied) by the students.
2. This paper aims at providing a method to identify the indicators contributing to teaching performance; this method can be applicable to different kinds of data and various types of courses.
3. To ensure the reliability of the questionnaires, at least half of the class must answer seriously. If a student gives ratings too different from the rest of the class, he/she is excluded.
4. The average scores of each question undergo a correlation analysis to test the reliability of the ratings and to find representative indicators in this study.
5. The data concerning the selected indicators is fed in the software Frontier Analyst to calculate the performance values of each evaluated class.
Input indicators
I1. Course clearly explained and easily assimilated: it refers to the degree of teachers’ professional knowledge for the preparation of the course.
I2. Good communication channels between the teacher and the students: it indicates whether the teacher can actively answer students’ queries and clear their doubts. It signifies whether teachers can adapt to students’ learning habits and their learning channels. This indicator may increase students’ learning interest and learning motivation.
Output indicators
O1. Students’ satisfaction about their grades: students fill the questionnaire before the end of the semester; therefore this indicator should not represent students’ immediate response to one particular grade, but a general appreciation of the fairness of grading during the whole semester.
O2. Students’ learning performance: it indicates students’ self-recognition of learning performance after receiving a period of language training. This indicator relates teacher quality to student achievement.
Correlation analysis of input and output indicators
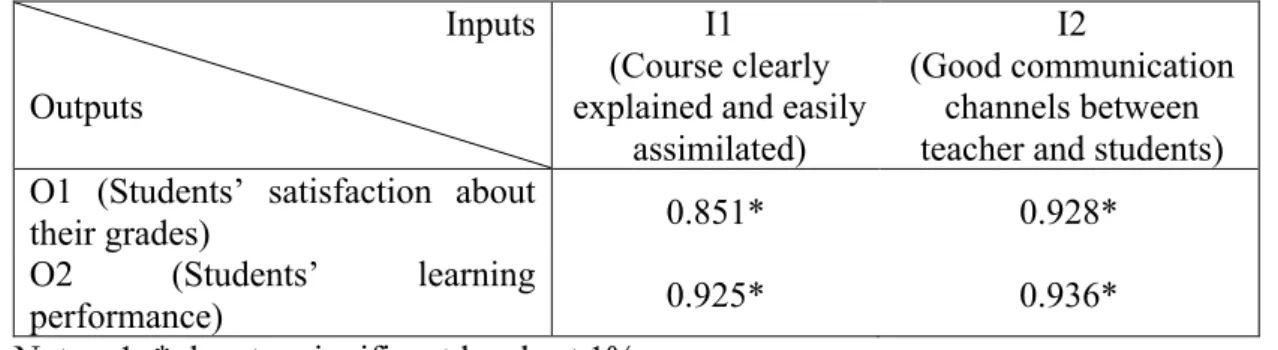
correlated. The correlation coefficients among the four selected indicators listed in Table 1 below are all above 0.8 with a significant level of 1%. This shows a very high degree of correlation. The principle of isotonicity is satisfied.
Table 1. Pearson correlation coefficients between input and output indicators. Inputs
Outputs
I1 (Course clearly explained and easily
assimilated)
I2
(Good communication channels between teacher and students) O1 (Students’ satisfaction about
their grades) 0.851* 0.928*
O2 (Students’ learning
performance) 0.925* 0.936*
Notes: 1. * denotes significant levels at 1%.
Empirical results and suggestions
DMUs’efficiency analysis in phase 1
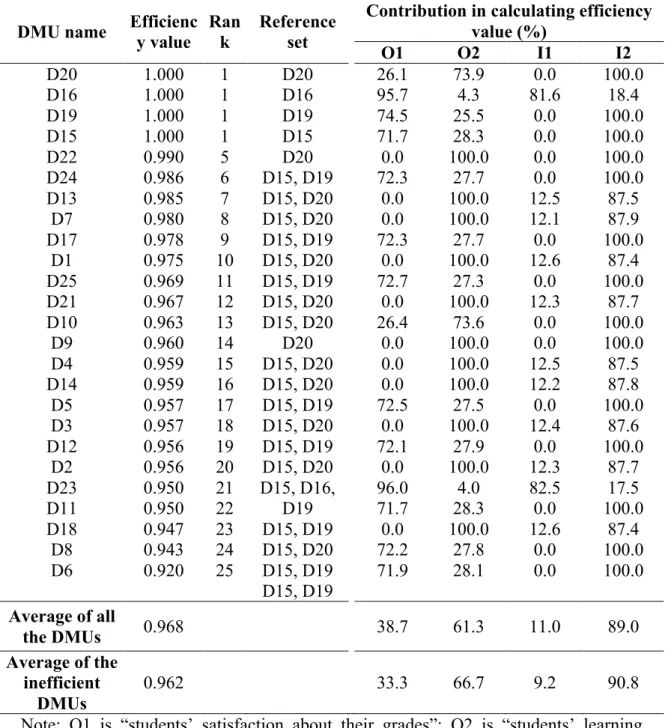
Table 2 lists some performance indicators of the DMUs which are ranked by descending order of “Efficiency value”. The DMUs with an efficiency value equal to 1 are efficient can constitute “reference sets” which form efficiency frontier curves. If the efficiency value is less than 1, the evaluated unit is inefficient. The efficient DMUs are the referring standards for other inefficient DMUs. The efficiency value of each DMU is calculated by the distance of their locations to the efficiency frontier curves. The results show that the average efficiency of all the DMUs is 0.968; that of the inefficient ones is 0.962. The efficiencies of the DMUs D15, D20, D19 and D16 in phase 1 show the best performance with value of 1. That is, they are all on the efficiency frontier curves without the need of further improvement in the inputs and outputs. The inefficient DMUs can improve their efficiency by referring to the efficient DMUs of their reference set.
communication channels between the teacher and the students. The input and output indicators’ average contributions for all the DMUs reveal that O2 and I2 are the major indicators in the efficiency evaluation of studied empirical example, with 61.3% and 80.9%, respectively. That is, generally speaking, the students’ learning performance is the major output indicator and the good communication channels between the teacher and the students is the major input indicator.
Table 2 Relative performance indicators of DMUs in phase 1
DMU name Efficienc
y value Ran
k
Reference set
Contribution in calculating efficiency value (%)
O1 O2 I1 I2
D20 D16 D19 D15 D22 D24 D13 D7 D17 D1 D25 D21 D10 D9 D4 D14 D5 D3 D12 D2 D23 D11 D18 D8 D6 1.000 1.000 1.000 1.000 0.990 0.986 0.985 0.980 0.978 0.975 0.969 0.967 0.963 0.960 0.959 0.959 0.957 0.957 0.956 0.956 0.950 0.950 0.947 0.943 0.920 1 1 1 1 5 6 7 8 9 10 11 12 13 14 15 16 17 18 19 20 21 22 23 24 25 D20 D16 D19 D15 D20 D15, D19 D15, D20 D15, D20 D15, D19 D15, D20 D15, D19 D15, D20 D15, D20 D20 D15, D20 D15, D20 D15, D19 D15, D20 D15, D19 D15, D20 D15, D16, D19 D15, D19 D15, D20 D15, D19 D15, D19 26.1 95.7 74.5 71.7 0.0 72.3 0.0 0.0 72.3 0.0 72.7 0.0 26.4 0.0 0.0 0.0 72.5 0.0 72.1 0.0 96.0 71.7 0.0 72.2 71.9 73.9 4.3 25.5 28.3 100.0 27.7 100.0 100.0 27.7 100.0 27.3 100.0 73.6 100.0 100.0 100.0 27.5 100.0 27.9 100.0 4.0 28.3 100.0 27.8 28.1 0.0 81.6 0.0 0.0 0.0 0.0 12.5 12.1 0.0 12.6 0.0 12.3 0.0 0.0 12.5 12.2 0.0 12.4 0.0 12.3 82.5 0.0 12.6 0.0 0.0 100.0 18.4 100.0 100.0 100.0 100.0 87.5 87.9 100.0 87.4 100.0 87.7 100.0 100.0 87.5 87.8 100.0 87.6 100.0 87.7 17.5 100.0 87.4 100.0 100.0
Average of all
the DMUs 0.968 38.7 61.3 11.0 89.0
Average of the inefficient
DMUs
0.962 33.3 66.7 9.2 90.8
Note: O1 is “students’ satisfaction about their grades”; O2 is “students’ learning performance”; I1 is “course clearly explained and easily assimilated”; I2 is “good communication channels between the teacher and the students”.
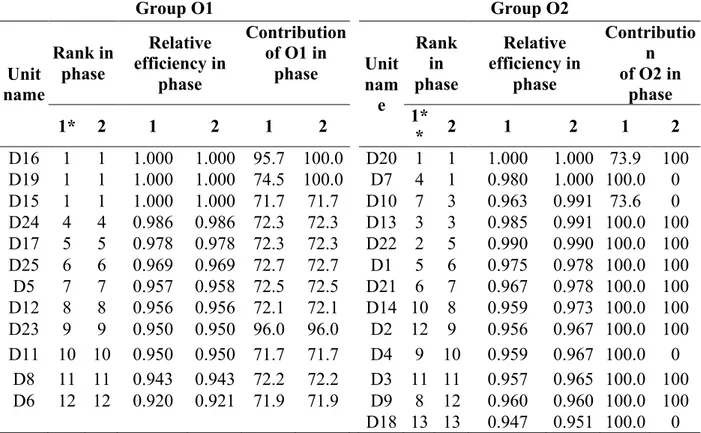
DMUs’ efficiency analysis in phase 2 — Segmentation of DMUs by output indicators’ contribution
which contains 12 DMUs: D16, D19, D15, D24, D17, D25, D5, D12, D23, D11, D8 and D6. The DMUs with O2’s contribution superior to 50% are classified as the group O2 which contains 13 DMUs: D20, D7, D10, D13, D22, D1, D21, D14, D2, D4, D3, D9 and D18. For example, D16 belonging to group O1 has O1’s contribution (95.7%) superior to that of O2 (4.3%).
In phase 2, the calculation of each DMU’s relative efficiency is separately conducted in the two groups and the efficient frontier curves are reconstituted in the two different segmented groups. Table 3 includes each DMU’s relative efficiency, rank order and output indicators’ contribution in calculating relative efficiency in phase 1 and phase 2. The results reveal that:
One new efficient DMU appears in phase 2. The 3 efficient DMUs (D16, D19, and
D15) in phase 1 are still efficient in phase 2; but one more DMU (D7) becomes efficient in phase 2 and is located in the segmented group O2. Because the segmentation according to output indicators’ contribution makes the new reconstituted frontier curves in group O1 now closer to the O1 value and in group O2 now closer to the O2 value, this results in a new efficient DMU appearing in group O2 in phase 2.
Inefficient DMUs refer to different efficient DMUs in different phases. Because 3 of the 4 efficient DMUs in phase 1 now belong to group O1, one other efficient DMU belongs to group O2. This implies that after the segmentation, the efficient frontier curves are recalculated and the efficient DMUs can probably be changed; some of the inefficient DMUs in group O1 originally referring to the efficient DMUs which are now located in group O2 have to refer to different efficient DMUs, because they are in different pools. For example, the two inefficient DMUs of group O2, D1 and D21, originally referred to the efficient DMUs D15 and D20 in phase 1; because D15 is located in group O1 in phase 2, they refer to the efficient DMUs D20 and D7 instead.
Ranking order changes in different phases. In group O1, the 12 DMUs’ ranking order in phase 1 is the same as that in phase 2; however, in group O2, the 13 DMUs’ ranking order in phase 1 is different from that in phase 2. For example, D22, D1, D21, D4, and D9 have higher rank in phase 1 than in phase 2; and D7, D10, D14 and D2 have lower rank in phase 1 than in phase 2. Only 4 DMUs in group O2 keep the same ranking order as in phase 1. There is one new efficient DMU in group O2 because the new frontier curves are closer to O2 in phase 2. Group O2’s efficiency values are equivalent or slightly higher in phase 2 than in phase 1.
More objective DMUs appear. In group O2, the major indicator of DMUs D7, D10,
are more suitable for designing questionnaires concerning teaching performance evaluation.
Table 3. DMUs’ relative efficiency ranks and output indicators’ contribution in two phases
Group O1 Group O2
Unit name
Rank in phase
Relative efficiency in
phase
Contribution of O1 in
phase Unit
nam e
Rank in phase
Relative efficiency in
phase
Contributio n of O2 in
phase
1* 2 1 2 1 2 1*
* 2 1 2 1 2
D16 1 1 1.000 1.000 95.7 100.0 D20 1 1 1.000 1.000 73.9 100 D19 1 1 1.000 1.000 74.5 100.0 D7 4 1 0.980 1.000 100.0 0 D15 1 1 1.000 1.000 71.7 71.7 D10 7 3 0.963 0.991 73.6 0 D24 4 4 0.986 0.986 72.3 72.3 D13 3 3 0.985 0.991 100.0 100 D17 5 5 0.978 0.978 72.3 72.3 D22 2 5 0.990 0.990 100.0 100 D25 6 6 0.969 0.969 72.7 72.7 D1 5 6 0.975 0.978 100.0 100 D5 7 7 0.957 0.958 72.5 72.5 D21 6 7 0.967 0.978 100.0 100 D12 8 8 0.956 0.956 72.1 72.1 D14 10 8 0.959 0.973 100.0 100 D23 9 9 0.950 0.950 96.0 96.0 D2 12 9 0.956 0.967 100.0 100 D11 10 10 0.950 0.950 71.7 71.7 D4 9 10 0.959 0.967 100.0 0
D8 11 11 0.943 0.943 72.2 72.2 D3 11 11 0.957 0.965 100.0 100 D6 12 12 0.920 0.921 71.9 71.9 D9 8 12 0.960 0.960 100.0 100 D18 13 13 0.947 0.951 100.0 0
Conclusions and suggestions
This paper applies DEA to calculate the relative efficiency values of 25 evaluated classes under an output oriented CCR model. The calculations are conducted in two phases. In phase 1, all the 25 DMUs are in the same pool. The results are used to clarify the relative efficiency of each DMU and the indicators’ contribution in calculating efficiency value. All the inefficient DMUs of group O1 (D24, D17, D25, D5, D12, D23, D11, D8 and D6) are suggested to concentrate teaching effort on indicator O1 (students’ satisfaction about their grades) in order to increase their relative efficiency in short term. Teachers are suggested to announce grading criteria as clearly and early as possible in order to guide students and to answer their questions and doubts before the exams. After the exams, teachers should give a correction and advices to students. Students who have a bad grade sometimes give up and drop the class. Under these circumstances, communication channels between the teacher and the students should be fast and clear. Students need to feel that teachers care about them. In addition, teachers can offer them some help after the class or during the office hours. Students need to know why they failed, and more important, what they can do to improve their level. This will help enhance students’ learning motivation and increase the value of O2 (students’ learning performance) at the same time. All the inefficient DMUs of group O2 (D17, D25, D5, D12, D23, D11, D8 and D6) are suggested to concentrate teaching effort on indicator O2 in order to increase their relative efficiency in short term. Teachers can offer students help outside the class (teaching website, English corner, office hours).
segmentation is to regroup DMUs of similar characteristics and to identify the more objective DMUs which are suitable for designing questionnaires concerning teaching performance evaluation. The analysis of phase 2 shows that except D7, D10, D4 and D18, all other DMUs are more suitable for designing questionnaires. It means that on 25 DMUs, 21 can provide reliable information to educators and decision-makers. The results may of course vary according to the year, the subject matter, the departments and the classes selected.
References
Abbott, M., & Doucouliagos, C. (2003). The efficiency of Australian universities: A data envelopment analysis. Economics of Education Review, 22(1), 89-97. Ahn, T., Arnold, V., Charnes, A., & Cooper, W. W. (1989). DEA and ratio efficiency
analyses for public institutions of higher learning in Texas. Research in Governmental and Nonprofit Accounting, 5, 165-185.
Azma, F. (2010). Qualitative Indicators for the evaluation of universities performance. Procedia Social and Behavioral Sciences, 2(2), 5408–5411. Charnes, A., Cooper, W. W., & Rhodes, E. (1978). Measuring the inefficiency of
decision making units. European Journal of Operational Research, 2(6), 429-444.
Farrell, M. J. (1957). The measurement of productive efficiency. Journal of the Royal Statistical Society Series A. General, 120(3), 253-282.
Førsund, F. R., & Sarafoglou, N. (2002). On the Origins of Data Envelopment Analysis. Journal of Productivity Analysis, 17(1-2), 23–40.
García-Aracil, A., & Palomares-Montero, D. (2008). Changes in universities’ efficiency over the time: Differentials according to the missions. First ISA Forum of Sociology: Sociological Research and Public Debate, Barcelona. Iezzi, D. F. (2005). A method to measure the quality on teaching evaluation of the
university system: The Italian case. Social Indicators Research, 73, 459-477. Ismail, I. (2009). English in the Teaching of Mathematics and Science Subjects
Johnes, G., & Johnes, J. (1993). Measuring the research performance of UK economics departments: An application of data envelopment analysis. Oxford Economic Papers, 45, 332–347.
Johnes, J. (2006). Measuring teaching efficiency in higher education: an application of data envelopment analysis to economics graduates for UK universities. European Journal of Operational Research, 174, 443-456.
Lee, C. C.(2009). Analysis of overall technical efficiency, pure technical efficiency and scale efficiency in the medium-sized audit firms.Expert Systems with Applications, 36(8), 11156-11171.
Lin, T. T., Lee, C. C., & Chiu, T. F. (2009). Application of DEA in analyzing a bank’s operating performance. Expert Systems with Applications, 36 (5), 8883-8891.
Loveland, K.A., & Loveland, J.P. (2003). Student evaluations of online versus on-campus classes. Journal of Business and Economics Research, 1(4), 1-10. Martin, E. (2006). Efficiency and Quality in the Current Higher Education Context in
Europe: an application of the data envelopment analysis methodology to performance assessment of departments within the University of Zaragoza. Quality in Higher Education, 12(1), 57-79.
McGowan, W. R., & Graham, C. R. (2009). Factors contributing to improved teaching performance. Innovative Higher Education, 34(3), 161-171. Milken, L. (2000). Teaching As the Opportunity: The Teacher Advancement
Montoneri, B., Lee, C. C., Lin, T. T., &. Huang, S. L. (2011). A Learning Performance Evaluation with Benchmarking Concept for English Writing Courses. Expert Systems with Applications, 38(12), 14542-14549.
Ng, Y. C. & Li, S. K. (2000). Measuring the research performance of Chinese higher education institutions: an application of data envelopment analysis. Education Economics, 8(2), 139–56.
Sanders, W. L. & Horn, S. P. (1998). Research Findings from the Tennessee Value-Added Assessment System (TVAAS) Database: Implications for Educational Evaluation and Research. Journal of Personnel Evaluation in Education, 12(3), 247-256.
Wolf, Z. R., Bender, P. J., Beitz, J. M., Wieland, D. M., & Vito, K. O. (2004). Strengths and weaknesses of faculty teaching performance reported by undergraduate and graduate nursing students: a descriptive study. Journal of Professional Nursing, 20(2), 118-128.
Wu, Y., & Li, C. (2009). Research on performance evaluation of higher education based on the model of BSC-DRF-DEA. 16th International Conference on Industrial Engineering and Engineering Management. IE&EM '09, 2030-2034. Zhou, C., & Wang, M. (2009). The Evaluation Research on Higher Education