Phylogeographic and Demographic Analysis
of the Asian Black Bear (
Ursus thibetanus
)
Based on Mitochondrial DNA
Jiaqi Wu1¤, Naoki Kohno2,3
*, Shuhei Mano4, Yukio Fukumoto5, Hideyuki Tanabe6, Masami Hasegawa1,4, Takahiro Yonezawa1,4,6*
1School of Life Sciences, Fudan University, SongHu Rd. 2005, Shanghai, 200438, China,2Department of Geology and Paleontology, National Museum of Nature and Science, Amakubo 4-1-1, Tsukuba, Ibaraki, 305–0005, Japan,3Graduate School of Life and Environmental Sciences, University of Tsukuba, Tennoudai 1-1-1, Tsukuba, Ibaraki, 305–8572, Japan,4The Institute of Statistical Mathematics, Midori-cho 10–3, Tachikawa, Tokyo, 190–8562, Japan,5Hiroshima City Asa Zoological Park, Asakita-ku, Hiroshima city, Hiroshima, 731–3355, Japan,6School of Advanced Sciences, The Graduate University for Advanced Studies, Shonan Village, Hayama, Kanagawa, 240–0193, Japan
¤ Current Address: Graduate School of Agricultural and Life Sciences, The University of Tokyo, Yayoi 1-1-1, Bunkyo-ku, Tokyo, 113–8657, Japan
*kohno@kahaku.go.jp(NK);cyclotis@gmail.com(TY)
Abstract
The Asian black bearUrsus thibetanusis widely distributed in Asia and is adapted to broad-leaved deciduous forests, playing an important ecological role in the natural environment. Several subspecies ofU.thibetanushave been recognized, one of which, the Japanese black bear, is distributed in the Japanese archipelago. Recent molecular phylogeographic studies clarified that this subspecies is genetically distantly related to continental subspe-cies, suggesting an earlier origin. However, the evolutionary relationship between the Japa-nese and continental subspecies remained unclear. To understand the evolution of the Asian black bear in relation to geological events such as climatic and transgression-regres-sion cycles, a reliable time estimation is also essential. To address these issues, we deter-mined and analyzed the mt-genome of the Japanese subspecies. This indicates that the Japanese subspecies initially diverged from other Asian black bears in around 1.46Ma. The Northern continental population (northeast China, Russia, Korean peninsula) subsequently evolved, relatively recently, from the Southern continental population (southern China and Southeast Asia). While the Japanese black bear has an early origin, the tMRCAs and the dynamics of population sizes suggest that it dispersed relatively recently in the main Japa-nese islands: during the late Middle and Late Pleistocene, probably during or soon after the extinction of the brown bear in Honshu in the same period. Our estimation that the popula-tion size of the Japanese subspecies increased rapidly during the Late Pleistocene is the first evidential signal of a niche exchange between brown bears and black bears in the Jap-anese main islands.
This interpretation seems plausible but was not corroborated by paleontological evi-dence that fossil record of the Japanese subspecies limited after the Late Pleistocene. We
OPEN ACCESS
Citation:Wu J, Kohno N, Mano S, Fukumoto Y, Tanabe H, Hasegawa M, et al. (2015)
Phylogeographic and Demographic Analysis of the Asian Black Bear (Ursus thibetanus) Based on Mitochondrial DNA. PLoS ONE 10(9): e0136398. doi:10.1371/journal.pone.0136398
Editor:Michael Hofreiter, University of York, UNITED KINGDOM
Received:June 26, 2014
Accepted:August 4, 2015
Published:September 25, 2015
Copyright:© 2015 Wu et al. This is an open access article distributed under the terms of theCreative Commons Attribution License, which permits unrestricted use, distribution, and reproduction in any medium, provided the original author and source are credited.
Data Availability Statement:All relevant data are within the paper and its Supporting Information files. Nucleotide sequence data were deposited in DDBJ under the accession number AB863014.
Funding:This study was supported by National Natural Foundation for the Foreign Young Scientist to T.Y., Graduate innovation fund EZH6281304/001/029 of Fudan University to J.W., and a Grant in Aid for Scientific Research (C25440219) from JSPS to M.H.
also report here a new fossil record of the oldest Japanese black bear from the Middle Pleis-tocene, and it supports our new evolutionary hypothesis of the Japanese black bear.
Introduction
The Asian black bear (Ursus thibetanus) is a middle-sized bear that is widely distributed in Asia, from Japan in the east to Iran in the west. Fossil evidence suggests a broader distribution area in the past, that extended to Southern Siberia (near Lake Baikal), East Europe (Moldova) and West Europe (Germany and France) [1–3].
WhileU.thibetanusis adapted to broad-leaved deciduous forests [1,4], it is omnivorous, and the Japanese population, in particular, depends more on vegetation than meat [1]. On the other hand, these bears are more aggressive than the American black bear (U.americanus) and the Old World brown bear (U.arctos), and they sometimes kill animals such as cattle, sheep, ponies and occasionally humans [4]. In spite of their ecological importance, little is known about the evolutionary history ofU.thibetanus.
U.thibetanusis classified into several subspecies [2,5,6] and, according to Steinmetz and Garshelis [7], can be divided into three extant populations. The first population occupies all continental Southeast Asian countries except Malaysia, and is also found in patches in southern China. This population also has narrow latitudinal distribution from southeastern Iran east-ward through Central Asia (Pakistan and Afghanistan), and the foothills of the Himalayas. The second population is distributed in northeastern China, the southern Russian Far East, and into North Korea, as well as South Korea. The third population is found in the Japanese Islands including Honshu, Shikoku and Kyushu, but the local population in Kyushu has probably gone extinct [8]. We refer to these populations as the south continental population, the north conti-nental population and the Japanese population, respectively.
Recent molecular phylogeographic analyses have clarified that the Japanese population is genetically distant from the two continental populations, and suggested its earlier origin [8,9]. Subsequently, to evaluate the genetic diversity of the continental population, Kim et al. [10] extensively collected samples both from the north and the south continental population (the latter from Vietnam) and reconstructed a phylogenetic tree that included the Japanese popula-tion. Their resulting tree indicated that the north continental population and the Japanese pop-ulation evolved relatively recently from the south continental poppop-ulation.
Despite these studies, evolutionary time estimates for Asian black bear populations are still controversial. For example, the divergence time between the Japanese and continental popula-tion (both north and south) has been estimated as around 0.5 Ma (Mega annum) [9] and 1.4–
2.6 Ma [8]. Both studies used divergence times at the genus (Ursus) level as calibration points: Yasukochi et al. [9] assumed that the split betweenU.arctosandU.spelaeuswas 1.2 Ma based on the estimate in a previous study [11] using D-loop sequences, while Ohnishi et al. [8] assumed that the split betweenU.thibetanusandU.americanusoccurred at 2.0 to 3.5 Ma, based on fossil records [12]. However, as will be discussed later, the suitability of these calibra-tions needs to be carefully examined.
caused by multiple substitutions at the same sites, especially in hyper-variable regions [13]. In addition, longer sequences provide a smaller standard error [14] and a more robust estimate [15].
It is important to note that divergence times within the family Ursidae are still controversial. For example, two studies [16,17] estimated divergence times on the assumption that the giant panda (Ailuropoda melanoreuca) separated from the other bears around 12 Ma, based on fossil evidence [18,19]. The estimates of divergence times among the genusUrsuswere from the Late Pliocene to the Pleistocene (2~3 Ma) [16,17]. On the other hand, Arnason et al. [20] estimated the divergence time betweenA.melanoreucaand the other ursids to be 30 Ma, and the diver-gence times of the genusUrsusto be in the Late Miocene (6~8 Ma). These discrepancies must come from a different choice of fossil records for the divergence time estimates, and depend on the accuracy of the geological ages of such fossil records. Thus, a more reliable estimation of divergence times among the Ursidae is needed. In this study, we first estimate the divergence times of all Ursidae species, in the framework of the whole Carnivoran evolution, with reliable fossil calibrations and superior molecular evolutionary models. We then estimate the coales-cent times amongU.thibetanusas well as the behavior of the population size over time, through its history on a geological timescale.
Materials and Methods
2.1 Ethics statement
All of the experimental work involving animals in this study followed the guidelines of the Ani-mal Experimental Ethics Committee of the School of Advanced Sciences, The Graduate Uni-versity for Advanced Studies, Japan, and was approved by the Committee.
2.2 Sample and sequencing
A blood sample of Japanese black bear was provided by Asa Zoological Park (Hiroshima, Japan). This individual was captured in Hiroshima Prefecture. The sample was stored at -20°C until used. Genomic DNA was extracted by standard phenol-chloroform extraction [21]. The complete mitochondrial genome sequence was determined using the procedures described by Nikaido et al. [22]. The nucleotide sequence of the mitochondrial genome of Japanese black bear determined in this study was deposited in the DDBJ (accession number: AB863014).
2.3 Phylogenetic analysis and divergence time estimation among
Carnivora
Complete mitochondrial genome (mt-genome) sequences of 71 species of Carnivora and one species of Pholidota were downloaded from GenBank; accession numbers are listed inS1A Table. All 12 protein-coding genes in the heavy strand of mt-genomes were aligned separately by using MUSCLE program and then concatenated. Start codons, stop codons and overlapping regions (betweenATP6andATP8,ND4andND4L, andND5andND6) were removed, and the resulting total sequence length was 10,704 bp. A phylogenetic tree was inferred by RAxML 7.2.8 [23,24] using the GTR+Γ+I model [25–27]. The difference among the three codon
posi-tions was taken into account by a partition model.
of this model compared with standard nucleotide substitution models (e.g., GTR model) and amino acid substitution models were demonstrated by our previous studies [30,31]. The selec-tion of the fossil calibraselec-tion method is also an important factor in divergence time estimaselec-tion. Although several studies simply apply the oldest fossil record of the Ursidae as a calibration point, fossil records in general do not point to the true time of divergence because the first stratigraphic appearances of taxa in the fossil records are subject to sporadic sedimentary hia-tuses due to erosion or to a lack of sedimentation during regression and/or irregular sedimen-tary processes. Because of these uncertainties, an assumed phylogeny implies such gaps if two sister taxa have different times of first appearance or if a gap exists between the last appearance of an inferred ancestor and the first appearance of its inferred descendant [30]. For this reason, the use of multiple reliable fossil records is preferred for time estimation. The calibration points derived from fossil records were the same as in our previous studies [30,31].
2.4 Phylogenetic analysis and coalescent time estimation within
U
.
thibetanus
based on the mitochondrial genome
A new dataset, including eight complete mitochondrial genomes of Asian black bears, was used in this analysis. Accession numbers are listed inS1B Table. The American black bear, brown bear and sloth bear were used as out-groups. Methods for data preparation and phylogenetic inference are the same as in Subsection 2.2 except that 12S rRNA and 16S rRNA were also involved. The GENETREE program ver. 9.0 (http://www.stats.ox.ac.uk/~griff/software.html) [32] was also used for the inference of genealogy and coalescent times. Since this method assumes neutrality, only the 3rdcodon positions, which are generally regarded as neutrally (or nearly neutrally) evolving sites, were used. Among 3173 3rd-codon position sites, 469 were vari-able. To make this data set compatible with the infinite site model, sites with multiple substitu-tions were excluded, and finally 438 sites remained. However, since the GENETREE program did not work on this data set, probably due to an excessive number of sites, we separated the data into six fragments and analyzed them one by one.
Hasegawa et al. [33] indicated a higherωratio (non-synonymous substitution
rate/synony-mous substitution rate) in an intra-species comparison than in an inter-species comparison. Ho et al. [34] demonstrated the time dependence of the evolutionary rate, and found a higher evolutionary rate in the short term (<1~2 Myr) and a lower evolutionary rate in the long term
(>1~2 Myr). This is probably due to slightly deleterious mutations that were not completely
swept from the populations over a short evolutionary period. The coalescent times within Asian black bear were estimated, using synonymous substitution sites that were regarded as nearly neutral [35]. By applying the estimated divergence times among Carnivora as calibration points, the coalescent times within Asian black bear were estimated using the MCMCtree pro-gram with the GTR+Γmodel [25,26,28].
2.5 Demographic analysis of
U
.
thibetanus
based on D-loop data
We downloaded D-loop sequence data that had been determined in previous studies [8,10], and aligned them together with the D-loop sequences of the mitochondrial genome data listed in theS1B Table. It should be noted that since the D-loop sequence region of theU.thibetanus mupinensis(DQ402478) is identified as that of American black bear (data not shown), we did not use the D-loop sequence of this individual in the following analyses.
and the north Asian continental population (Russian and North Korean population) due to their geographical distribution pattern [36].
The samples from the continental population comprise 44 individuals: the south continental population (17 individuals) and the north continental population (26 individuals), and one individual of unknown locality. The‘all Asian black bear data set’(64 individuals) consists of 44 individuals from continental populations and 20 individuals from the Japanese population.
Furthermore, we divided the Japanese population into three sub-populations: the western sub-population, the eastern sub-population and the southern sub-population [8,9]. The Japa-nese population data set consisted of 133 individuals from a western sub-population (60 indi-viduals), an eastern sub-population (60 indiindi-viduals), and a southern sub-population (13 individuals).
Phylogenetic relationships were inferred using the ML (maximum likelihood) method and the median joining (MJ) network method [37]. The ML tree was inferred using the RAxML program with the GTR+I+Гmodel. Since the D-loop sequences are short and possess homo-plasy caused by their high substitution rate at limited hypervariable sites, tree inference based on D-loop data only is not as reliable as inference based on the mt-genome. Therefore, the binary-backbone was given a priori, as a constraint of the phylogenetic relationships, on the basis of the result of the mt-genome analysis. The MJ network was inferred using the NET-WORK program ver. 4.6.11 (http://www.fluxus-engineering.com/sharenet.htm).
Since the strict molecular clock model could not be rejected by a likelihood ratio test, we car-ried out a new calculation of the evolutionary rate of the D-loop based on 61 Asian black bears including individuals from the continental population and Japanese population, assuming the split ofU.t.formosanusand others (e.g.,U.t.thibetanus,U.t.ussuricus) as 0.51 Ma (the esti-mated coalescent time in this study, based on the mt-genome data). The evolutionary rate of the D-loop was found to be 2.69×10⁻⁸per site per year. Using this evolutionary rate, the
ances-tral population sizes of Japanese and continental populations were estimated using the BEAST program ver. 1.7.4 [38] with a Bayesian Skyline Plot method [39]. Watterson’sΘ[40], theΘon
the basis of nucleotide diversity [41], and Tajima’s D [41] were estimated by the DNASP pro-gram ver. 5.10.01 [42]. In this analysis, all sequence data used by Ohnishi et al. [8] were applied for the Japanese population.
The reliability of the demographic analysis on the basis of D-loop data seemed to be ques-tionable because of the short sequence length and homoplasy of the D-loop. With the aim of addressing this issue, we examined the reliability of the D-loop data for the demographic analy-sis on the baanaly-sis of the real and simulated data, and confirmed that the results from the D-loops and the complete mitochondrial protein coding genes showed essentially the same tendency (seeS1 Text and S1 Fig).
3. Results and Discussion
3.1 Divergence time within the family Ursidae
A ML tree inferred from the complete mitochondrial protein genes is shown inS2 Fig. This tree topology is in general agreement with previous studies based on mitochondrial genomes (for Musteloidea [30,43], Otarioidea [31], Phocidae [20,44,45] and Ursidae [42,46]). Diver-gence times were estimated based on this tree topology except for the assumption of mono-phyly of the Musteloidea-Pinnipedia [20], and the result is shown inFig 1(a magnified view of the Ursidae is displayed).
Ma, and the basal split of the crown Ursinae (genusUrsus) was estimated to be 6.3±0.8 Ma. These estimates are much younger than those of Arnason et al. [20] and much older than those of Zhang and Ryder [16], but similar to those of Krause et al. [46].
Interestingly, although no fossil record within the Ursidae was used in the calibration of our analyses, our estimates are compatible with the known fossil records of Ursidae (Fig 1). The age of the basal split of the crown taxa should be older than the oldest known record (OKR) of the crown taxa, and younger than the OKR of the stem taxa [30,47]. The OKR of the crown Ursidae isKretzoiarctos beatrixfrom the Middle Miocene [18] and the OKR of the stem Ursi-dae isBallusia elmensisfrom the Early Miocene (MN 3, 20.5–18.0 Ma [48]). Therefore, the age of the basal split of the crown Ursidae (divergence time between Ursinae+Tremarctinae and Ailuropodinae) should be between 12.9 Ma and 20.5 Ma. Our estimate is very close to the older limit. The timing of the divergence of the generaTremarctosandArctodus(7.05 Ma) slightly predates the first appearance of the OKR of these genera. Our time estimates as well as the inconsistent pattern of gene tree topologies of the Ursidae [49] suggest that there were rapid speciation events within the genusUrsusfrom the Late Miocene to the Pliocene (6.3~2.6 Ma, this study). The OKR of this genus is also consistent with these timings (MN 14, 5.3–4.2 Ma, Early Pliocene, [50]). These fossil records suggest that our estimates are reliable.
Krause et al. [46] used the youngest fossil record of the genusUrsavus, which was assumed to be a direct ancestor of the genusUrsus, as the maximum age of the genusUrsus. However, there is still room to reconsider this calibration because the phylogenetic position of the genus
Ursavusremains controversial.Ursavusis recognized as a stem taxon for the crown Ursidae, and not a direct ancestor of the genusUrsus[18,51]. Also,Ursavusis somewhat heterogeneous, and recent studies suggest that several species withinUrsavusshould be transferred to other
Fig 1. Divergence times of the family Ursidae.Nodal numbers indicate the estimated divergence time (Ma). Horizontal gray bars spanning the nodes mark the 95% confidence interval for the divergence time. The phylogenetic positions of extinct lineages, which are indicated by the dashed lines, follow [18]. Horizontal black bars indicate temporal range based on fossil evidence. The temporal range of the common ancestor of Ursidae based on fossil evidence is indicated by the shading. Extinct species are marked by a dagger (†).
genera [48,50,52]. However, at least sevenUrsavusspecies are recognized from Eurasia during the Middle to Late Miocene [52], and the age of the youngest fossil record ofUrsavus(MN 11, 8.7–8.0 Ma, Late Miocene [50]) and time of the basal node ofUrsus(6.3±0.8 Ma, this study) are seemingly concordant. This suggests that the extinction ofUrsavustriggered successive spe-ciations within the genusUrsus.
In addition, the timing of the successive speciations ofUrsus(Late Miocene to Pliocene) is in agreement with the global cooling event starting from the Late Miocene [53]. This suggests that the spread of savanna and open scrubland [54], and fragmentation of the forests, resulted in reductions of gene flow among the subpopulations of the common ancestral species ofUrsus
and enhanced the rapid speciation ofUrsus. As a result,Ursusspecies received a fundamental shift of their ecological niches.
Indeed, other Carnivoran families such as Felidae, Mustelidae and Otariidae also show suc-cessive speciation events during this period [30,31]. However, it is possible that the mecha-nisms that enhanced the rapid speciation are different for each taxon. In the case of Felidae and Mustelidae, environmental change may have enhanced their adaptive radiation to grassland (coevolution with rodents) and acted as a driving force of the speciation as in response to suc-cessive changes in the food web, which is relevant to the evolution of these families [30]. In the case of Otariidae, changes in their distribution areas triggered the accidental transit of the bio-logical barrier, and resulted in the reclamation of distribution areas [31]. In the case of the Ursi-dae, fragmentation of forests seems to have played a role in vicariance, with the isolation of each subpopulation resulting in rapid speciation. Inconsistency of the tree topologies among individual gene loci [49] implies a large ancestral population and successive speciations.
3.2 Genealogy and coalescent times of Asian black bear based on the
mt-genome
The ML tree of eight Asian black bears, as inferred from the complete mitochondrial protein genes and rRNAs, is shown inS3 FigThe time-calibrated tree is shown inFig 2. American black bear (U.americanus), brown bear (U.arctos) and sloth bear (U.ursinus) were used as out-groups.
The Japanese sub-species (U.thibetanus japonicus) was recognized as the basal split among the speciesU.thibetanusin this tree, indicating that the Japanese population is not a direct descendant of the (extant) continental populations. The fossil record (e.g., the Early Pliocene fossil from Moldova [3]) suggests that the initial population of Asian black bear dispersed throughout the Eurasian continent, and it is possible that the Japanese population is a relic of such an ancient population.
Subsequently, a population represented by the individual FM177759 [46] branched off. The geographical origin of this individual is unknown. Black bears in the East Asian continent (China, Korea, Russia) then diversified (the“East Asian continental clade,”which is constituted from part of the“South continental population”and the entire“North continental population”; Figs2,3and4). This species is also distributed in Taiwan (U.thibetanus formosanus). The black bear from Taiwan is highly nested within the South continental population, but because only one individual was involved in our analysis, our inclusion of the Taiwanese local popula-tion as part of the south continental populapopula-tion is tentative. The Korean sub-species (U. thibe-tanus ussuricus) is also highly nested in this East Asian continental clade, and can be
at the basal position of the East Asian continental clade; the Chinese continental sub-species (U.t.thibetanus,U.t.mupiensis) successively diverged, and finally the Korean subspecies (U.t.
ussuricus) was separated from the former subspecies. In Choi et al.’s tree [55], in contrast, the subspeciesU.t.mupiensisdiverged first and then the Korean subspecies (U.t.ussuricus) evolved; the other Chinese continental subspecies then diversified. The Taiwanese subspecies (U.t.formosanus) was recognized as the final split. These inconsistencies are probably due to a rooting problem of the East Asian continental clade. Indeed, except for the position of the root, our two tree toplogies are identical (if limited to the East Asian continental clade). In contrast to Choi et al. [55], who used other species (e.g., the American black bear and the brown bear) as out-groups of the East Asian continental clade, the Japanese subspecies and FM177759 (locality unknown) acted as an out-group in this study. Since an out-group that is closer to the in-group is preferable, the position of the root in this study seems to be more appropriate.
The genealogy inferred by the coalescent method also shows an identical branching pattern (Fig 3). Every fragment shows an identical genealogy. Although several nodes were recognized as multifurcation, due to the lack of mutation sites in some fragments, every node seen inFig 2
andS3 Figwas supported by at least four fragments out of the six. Since different methods for the reconstruction of the geneaology (the phylogenetic method and the population genetic method) support the identical topology, we conclude that the genealogy presented in this study is robust and reliable.
Fig 2. Coalescent times of the Asian black bear.Nodal numbers indicate the estimated coalescent time (Ma). Horizontal gray bars show the 95% confidence interval for the coalescent times. (a-c) Geographical distribution of fossils of Asian black bear in (a) the Calabrian (Early Pleistocene) [58], (b) the lonian (Middle Pleistocene) [58, Kohno, unpublished] and (c) the Tarantian (Late Pleistocene) [58,60]. The illustration is of a Japanese black bear (Ursus thibetanus japonicus), kindly provided by Utako Kikutani. Circles on maps indicate the fossil record of Asian black bears (Blue circles indicate the fossil records reported by previous studies and red circle indicates the fossil records newly reported by this study.).
Subsequently, a ML tree and a MJ network were also inferred based on the D-loop sequence data, and are shown inFig 4A and 4B, respectively. This analysis includes the individuals from Southeast Asia. In contrast to Kim et al. [10], the basal position of the Japanese population among Asian black bears was still supported (85%). Since the binary backbone was applied for the tree inference, we were able to take advantage of the mitochondrial genome in our analysis. Therefore, the tree with the Japanese population at its base seems to be more plausible. Individ-uals from East Asia such as mainland China, Taiwan and Korea were highly nested and inter-mingled with individuals from Southeast Asia within the East Asian continental clade. From the criterion of parsimony, the ancestral distribution area of the continental population was probably Southeast Asia, and groups of individuals from that population migrated into China multiple times.
The coalescent times of the Asian black bear were estimated based on this tree topology using synonymous substitution sites of protein-coding genes, and the results are shown inFig 2(a magnified view ofU.thibetanusis displayed). Since the effect of multiple substitutions at the synonymous sites was minor at the genus level (S4 Fig), the estimated divergence times within the genusUrsuswere applied as calibration points for coalescent time estimations. The coalescent time between the Japanese population and the continental population was estimated to be 1.48±0.67 Ma. GENETREE analysis also yielded a similar result (1.20–1.52 Ma; average, 1.34 Ma). Previous studies addressing coalescent times within the speciesU.thibetanusyielded
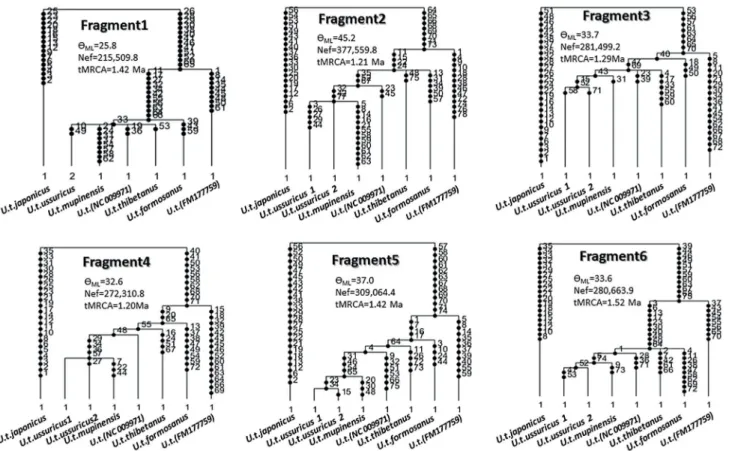
Fig 3. Genealogy of eight Asian black bears as inferred from the 3rd codon positions of the complete mitochondrial protein genes using the GENETREE program.Since the program did not work on the whole data set, probably due to excessive numbers of mutation sites, the whole data set was separated into six fragments. The dots on the branches indicate the number of mutation sites. The values ofρML(= 2×Nef×μ;μis the mutation rate per
sequence per generation) and tMRCAs were also estimated by GENETREE. The substitution rate of the 3rd codon positions of mitochondrial protein genes of Asian black bear was estimated to be 3.03×10⁻⁸/site/year (data not shown), and the average mutation rate of each of the six fragments is 5.99×10⁻⁵/ sequence/generation.
contradictory results [8,9]. Our estimate was slightly younger than Ohnishi et al.’s estimates (2.57–1.42 Ma) [8], and substantially older than Yasukochi et al.'s estimates (0.48–0.67 Ma) [9]. Ohnishi et al. [8] analyzed D-loop sequences to calculate the coalescent time between the
Fig 4. Phylogenetic relationships among Asian black bears.(a) The ML tree as inferred from the D-loop sequence. Nodal numbers indicate bootstrap probabilities (rapid bootstrap method with 1000 replications). The binary backbone structure was given a priori on the basis of the mitochondrial genome data (the phylogenetic relationships on the basis of the mitochondrial genome data are shown inFig 2). Branch lengths are proportional to the number of
nucleotide substitutions. (b) The median joining network. The circles indicate individual haplotypes, and their sizes are proportional to the frequency of the haplotypes. The short thick bars on the branches indicate unobserved ancestral haplotypes. In both (a) and (b), individuals from the Japanese population, the southern continental population (including Taiwan) and the northern continental population are colored yellow, red and light blue, respectively (branches are colored in (a), and haplotypes in (b)). Since the geographical information of FM177759 is unknown, it is colored black.
Japanese and continental subspecies, using theU.arctos/U.thibetanusspeciation as a calibra-tion point. They assumed rapid speciacalibra-tion events within the genusUrsusat 3.5–2.0 Ma (Late Pliocene to Early Pleistocene) based on the fossil record [12]. However, Kurtén and Anderson [56] suggested that the species of this genus arose in the Early Pliocene (5.3–3.5 Ma) in the Old World. Therefore, calibrations that [8] used were too young; nevertheless, our time estimation is assuming the speciation within the genusUrsusat 6.3–3.9 Ma, but our estimate was younger than [8]’s estimates. Since the substitution rate in the D-loop sequence is very high, the effect of multiple substitutions becomes a serious problem in time estimation at the level of different species (S4 Fig). Accordingly, given that theU.arctos/U.thibetanusseparation was used as a calibration point, coalescent times among the subspecies ofU.thibetanusbased on D-loop sequences should have resulted in a gross overestimation (i.e., older estimates) as was the case in Ohnishi et al.'s analysis [8]. This is why our estimate is younger than [8]’s estimates even though we used a much older time as a calibration point.
Yasukochi et al. [9] estimated coalescent times amongU.thibetanussubspecies assuming a divergence time betweenU.spelaeus(cave bear) andU.arctosat 1.2 Ma. This date was esti-mated by Loreille et al. [11] based on D-loop sequences. However, they indirectly applied the evolutionary rate of homologous genes in human. The evolutionary rate among different orders of mammals is sometimes extremely different, and the substitution rate of drial genomes in Primates is high among mammals. Compared with Primates, the mitochon-drial genomes of Carnivora evolve more slowly [57]. If the evolutionary rate of human homologous genes is applied, divergence times within the genusUrsuswill be underestimated. In our analysis, the speciation ofU.spelaeusandU.arctoswas 2.6 Ma (95%CI: 3.39–1.96 Ma), which was directly estimated in the framework of whole carnivoran evolution using reliable fossil records. It is about 2.2 times older than [11]’s estimates. Since [9]’s estimation was based oncytochrome bsequences, in which substitutions are not saturated within the genusUrsus, if they had applied 2.6 Ma for theU.spelaeus/U.arctosspeciation, their estimates would have been very close to ours.
Moving to the paleontological evidence, the fossil record of the Asian black bear in the Early Pleistocene is known only in Southeast Asia, but the geographical distribution ofU.thibetanus
became much wider in the Middle Pleistocene [58]. The tMRCA (time of the Most Recent Common Ancestor) of the continental population was estimated to be 0.98 Ma in this study. The most basal lineage in the continental population was the individual whose mitochondrial genome was sequenced by Krause et al. [46] (FM177759). Although geographical information about the individual is unknown, the split of this individual from other subspecies was consid-erably earlier. The coalescent times among continental subspecies in East Asian regions such as China, Korea, and Russia (East Asian continental clade) were estimated to be mainly between 0.21–0.52 Ma (Middle Pleistocene), which indicates that within this time period rapid sub-spe-ciation occurred (the mitochondrial genome of the Asiatic black bear sequenced by Yu et al. [43] (NC009971) was from China; Dr. Li Yu, personal communication). This is consistent with the paleogeographical distribution of this species as shown by [58]. In the Middle Pleistocene, the distribution area ofU.thibetanusbecame considerably more extensive than it is today, and fossil records have been reported from Southern Siberia, South and North Europe, and the middle Urals [2]. Successive splits of multiple mitochondrial lineages in this age seem to be cor-related with the geographical expansion of this species.
3.3 tMRCA and population size of the Asian black bear
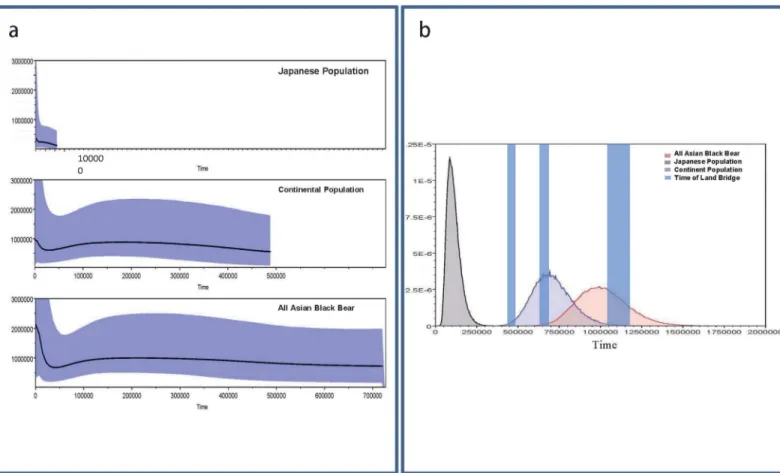
D-loop data using the BEAST program, and the results are shown inFig 5. As mentioned above, the Japanese population was divided into three sub-populations following [8]: Western sub-population, Eastern sub-population and Southern sub-population. The tMRCAs and the dynamics of population sizes of the three Japanese sub-populations were also estimated (S5 Fig). The y-axes ofFig 5andS5 Figare equal to Nef × t (the effective female population size times the generation length in years). Female Japanese black bears attain physiological puberty at 4 years [1]. Since the Nef × t of Japanese black bears was estimated to be about 370,000, the effective population size of the current Japanese black bear population is 185,000, assuming equal numbers of females and males. Although the actual size of the current Japanese black bear population is unknown, it is roughly estimated to be 13,000~21,000 [59]. However, con-sidering 1,500 to 2,500 Japanese black bears are killed every year [1], the estimate of
13,000~21,000 individuals should be considered as a minimal estimation.
The tMRCA of all Asian black bears was estimated to be 1.00 Ma (95% CI: 1.32–0.73Ma). This is younger than the coalescent time of Asian black bears inferred from mitochondrial genome data (1.48±0.67 Ma), probably due to an underestimation of the numbers of multiple substitutions (especially transitions) of D-loop sequences in deep branches (data not shown). The tMRCAs of continental populations were estimated to be 0.70 Ma (95%CI: 0.94–0.49Ma) and that of the Japanese population was estimated to be 0.10 Ma (95%CI: 0.19–0.04 Ma).
Fig 5. Dynamics of the population sizes and tMRCAs of all Asian black bears, the Japanese population and the continental population.(a) Dynamics of the population sizes estimated by Bayesian Skyline Plot analysis. The y-axes indicates the effective population size × generation intervals, and the x-axes indicate the time in years before present. (b) Posterior distributions of the tMRCAs. The times of formation of land bridges before the oldest record of the Japanese black bear (337–330 Kilo annum) are indicated by shaded bars, following Dobson and Kawamura [60] and Rohling et al. [63] with
recalibrations by Lisiecki and Raymo [67]. The shading around the lines indicates 95% confidence interval of effective population size for each time point.
Notably, the tMRCA of the Japanese population is only 1/10 of the tMRCAs of all Asian black bears. In addition, no fossil evidence of the Japanese population is known prior to the Late Pleistocene [1,58,60] (although unpublished fossil data from N. Kohno are discussed below). It is thus likely that although the Japanese population is placed as the basal lineage among all other populations ofU.thibetanus(Figs2–4), the following two hypotheses are possible. (1) The animals dispersed into the Japanese Archipelago relatively recently (i.e., during the Late Pleistocene), or (2) they migrated earlier (the Early to Middle Pleistocene) and experienced recent population growth.
Although we cannot exclude the possibility of a recent migration event (Late Pleistocene) for the Japanese black bear, an old migration and recent population expansion may be a more plausible hypothesis. A possible explanation of the discrepancy between their distinctive old split from the continental population in the Early Pleistocene and their potential recent tMRCA of the population in the Japanese main islands (i.e., Honshu, Shikoku and Kyushu) after the late Middle Pleistocene may be the re-dispersal of a partially restricted population of Japanese black bears into the newly emerged ecological empty space caused by the reduction and extinction of the brown bear (U.arctos) population; an exotic larger species in the Pleisto-cene of Honshu exploited the same resources in a similar manner. According to [61,62], the Pleistocene mammalian fauna of the Japanese main islands included the brown bear until the Late Pleistocene. Their possible reduction in the late Middle Pleistocene and extinction in the Late Pleistocene might have been the result of fragmentation of forests in Honshu, and might have resulted in an abrupt emergence of an empty niche for the Japanese black bear after the late Middle Pleistocene in the Japanese main islands. The population sizes of all Asian black bears (comprising continental and Japanese populations) increased slightly after the last glacial period. The Japanese population expanded considerably throughout the late Middle to the Late Pleistocene (Fig 5,Table 1). This scenario also supports“the old migration and recent popula-tion growth" hypothesis.
Although paleontological evidence does not show the bears' precise migratory history [1,58,60], phylogeographically there are at least three possible migration routes from the Asian continent to the Japanese archipelago, and particularly Honshu. The first is the Sibe-ria-Sakhalin-Hokkaido route via the Mamiya Strait (between Siberia and Sakhalin), the Soya Strait (between Sakhalin and Hokkaido), and the Tsugaru Strait (between Hokkaido and Honshu). The second possibility is the Ryukyu archipelago route, and the third is the Korean
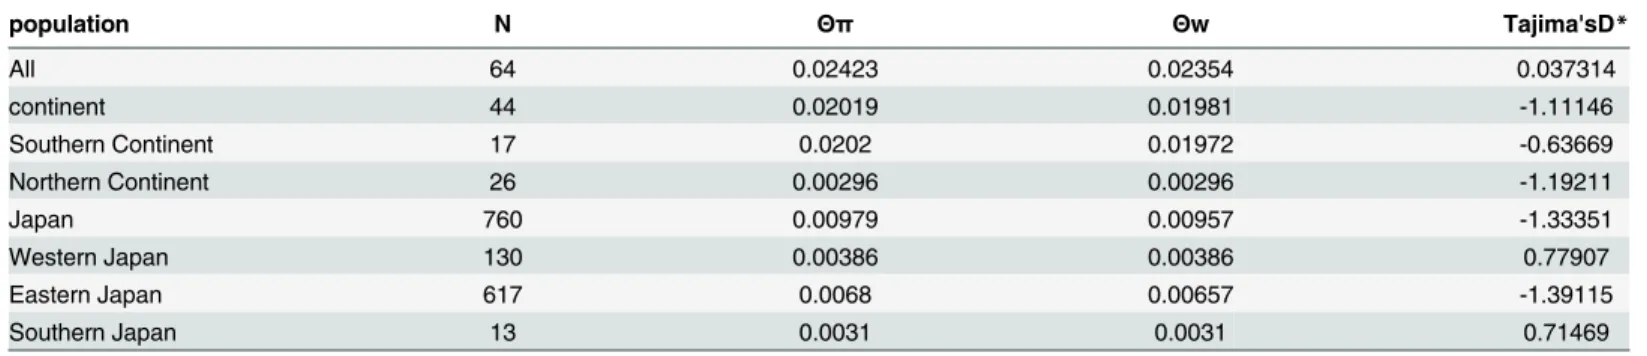
Table 1. Summary Statistics for the demography.
population N Θπ Θw Tajima'sD*
All 64 0.02423 0.02354 0.037314
continent 44 0.02019 0.01981 -1.11146
Southern Continent 17 0.0202 0.01972 -0.63669
Northern Continent 26 0.00296 0.00296 -1.19211
Japan 760 0.00979 0.00957 -1.33351
Western Japan 130 0.00386 0.00386 0.77907
Eastern Japan 617 0.0068 0.00657 -1.39115
Southern Japan 13 0.0031 0.0031 0.71469
N: numbers of the samples
Θπ: Theta based on the nucleotide diversity
Θw: Waterson's theta
*All of them were not significant in this study (p-values>0.1)
Peninsula to Honshu+Kyushu route via the Korean and Tsushima Straits. Since the Japanese population of Asian black bears is distributed only in the Japanese main islands, and no extant population or fossils have ever been found in Hokkaido or Ryukyu, the first and sec-ond possible routes are unlikely. It is also known that the Tsugaru and Tsushima Straits did not form land bridges during the Last Glacial Maximum (LGM) period in the Late Pleisto-cene [63]. Therefore, the Korean Peninsula–Japanese main islands route also seems unlikely for the migration of Japanese black bears during the LGM. This means that the Japanese black bear appeared in the Japanese Islands before their population expansion during the late Middle and Late Pleistocene. Taruno [64] and Takahashi [65] suggested the possibility that a transient land bridge formed between the Asian continent and Japanese Archipelago during the Early Pleistocene (1.2–1.0 Ma [66,67]) and the Middle Pleistocene (0.678–0.621 Ma and 0.478–0.424 Ma [66,67]). The timing of the occurrence of this land bridge in the Early Pleis-tocene is consistent with the divergence time between the Japanese and continental subspe-cies (the tMRCA of all Asian black bears).
Without fossil evidence of the existence of the Japanese black bear in the Japanese Archipel-ago in the Early and Middle Pleistocene, it was difficult to claim that the ancient population of the Japanese subspecies had lived there before the Late Pleistocene and that they migrated from the continent during the late Early to the Middle Pleistocene, by passing such a land bridge. However, the recent discovery of a Japanese black bear fossil from the late Middle Pleistocene (MIS 9 or about 337 Kilo annum [68]) in Aomori Prefecture (Fig 6) demonstrated that the Asian black bear lived at least in Honshu by the late Middle Pleistocene before the population expansion of the Japanese black bear in the Late Pleistocene in the Japanese Islands. In this regard, the existence of the brown bear [1,58,60] in Honshu might have confined the Japanese black bear to restricted areas (e.g., mountains) in Honshu during the Middle Pleistocene. As
Fig 6. Middle Pleistocene black bear from Japan with a comparison of the left upper second molars (M2) among bears.1, Middle Pleistocene (ca. 337–330 Kilo annum, MIS 9 [68]) black bear,Ursus thibetanussubsp. indet., from Aomori Prefecture, northern Japan (NMNS-PV 22666). 2, Extant Japanese black bear,Ursus thibetanus japonicus, from Nagano Prefecture, central Japan (NMNS-PO 52). 3, Extant Tibetan black bear,Ursus thibetanus thibetanus, from Thailand (NMNS-PO 207). 4, Extant Hokkaido brown bear,Ursus arctos yesoensis, from Hokkaido, northern Japan (NMNS-PO 208). The black bears share a combination of M2 characters such as a relatively large metacone (as large as the paracone), a distinct constriction between the paracone and the metacone, and a less developed posterior talon. In contrast, the brown bear has a smaller metacone relative to the paracone, a less distinct constriction between the two cusps, and a well developed posterior talon in M2. These comparisons suggest that the tooth of Middle Pleistocene Japanese black bear is closer in size and shape to the teeth of continental black bears than it is to extant Japanese black bears, but it is far from the brown bears.
mentioned above, the Japanese population depends more on vegetation than meat compared with the continental population [1]. It is possible that the high dietary dependence on vegeta-tion in the Japanese populavegeta-tion was an adaptavegeta-tion to avoid competivegeta-tion with the brown bear. After the reduction and extinction of the brown bear, which accords with the reduction and/or fragmentation of forests and resultant extinction of large herbivores, the ecological niche of brown bear in Honshu was evidently replaced by the Japanese black bear, whose population subsequently expanded to the east and south in the Japanese main islands.
To date, Japanese-type mitochondrial haplotypes have not been reported from the continent (e.g., [10]). After the ancestral population of the Japanese black bear migrated from the conti-nent to the Japanese Archipelago, probably via the Korean Peninsula in the Early to the Middle Pleistocene glacial period, they became extinct or were drastically reduced on the continent, especially in Northern Asia. The Japanese Islands may therefore have been a refugium for the ancestral Asian black bear. Any of the ancestral population remaining in North Asia may have been replaced by the newly evolved subspeciesussuricusin the Middle Pleistocene. However, since genetic data from the continental population are very limited (only 44 individuals from four countries), more extensive analysis of the continental population, focusing both on geo-graphical variation and on numbers of individuals, will shed further light on the enigmatic his-tory of the Asian black bear.
Supporting Information
S1 Fig. Dynamics of the population of the protein coding genes (about 10 kbp) and D-loop (about 500 bp) on the basis of real and simulated nucleotide sequence data.The dynamics of the population sizes estimated by Bayesian Skyline Plot analysis are shown. Vertical axes indicate the effective population size × generation intervals; horizontal axes indicate time in years before present. The shading around the lines indicates 95% confidence interval of effec-tive population size of each time point.
(PDF)
S2 Fig. The ML tree of 71 Carnivora and 1 Pholidota as inferred from the complete mito-chondrial protein genes.Numbers at nodes indicate bootstrap probability (BP) in % (1000 replications). Branch lengths are proportional to the number of nucleotide substitutions. (PDF)
S3 Fig. The ML tree of eight Asian black bears as inferred from the complete mitochondrial protein genes and rRNAs.Numbers at nodes indicate BP in % (1000 replications). Branch lengths are proportional to the number of nucleotide substitutions.
(PDF)
S4 Fig. Saturation plot analysis of the synonymous and non-synonymous sites of mitochon-drial protein coding genes and D-loop sequence within Ursus thibetanus and among spe-cies of the genus Ursus.
(PDF)
S5 Fig. Dynamics of the population sizes and tMRCAs of the Japanese population, and its three constituent subpopulations (a) Dynamics of the population sizes estimated by Bayes-ian Skyline Plot analysis.Vertical axis indicates the effective population size × generation intervals. Horizontal axis indicates the time in years before present. (b) Posterior distributions of the tMRCAs.
S1 Table. Species names and GenBank accession numbers of the complete mitochondrial genome data used in this study.
(XLSX)
S1 Text. Reliability of the Demographic Analysis Based on the D-loop Sequences.
(DOCX)
Acknowledgments
We wish to express our special thanks to Prof. David Waxman for improving our manuscript as well as for making many valuable comments, and to the staff of Hiroshima City Asa Zoologi-cal Park for providing us with the precious sample of the Japanese black bear. Dr. Li Yu (Yun-nan University) kindly provided us with the geographical information about her sample. We also thank Ms. Utako Kikutani for her illustration of the Japanese black bear inFig 2. Our thanks also go to Dr. Shin-ichiro Kawada and Dr. Sayaka Shimoinaba (NNMS) for their per-mission to examine specimens under their care.
Author Contributions
Conceived and designed the experiments: JW NK MH TY. Performed the experiments: HT TY. Analyzed the data: JW SM MH TY. Wrote the paper: JW NK SM MH TY. Prepared the blood sample of Japanese black bear: YF.
References
1. Ohdachi SD, Ishibashi Y, Iwasa MA, Saitoh T (2009) The Wild Mammals of Japan: SHOUKADOH Book Sellers. 544 p.
2. Baryshnikov G (2010) Middle PleistoceneUrsus thibetanus(Mammalia, Carnivora) from Kudaro caves in the Caucasus. Proceeding of the Zoological Institute RAS 314: 67–79.
3. Baryshnikov GF, Zakharov DS (2013) Early Pliocene BearUrsus thibetanus(Mammalia, Carnivora) from Priozernoe Locality in the Dniester Basin (Moldova Republic). Proceeding of the Zoological Insti-tute RAS 317: 3–10.
4. Walker EP (1975) Mammals of the world: Johns Hopkins University Press.
5. Hou WR, Chen Y, Wu X, Hu JC, Peng ZS, Yang J, et al. (2007) A complete mitochondrial genome sequence of Asian black bear Sichuan subspecies (Ursus thibetanus mupinensis). Int J Biol Sci 3: 85– 90.
6. Hwang DS, Ki JS, Jeong DH, Kim BH, Lee BK, Han SH, et al. (2008) A comprehensive analysis of three Asiatic black bear mitochondrial genomes (subspeciesussuricus,formosanusandmupinensis), with emphasis on the complete mtDNA sequence ofUrsus thibetanus ussuricus(Ursidae). Mitochon-drial DNA 19: 418–429. PMID:19462516
7. Steinmetz R, Garshelis D. L. (2008) Distinguishing Asiatic black bears and sun bears by their claw marks on climbed trees. Journal of Wildlife Management 72: 814–821.
8. Ohnishi N, Uno R, Ishibashi Y, Tamate HB, Oi T (2009) The influence of climatic oscillations during the Quaternary Era on the genetic structure of Asian black bears in Japan. Heredity (Edinb) 102: 579–589.
9. Yasukochi Y, Nishida S, Han SH, Kurosaki T, Yoneda M, Koike H (2009) Genetic structure of the asiatic black bear in Japan using mitochondrial DNA analysis. J Hered 100: 297–308. doi:10.1093/jhered/ esn097PMID:18984857
10. Kim YK, Hong YJ, Min MS, Kim KS, Kim YJ, Voloshina I, et al. (2011) Genetic status of Asiatic black bear (Ursus thibetanus) reintroduced into South Korea based on mitochondrial DNA and microsatellite loci analysis. J Hered 102: 165–174. doi:10.1093/jhered/esq121PMID:21325020
11. Loreille O, Orlando L, Patou-Mathis M, Philippe M, Taberlet P, Hänni C. (2001) Ancient DNA analysis reveals divergence of the cave bear, Ursus spelaeus, and brown bear,Ursus arctos, lineages. Curr Biol 11: 200–203. PMID:11231157
13. Hasegawa M, Di Rienzo A, Kocher TD, Wilson AC (1993) Toward a more accurate time scale for the human mitochondrial DNA tree, J. Mol. Evol. 37: 347–354.14. PMID:8308904
14. Horai S, Hayasaka K, Kondo R, Tsugane K, Takahata N (1995) Recent African origin of modern humans revealed by complete sequences of hominoid mitochondrial DNAs. Proc Natl Acad Sci U S A 92: 532–536. PMID:7530363
15. Rannala B, Yang Z (2007) Inferring speciation times under an episodic molecular clock. Syst Biol 56: 453–466. PMID:17558967
16. Zhang YP, Ryder OA (1993) Mitochondrial DNA sequence evolution in the Arctoidea. Proc Natl Acad Sci U S A 90: 9557–9561. PMID:8415740
17. Nakagome S, Mano S., Hasegawa M. (2013) Comment on "Nuclear Genomic Sequences Reveal that Polar Bears Are an Old and Distinct Bear Lineage". Science 339: 1522. doi:10.1126/science.1228066 PMID:23539581
18. Abella J, Alba DM, Robles JM, Valenciano A, Rotgers C, Carmona R, et al. (2012)Kretzoiarctosgen. nov., the oldest member of the giant panda clade. PLoS One 7: e48985. doi:10.1371/journal.pone. 0048985PMID:23155439
19. Qiu Z, Qi G., (1989) Ailuropod found from the Late Miocene deposits in Lufeng, Yunnan. Wetebrata PalAsiatica 27: 153–169.
20. Arnason U, Gullberg A, Janke A, Kullberg M. (2007) Mitogenomic analyses of caniform relationships. Mol Phylogenet Evol. 45:863–874. PMID:17919938
21. Sambrook J, Fritsch EF, Maniatis T (1989) Molecular Cloning: a laboratory manual. Cold Spring Harbor Laboratory: Cold Spring Harbor Laboratory Press.
22. Nikaido M, Kawai K, Cao Y, Harada M, Tomita S, Okada N, et al. (2001) Maximum likelihood analysis of the complete mitochondrial genomes of eutherians and a reevaluation of the phylogeny of bats and insectivores. J Mol Evol 53: 508–516. PMID:11675611
23. Stamatakis A (2006) RAxML-VI-HPC: maximum likelihood-based phylogenetic analyses with thou-sands of taxa and mixed models. Bioinformatics 22: 2688–2690. PMID:16928733
24. Stamatakis A, Hoover P, Rougemont J (2008) A rapid bootstrap algorithm for the RAxML Web servers. Syst Biol 57: 758–771. doi:10.1080/10635150802429642PMID:18853362
25. Hasegawa M, Kishino H, Yano T (1985) Dating of the human-ape splitting by a molecular clock of mito-chondrial DNA. J Mol Evol 22: 160–174. PMID:3934395
26. Rodriguez F, Oliver JL, Marin A, Medina JR (1990) The general stochastic model of nucleotide substitu-tion. J Theor Biol 142: 485–501. PMID:2338834
27. Yang Z (1996) Among-site rate variation and its impact on phylogenetic analyses. Trends Ecol Evol 11: 367–372. PMID:21237881
28. Yang Z (2007) PAML 4: phylogenetic analysis by maximum likelihood. Mol Biol Evol 24: 1586–1591. PMID:17483113
29. Yang Z, Nielsen R, Hasegawa M (1998) Models of amino acid substitution and applications to mito-chondrial protein evolution. Mol Biol Evol 15: 1600–1611. PMID:9866196
30. Yonezawa T, Nikaido M, Kohno N, Fukumoto Y, Okada N, Hasegawa M (2007) Molecular phylogenetic study on the origin and evolution of Mustelidae. Gene 396: 1–12. PMID:17449200
31. Yonezawa T, Kohno N, Hasegawa M (2009) The monophyletic origin of sea lions and fur seals (Carniv-ora; Otariidae) in the Southern Hemisphere. Gene 441: 89–99. doi:10.1016/j.gene.2009.01.022 PMID:19254754
32. Griffiths RC, Tavare S (1999) The ages of mutations in gene trees. The Annals of Applied Probability. 9: 567–590.
33. Hasegawa M, Cao Y, Yang Z (1998) Preponderance of slightly deleterious polymorphism in mitochon-drial DNA: nonsynonymous/synonymous rate ratio is much higher within species than between spe-cies. Mol Biol Evol 15: 1499–1505. PMID:12572613
34. Ho SY, Phillips MJ, Cooper A, Drummond AJ (2005) Time dependency of molecular rate estimates and systematic overestimation of recent divergence times. Mol Biol Evol 22: 1561–1568. PMID:15814826
35. Endicott P, Ho SY (2008) A Bayesian evaluation of human mitochondrial substitution rates. Am J Hum Genet 82: 895–902. doi:10.1016/j.ajhg.2008.01.019PMID:18371929
36. IUCN (2012) The IUCN Red List of Threatened Species, ''Ursus thibetanus'' Asiatic black bear, Vulnerable.
38. Drummond AJ, Rambaut A (2007) BEAST: Bayesian evolutionary analysis by sampling trees. BMC Evol Biol 7: 214. PMID:17996036
39. Drummond AJ, Rambaut A, Shapiro B, Pybus OG (2005) Bayesian coalescent inference of past popu-lation dynamics from molecular sequences. Mol Biol Evol 22: 1185–1192. PMID:15703244
40. Watterson GA (1975) On the number of segregating sites in genetical models without recombination. Theoretical Population Biology 7: 256–276. PMID:1145509
41. Tajima F (1989) Statistical method for testing the neutral mutation hypothesis by DNA polymorphism. Genetics 123: 585–595. PMID:2513255
42. Librado P, Rozas J (2009) DnaSP v5: a software for comprehensive analysis of DNA polymorphism data. Bioinformatics 25: 1451–1452. doi:10.1093/bioinformatics/btp187PMID:19346325
43. Yu L, Li YW, Ryder OA, Zhang YP (2007) Analysis of complete mitochondrial genome sequences increases phylogenetic resolution of bears (Ursidae), a mammalian family that experienced rapid speci-ation. BMC Evol Biol 7: 198. PMID:17956639
44. Davis CS, Delisle I, Stirling I, Siniff DB, Strobeck C (2004) A phylogeny of the extant Phocidae inferred from complete mitochondrial DNA coding regions. Mol Phylogenet Evol 33: 363–377. PMID:15336671
45. Arnason U, Gullberg A, Janke A, Kullberg M, Lehman N, Petrov EA, et al. (2006) Pinniped phylogeny and a new hypothesis for their origin and dispersal. Mol Phylogenet Evol 41: 345–354. PMID: 16815048
46. Krause J, Unger T, Nocon A, Malaspinas AS, Kolokotronis SO, Stiller M, et al. (2008) Mitochondrial genomes reveal an explosive radiation of extinct and extant bears near the Miocene-Pliocene bound-ary. BMC Evol Biol 8: 220. doi:10.1186/1471-2148-8-220PMID:18662376
47. Kohno N (2005) Climatic change and the phylogenetic diversification with feeding adaptation of the pin-nipeds. Fossils 77: 34–40.
48. Ginsburg L, Morales J (1998) Hemicyoninae (Ursidae, Carnivora, Mammalia) and the related taxa from Early and Middle Miocene of Western Europe. Annales de Paléontologie 84: 71–123.
49. Nakagome S, Pecon-Slattery J, Masuda R (2008) Unequal rates of Y chromosome gene divergence during speciation of the family Ursidae. Mol Biol Evol 25: 1344–1356. doi:10.1093/molbev/msn086 PMID:18400788
50. Qiu ZH (2003) Dispersals of Neogene Carnivorans between Asia and North America in Chapt 2. Bulle-tin of the American Museum of Natural History 279: 18–31.
51. McLellan BN, Reiner D (1994) A review of bear evolution. Int Conf Bear Res and Manage 9: 85–96.
52. Qiu ZX, Deng T, Wang BY (2014) A Late MioceneUrsavusskull from Guanghe, Gansu, China. Verteb-rata PalAsiatica 53: 265–302
53. Zachos J, Pagani M, Sloan L, Thomas E, Billups K (2001) Trends, Rhythms, and Aberrations in Global Climate 65 Ma to Present. Science 292: 686–693. PMID:11326091
54. Woodburne MO (2004) Global Events and the North American Mammalian Biochronology: Columbia University Press. 331–338 p.
55. Choi EH, Kim SK, Ryu SH, Jang KH, Hwang UW (2010) Mitochondrial genome phylogeny among Asi-atic black bear Ursus thibetanus subspecies and comprehensive analysis of their control regions. Mito-chondrial DNA 21: 105–114. doi:10.3109/19401736.2010.491864PMID:20795781
56. Kurtén B, Anderson E (1980) Pleistocene Mammals of North America.: Columbia Univ. Press. 182– 185 p.
57. Wu J, Hasegawa M, Zhong Y, Yonezawa T (2014) Importance of synonymous substitutions under dense taxon sampling and appropriate modeling in reconstructing the mitogenomic tree of Eutheria. Gene. Genet. Syst. 89: 237–251.
58. Kawamura Y (1982) Biogeographical aspects of the Quaternary mammals of Japan. Honyurui Kagaku (Mammalian Science) 43/44: 99–130.
59. Yoneda M, Mano T (2011) The present situation and issues for estimating population size and monitor-ing population trends of bears in Japan. Mammalian Science. 51: 79–95
60. Dobson M, Kawamura Y (1998) Origin of the Japanese Land Mammal Fauna: Allocation of Extant Spe-cies to Historically-based Categories. Quaternary Research (Tokyo) 37: 385–395.
61. Hasegawa Y (1979) Summary of Quaternary Carnivora in Japan. Honyurui Kagaku (Mammalian Sci-ence) 38: 23–28.
62. Takakuwa Y, Anezaki T, Kimura T (2007) Fossil of the brown bear from Fuji-do cave Ueno Village, Gunma Prefecture, Japan. Bull. Gunma Mus. Natu. Hist 11: 63–72.
64. Taruno H (2010) Honyurui kaseki no hensen kara mita Nihon Retto to tairiku no rikkyo no keisei jiki (The stages of land bridge formation between the Japanese Islands and the continent on the basis of faunal succession). Daiyonki Kenkyu (The Quaternary Research) 49: 315–322.
65. Takahashi K (2007) Nihon Retto no Senshin-Koshinsei ni okeru rikusei honyu dobutsu-so no keisei katei (The formative history of the terrestrial mamalian fauna of the Japanese Islands during the Plio-Pleistocene). Kyusekki Kenkyu (Palaeolithic Research) 3: 5–14.
66. Kawamura Y, Taruno H (2000) Immigration of mammals into Japan during the Quaternary, with com-ments on land or ice bridge formation enabled human immigration. Acta Anthrop Sinica Suppl 19: 264– 269.
67. Lisiecki LE, Raymo ME (2005) A Pliocene-Pleistocene stack of 57 globally distributed benthicδ18O records. Paleoceanography 20: 1–17.