ACPD
8, 16335–16379, 2008Interannual variability of long-range transport at MBO
D. R. Reidmiller et al.
Title Page
Abstract Introduction
Conclusions References
Tables Figures
◭ ◮
◭ ◮
Back Close
Full Screen / Esc
Printer-friendly Version
Interactive Discussion
Atmos. Chem. Phys. Discuss., 8, 16335–16379, 2008 www.atmos-chem-phys-discuss.net/8/16335/2008/ © Author(s) 2008. This work is distributed under the Creative Commons Attribution 3.0 License.
Atmospheric Chemistry and Physics Discussions
This discussion paper is/has been under review for the journalAtmospheric Chemistry and Physics (ACP). Please refer to the corresponding final paper inACPif available.
Interannual variability of long-range
transport as seen at the Mt. Bachelor
Observatory
D. R. Reidmiller1,2, D. A. Jaffe2, D. Chand1,2, S. Strode1,*, P. Swartzendruber1,2, G. M. Wolfe3, and J. A. Thornton1
1
Department of Atmospheric Sciences, University of Washington, Seattle, WA, USA
2
Interdisciplinary Arts and Sciences, University of Washington-Bothell, Bothell, WA, USA
3
Department of Chemistry, University of Washington, Seattle, WA, USA
*
now at: O’Brien & Gere Engineers Inc. Blue Bell, PA, USA
Received: 30 July 2008 – Accepted: 30 July 2008 – Published: 26 August 2008
Correspondence to: D. R. Reidmiller ([email protected])
ACPD
8, 16335–16379, 2008Interannual variability of long-range transport at MBO
D. R. Reidmiller et al.
Title Page
Abstract Introduction
Conclusions References
Tables Figures
◭ ◮
◭ ◮
Back Close
Full Screen / Esc
Printer-friendly Version
Interactive Discussion
Abstract
Interannual variations in background tropospheric trace gases (such as carbon monox-ide, CO) are largely driven by variations in emissions (especially wildfires), transport pathways and tropospheric oxidizing capacity. Understanding this variability is essen-tial to quantify the intercontinental contribution to US air quality. We investigate the 5
interannual variability of long-range transport of Asian pollutants to the Northeast Pa-cific via measurements from the Mt. Bachelor Observatory (MBO: 43.98◦N, 121.69◦W; 2.7 km above sea level) and GEOS-Chem chemical transport model simulations in spring 2005 vs. the INTEX-B campaign during spring 2006. Measurements of CO at MBO were significantly enhanced during spring 2005 relative to the same time in 2006 10
(the INTEX-B study period); a monthly mean decline in CO of 41 ppbv was observed between April 2005 and April 2006. Meteorological indices show that long-range trans-port of CO from the heavily industrialized region of East Asia was significantly greater in 2005 than in 2006. In addition, spring 2005 was an anomalously strong biomass burn-ing season in Southeast Asia. Data presented by Yurganov et al. (2008) usburn-ing MOPITT 15
satellite retrievals from this area reveal an average CO burden anomaly (referenced to March 2000–February 2002 mean values) between October 2004 through April 2005 of 2.6 Tg CO vs. 0.6 Tg CO for the same period a year later. The Naval Research Lab-oratory’s global aerosol transport model shows that emissions from these fires were ef-ficiently transported to MBO throughout April 2005. Asian dust transport, however, was 20
substantially greater in 2006 than 2005, particularly in May. Monthly mean aerosol light scattering coefficient at 532 nm (σsp) at MBO more than doubled from 2.7 Mm−1in May 2005 to 6.2 Mm−1
in May 2006. We also evaluate CO interannual variability throughout the western US via Earth System Research Laboratory ground site data and through-out the Northern Hemisphere via MOPITT and TES satellite observations. Both in the 25
ACPD
8, 16335–16379, 2008Interannual variability of long-range transport at MBO
D. R. Reidmiller et al.
Title Page
Abstract Introduction
Conclusions References
Tables Figures
◭ ◮
◭ ◮
Back Close
Full Screen / Esc
Printer-friendly Version
Interactive Discussion
Southeast Asia during winter 2004 through spring 2005, and (b) the transport pattern in 2006 which limited the inflow of Asian pollution to the lower free troposphere over western North America.
1 Introduction
Trans-Pacific transport of pollution from Asia is well-documented (Jaffe et al., 1999, 5
2003, 2004; Bey et al., 2001; Goldstein et al., 2004; Parrish et al., 2004; Singh et al., 20081). Its effects on air quality in the downwind regions of the western US have been the focus of many recent studies (Wang et al., 2003; Akimoto, 2003). With the objective of quantifying the contribution of foreign emissions to domestic air quality throughout the Northern Hemisphere, the United Nations Economic Commission for 10
Europe has recently established an international Task Force on Hemispheric Transport of Air Pollution (HTAP, 2007).
To date, much work has been done towards understanding the processes control-ling inter-continental transport. Wang et al. (2006) find that meteorology is most con-ducive to trans-Pacific transport in the lower troposphere early in the spring (March 15
and April) and in the upper troposphere in May. Specifically, frontal lifting ahead of southeastward-moving cold fronts and convective transport (particularly from South-east Asia) are the most important processes responsible for such transport (Liu et al., 2003; Holzer and Hall, 2007). Trans-Pacific transport of pollution typically occurs on timescales of 1–2 weeks in the mid-troposphere. Variability of this transport has been 20
studied on timescales ranging from days to seasons to years and even decades (Allen et al., 1996; Liang et al., 2004, 2005; Holzer and Hall, 2007; Fischer et al., 20082).
1
Singh, H. B., Brune, W. H. Crawford, J. H., Jacob, D. J., Russell, P. B., et al.: An overview of the INTEX-B campaign: transport and transformation of pollutants over the Pacific and the Gulf of Mexico, Atmos. Chem. Phys. Discuss., in preparation, 2008.
2
ACPD
8, 16335–16379, 2008Interannual variability of long-range transport at MBO
D. R. Reidmiller et al.
Title Page
Abstract Introduction
Conclusions References
Tables Figures
◭ ◮
◭ ◮
Back Close
Full Screen / Esc
Printer-friendly Version
Interactive Discussion
We have the unique capacity to investigate the interannual variability of Asian long-range transport through continuous measurements of multiple species from the Mt. Bachelor Observatory (MBO: 43.98◦N, 121.69◦W; 2.7 km a.s.l.), our free-tropospheric background site in operation since spring 2004 (Jaffe et al., 2005; Weiss-Penzias et al., 2006).
5
The rapid development of China over the past two decades has resulted in an in-crease in anthropogenic emissions (Irie et al., 2005; Richter et al., 2005). Modeling studies and satellite observations have shown that the region’s development has had noticeable effects on air quality in western North America (Akimoto, 2003; Zhang et al., 2008). This pollutant burden originating in Asia has been detected at ground-based 10
sampling stations in the western US (Jaffe et al., 2001; Weiss-Penzias et al., 2004). Jaffe and Ray (2007) found a positive trend in surface ozone (O3) at background sites
in the western US from 1987–2004. While the authors do not assign a single cause, they note that the surge in O3 precursor emissions (nonmethane-hydrocarbons and nitrogen oxides) from Asia is a likely contributor.
15
Motivated in part by these previous studies, the Intercontinental Chemical Trans-port Experiment (INTEX-B: http://www.espo.nasa.gov/intex-b, Singh et al., 20081) took place during spring 2006 (15 April–15 May) with the objective of characterizing the pollution flowing into the West Coast of the United States, particularly from Asia. A collaborative effort among NASA, NCAR and a variety of university research groups, 20
INTEX-B produced data from several platforms (ground-based observations, aircraft measurements, remote sensing information, model output, etc.). Among these was the University of Washington’s Duchess aircraft which flew seven flights offthe coast of Washington state; results from this analysis are presented by Swartzendruber et al. (2008). Through an investigation of trans-Pacific transport pathways, INTEX-B pro-25
vided an opportunity to better understand the meteorological aspects of interannual variability in trace gases. Of particular interest during INTEX-B was the transport of Asian emissions to western North America.
ACPD
8, 16335–16379, 2008Interannual variability of long-range transport at MBO
D. R. Reidmiller et al.
Title Page
Abstract Introduction
Conclusions References
Tables Figures
◭ ◮
◭ ◮
Back Close
Full Screen / Esc
Printer-friendly Version
Interactive Discussion
of fossil fuels as well as by intentional biomass burning for agricultural purposes. It is also emitted naturally through wildfires and is a byproduct of the oxidation of methane and other hydrocarbons. With a tropospheric lifetime on the order of several weeks to months (depending largely on latitude and season) and relatively simple chemistry, an investigation of the spatiotemporal variability of CO allows a study into the relative 5
influences of source regions, meteorology and chemical loss on its global distribution (Novelli et al., 1998; Holloway et al., 2000). Interannual variability in CO is controlled by changes in emissions (particularly wildfires), transport pathways and the oxidizing capacity of the troposphere.
Many studies of the spatial and temporal variability of CO in the north Pacific exist, 10
but as Granier et al. (1996) and others note, year-to-year variations in CO abundances are not well established. Holloway et al. (2000) examine how the three major sources of CO (fossil fuel combustion, biomass burning and oxidation of biogenic hydrocarbons and CH4), as well as its main sink (reaction with OH), vary seasonally and globally. Khalil and Rasmussen (1988) detected a positive trend in global CO of 0.8–1.4%/yr 15
during the 1980s, which they attributed to increasing anthropogenic emissions. Sev-eral years later the same authors (Khalil and Rasmussen, 1994) reported a global decrease in tropospheric CO concentrations of −2.6%/yr during the late 1980s and
into the early 1990s. The authors attributed this trend to decreasing anthropogenic emissions in the Northern Hemisphere (mainly from pollution controls in North Amer-20
ica and Europe) and potentially decreasing tropical biomass burning emissions in the Southern Hemisphere. These studies exemplify the need for caution in reading too much into the existence of “trends” in CO and highlight the need to understand the highly variable interannual changes in CO.
Recently, Szopa et al. (2007) utilized surface measurements and model results from 25
ACPD
8, 16335–16379, 2008Interannual variability of long-range transport at MBO
D. R. Reidmiller et al.
Title Page
Abstract Introduction
Conclusions References
Tables Figures
◭ ◮
◭ ◮
Back Close
Full Screen / Esc
Printer-friendly Version
Interactive Discussion
tropics. The exception to this appears to be during specific episodes, such as El Ni ˜no periods, which are typically associated with intense tropical biomass burning that can drive large interannual changes in CO concentrations globally.
The focus of this paper will be on the interannual variability of long-range transport of East Asian pollution (particularly CO) to the Northeast Pacific between spring 2005 5
and spring 2006. We present and analyze measurements recorded at MBO during the spring seasons of 2005 and 2006, which includes the INTEX-B study period. Our analysis focuses on the decrease in CO from spring 2005 to spring 2006 observed at MBO as well as in MOPITT and TES satellite observations. The GEOS-Chem 3-D chemical transport model is employed using constant, climatological emissions to 10
understand the meteorological contribution to this change. A comparison of trace gas measurements made at MBO during spring 2005 and 2006 reinforce the findings from the CO analysis. We then utilize the Asian long-range transport indices developed by Wolfe et al. (2007) and Liang et al. (2005) to show that emissions from East Asia had a greater effect on lower tropospheric air quality in the northwestern US in spring 15
2005 than in spring 2006. Finally, we extend the analysis of CO variability between 2005 and 2006 to the broader western US (using Earth System Research Laboratory (ESRL) ground site data), and throughout the Northern Hemisphere via MOPITT and TES satellite retrievals to show that wildfire activity also played a role in the observed changes in CO.
20
2 Instrumentation and methodology
2.1 Mt. Bachelor site and instrumentation
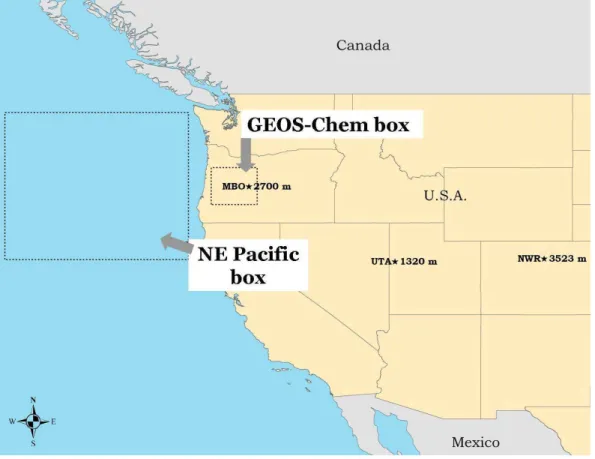
The MBO site (Fig. 1: 43.98◦N, 121.69◦W; 2.7 km a.s.l.) has been described in detail
elsewhere (Jaffe et al., 2005; Weiss-Penzias et al., 2006, 2007; Swartzendruber et al., 2006; Wolfe et al., 2007). In brief, Mt. Bachelor is an isolated volcanic peak located in 25
ACPD
8, 16335–16379, 2008Interannual variability of long-range transport at MBO
D. R. Reidmiller et al.
Title Page
Abstract Introduction
Conclusions References
Tables Figures
◭ ◮
◭ ◮
Back Close
Full Screen / Esc
Printer-friendly Version
Interactive Discussion
of the mountain. The nearest populated areas are Bend (population 65 210), 31 km to the east and Redmond (population 21 109), which is 53 km northeast of MBO. Winds at the summit usually have a strong westerly component, so it is rare that anthropogenic pollution from either town reaches the station. Eugene (population 142 180) is mainly a university-town located 140 km west of MBO and is the only major population center 5
between MBO and the Pacific coast. Instrumentation is housed in the ski lift building on the mountain’s summit. The lift itself is electric; the only emissions at the sum-mit are due to the occasional passes of snow-grooming equipment. Contamination from these groomers is easily identified by spikes in NOx, CO and aerosol scattering
coefficient and has been screened out for our analysis. The sampling inlet line for 10
gaseous measurements is 5/8′′ OD PFA tubing and is located
∼15 m above the
in-strument room and 4 m above the roof of the building. Ambient air is drawn through a
1µm Teflon filter and into a gas distribution manifold at a rate of∼20 sLpm. All trace
gas measurement systems are connected to this manifold, except the Hg instrumen-tation, which has its own specially-designed inlet (Swartzendruber et al., 2006). Basic 15
meteorological measurements (temperature, relative humidity (RH), ambient pressure, wind speed and direction) are collected near the inlet. Water vapor has been calcu-lated using ambient temperature and RH measured from a Campbell Scientific HMP 45C probe that is calibrated every six months. Beginning 26 April 2006, a second Campbell Scientific HMP 45C probe was installed in an area that is sheltered, but still 20
exposed to ambient conditions, to obtain measurements from a probe that was not as susceptible to riming. A Licor 6262 (calibrated every six months) also measured wa-ter vapor until 1 April 2006. CO was measured using a TECO 48C-TL non-dispersive infrared instrument. It was zeroed every 20 min and calibrated daily using a working standard that was referenced to three standard reference gases (provided by ESRL in 25
ab-ACPD
8, 16335–16379, 2008Interannual variability of long-range transport at MBO
D. R. Reidmiller et al.
Title Page
Abstract Introduction
Conclusions References
Tables Figures
◭ ◮
◭ ◮
Back Close
Full Screen / Esc
Printer-friendly Version
Interactive Discussion
sorption instrument (Dasibi, Inc.). It was calibrated quarter-annually with an O3transfer standard referenced to a State of Washington primary O3standard. Sub-micron
scat-tering coefficient at 532 nm (σsp) was measured with a Radiance Research integrating nephelometer through its own inlet of nonconductive tubing. It was calibrated quarterly with pure CO2 gas. Theσspdata in this paper are presented at ambient pressure and 5
temperature. Total airborne mercury (THg) was measured from March 2004–March 2005. Thereafter, a speciation component was added, allowing separate measure-ments of elemental mercury (Hg0), particulate mercury (PHg) and reactive gaseous mercury (RGM). Instrumental design and specifications for the Hg measurements at MBO are discussed at length in Swartzendruber et al. (2006). During INTEX-B acyl 10
peroxy nitrates (APNs) were measured at MBO using a custom-built thermal dissocia-tion chemical ionizadissocia-tion mass spectrometer, or TD-CIMS (Wolfe et al., 2007).
2.2 GEOS-Chem model description
The GEOS-Chem 3-D global chemical transport model (http://www-as.harvard.edu/ chemistry/trop/geos; Bey et al., 2001) is driven by assimilated meteorological data 15
compiled at the Goddard Earth Observing System (GEOS) of the NASA Global Mod-eling and Assimilation Office (GMAO), which include winds, temperature, surface pres-sure, water content, clouds, precipitation, convective mass fluxes, mixed layer depth and surface properties. It has been used extensively in chemical transport studies in the Northeast Pacific (Liu et al., 2003; Goldstein et al., 2004; Liang et al., 2004, 20
2005; Wang et al., 2006; Auvray et al., 2007; Zhang et al., 2008) and at MBO (Weiss-Penzias et al., 2004; Swartzendruber et al., 2006; Liang et al., 2007). Model output (version 7.04.05) has been compared with mean CO measurements from MBO us-ing data with a resolution of 1 h. Results were obtained for the 2◦
×2.5◦ box covering
43–45◦N, 121.25–123.75◦W around MBO (Fig. 1). 25
ACPD
8, 16335–16379, 2008Interannual variability of long-range transport at MBO
D. R. Reidmiller et al.
Title Page
Abstract Introduction
Conclusions References
Tables Figures
◭ ◮
◭ ◮
Back Close
Full Screen / Esc
Printer-friendly Version
Interactive Discussion
around MBO covers a region of mountainous terrain in the Cascade Range. Sigma-level 5, on average, tends to compare best with the most chemical and meteorological tracers (L. Jaegl ´e, personal communication, 2008). However, sigma-levels 5 through 7 (i.e., pressure levels from 746 hPa–574 hPa) can match best with observed CO values at MBO under various meteorological conditions and/or seasons. Therefore, we have 5
averaged the results from sigma-levels 5–7 for our analysis here.
The model was run using monthly archived OH fields, as well as climatological, monthly varying anthropogenic emissions scaled to 1998 using the approach described by Bey et al. (2001) and biomass burning emissions from 1996–2000 (Duncan et al., 2003). Using constant, climatological emissions allows us to analyze the role meteorol-10
ogy played in the interannual variability of CO. Tagged Asian fossil fuel CO emissions were output for the box bounded by 65–146◦E, 9◦S–90◦N, and tagged Asian biomass burning CO emissions were constrained to the region covering 65–146◦E, 9◦S–45◦N. The model comparison with MBO and its implications are discussed in more detail in Sect. 4.2.
15
2.3 MOPITT and TES satellite descriptions
Carbon monoxide in the troposphere is routinely retrieved from thermal infrared mea-surements by the Tropospheric Emissions Spectrometer (TES; Beer et al., 2001) and Measurements of Pollution in the Troposphere (MOPITT; Drummond and Mand 1996) instruments on-board the Aura and Terra satellites launched in July 2004 and Decem-20
ber 1999, respectively. MOPITT CO products have been evaluated by comparisons to aircraft and ground-based measurements (Emmons et al., 2004, 2007; Warner et al., 2007). Emmons et al. (2004) show a good overall quantitative agreement between MOPITT and in situ profiles with a small average positive bias (i.e., MOPITT senses higher values) at all altitudes. The standard deviation of the mean biases is large, 25
however, particularly for the lower troposphere (∼20%). The large positive biases
ACPD
8, 16335–16379, 2008Interannual variability of long-range transport at MBO
D. R. Reidmiller et al.
Title Page
Abstract Introduction
Conclusions References
Tables Figures
◭ ◮
◭ ◮
Back Close
Full Screen / Esc
Printer-friendly Version
Interactive Discussion
of 9–17 ppbv when compared to in situ profiles, which is consistent with Emmons et al. (2004) and within the design criteria for 10% accuracy. Warner et al. (2007) corrob-orate the findings of Emmons et al. (2004, 2007) by showing a positive bias in MOPITT of 15–20 ppbv in the lower atmosphere over the oceans as part of evaluation exercises during the INTEX-A campaign. Similar evaluation exercises have been carried out for 5
TES retrievals, though they are fewer in number given the shorter lifetime of TES to date (Osterman et al., 2005; Luo et al., 2007a). Luo et al. (2007a) compare TES profiles to aircraft profiles during INTEX-B and find good agreement over the Houston area, with TES detecting only 0–10% lower CO than the aircraft profiles. Comparisons were not as good near Hawaii or over Anchorage, Alaska, where long-range transport of 10
pollution created plumes that the aircraft sampled but TES may not have passed over. These latter attempts exemplify the challenging nature of obtaining good comparisons between satellites and aircraft. Luo et al. (2007b) show how different TES and MOPITT retrievals can be from each other, but present techniques to bring the retrieved profiles into better agreement (such as adjusting the TES profiles to the MOPITT a priori and 15
vertically smoothing the MOPITT profiles by the TES averaging kernels).
The retrieved profile from each platform is a linear combination of the averaging kernel-weighted true and a priori profiles in conjunction with retrieval errors (Luo et al., 2007a, b). There are significant differences in the a priori profile and covariance matrix constraints for TES retrievals and those adopted by MOPITT; these are described by 20
Kulawik et al. (2006) and Deeter et al. (2003), respectively. In brief, the main diff er-ence is that TES CO retrievals select a priori profiles given by the MOZART chemical transport model (Brasseur et al., 1998). Monthly mean mixing ratios in 10◦ latitude by
60◦ longitude bins are used to create the a priori profiles assumed for TES retrievals (Rinsland et al., 2006). In contrast, MOPITT uses a single CO a priori profile derived 25
ACPD
8, 16335–16379, 2008Interannual variability of long-range transport at MBO
D. R. Reidmiller et al.
Title Page
Abstract Introduction
Conclusions References
Tables Figures
◭ ◮
◭ ◮
Back Close
Full Screen / Esc
Printer-friendly Version
Interactive Discussion
2007). In general, daytime observations should produce better thermal contrast con-ditions between the surface and lower troposphere because of surface heating due to the absorption of solar radiation (Deeter et al., 2007). The averaging kernels for both TES and MOPITT throughout the lower troposphere are very similar, indicating that the CO information in the retrievals comes mainly from the 700–500 hPa layer, with 5
some additional information in the upper troposphere (Emmons et al., 2007). As a re-sult, we present daytime-only, lower- to mid-tropospheric results. These vertical levels also correspond fairly well with the free-tropospheric altitude of MBO (∼730 hPa). We
use retrievals from a regional box over the Northeast Pacific Ocean (Fig. 1: 40◦–48◦N, 125◦–135◦W) for our analysis since this provides a measure of CO without issues that 10
impact retrievals, such as topography (causing changes in column density) and vari-able surface temperature and emissivity. This is the first time monthly mean L3 TES data products have been published (courtesy of M. Luo and G. Osterman, 2007).
2.4 Meteorological indices of long-range transport
To assess the relative degree of trans-Pacific transport of Asian pollution to MBO, we 15
employ two previously devised Asian long-range transport (ALRT) indices. The first was developed by Wolfe et al. (2007) and uses 10-day kinematic backtrajectories cal-culated from the Hybrid Single-Particle Lagrangian Integrated Trajectory (HYSPLIT) model (Draxler and Rolph, 2003; http://www.arl.noaa.gov/ready/hysp info.html). The model was run with FNL meteorological data (Final Global Data Assimilation System), 20
which has a 6 h temporal resolution, 191 km2horizontal resolution and vertical informa-tion from 13 pressure levels ranging from 1000 to 20 hPa. Twenty-five backtrajectories are calculated in a 0.5◦ by 0.5◦ horizontal grid at 100 m vertical intervals from 0 to 2900 m above ground level (a.g.l.) for every hour of the study period (1 March–31 May of 2005 and 2006). The number of hours each backtrajectory particle spends in the 25
boundary layer (defined as 0–3 km) of an “Asian box” bounded by 20–45◦N by 100– 130◦E (which covers the heavily developed and industrial region of east-central China
initial-ACPD
8, 16335–16379, 2008Interannual variability of long-range transport at MBO
D. R. Reidmiller et al.
Title Page
Abstract Introduction
Conclusions References
Tables Figures
◭ ◮
◭ ◮
Back Close
Full Screen / Esc
Printer-friendly Version
Interactive Discussion
ization time and altitude. Thus, an “ALRT Index” value of 20 h could be interpreted to mean that an “average” backtrajectory particle spent 20 h in the boundary layer of the Asian box en route to MBO. The reader is referred to Weiss-Penzias et al. (2006) and Wolfe et al. (2007) for more details on the development of this index and its use in analysis of trace gas observations.
5
The second long-range transport index, LRT3, was developed by Liang et al. (2005). The LRT3 index is defined using weighted sea-level pressure (SLP) anomalies in the North Pacific (0–76◦N, 149◦E–124◦W):
LRT3=
1 n
n
P
i=1
ri×∆Pi
σ (1)
where ri is the correlation coefficient between local SLP anomalies, ∆Pi, and the 10
monthly transpacific transport time series, andσ is the standard deviation of the nu-merator. This metric identifies stronger than normal Pacific High and Aleutian Low pressure systems (i.e., positive LRT3 values), which together result in efficient trans-port of anthropogenic Asian emissions across the Pacific during winter and spring. Liang et al. (2005) compare the LRT3 index with modeled CO columns in the NE Pa-15
cific. The authors create a trans-Pacific transport timeseries by calculating the per-centage change in modeled monthly mean anthropogenic CO relative to the 1992– 2002 monthly mean climatology of Asian anthropogenic CO columns (0–8 km) over a NE Pacific region bounded by 20–60◦N, 105–130◦W. Analyzing data from 1992–2002, Liang et al. (2005) find that LRT3 captures 42% and 55% of the monthly and interan-20
nual variance in transpacific transport, respectively. The authors go on to show that the LRT3 index correlates well with the Pacific North American (PNA) pattern (R=0.69). Zhang et al. (2008) further elaborate upon this synoptic pattern for Pacific trans-port in the context of INTEX-B. Note that the LRT3 index was devised specifically for trans-Pacific transport of Asian anthropogenic CO (i.e., CO emissions from the heavily 25
ACPD
8, 16335–16379, 2008Interannual variability of long-range transport at MBO
D. R. Reidmiller et al.
Title Page
Abstract Introduction
Conclusions References
Tables Figures
◭ ◮
◭ ◮
Back Close
Full Screen / Esc
Printer-friendly Version
Interactive Discussion
Asia. The impacts of these emissions are discussed in Sect. 6.1.
3 INTEX-B results from MBO
When analyzing measurements from a mountaintop site such as MBO, it is essential to understand the relative influences of downslope/free troposphere (FT)-dominated air from upslope air. Previous efforts have used the 20th (80th) percentile of water vapor – 5
the driest (wettest) 1/5 of the data – to denote these respective airmass types (Weiss-Penzias et al., 2006, 2007). This method works fairly well, but discards 60% of the data. Here, we have segregated the MBO data by the driest and wettest 1/3 (33rd and 67th percentile of water vapor, respectively), thereby eliminating only 33% of the total hourly data.
10
Using water vapor as a segregating criterion over the entire spring (1 March–31 May) creates a bias in “dry” times toward earlier in the spring. Thus, we also segregated the data by a “time-of-day” criterion defined as:
(a) daytime – 5 h after sunrise to 1 h after sunset, and
(b) nighttime – 5 h after sunset to 1 h after sunrise. 15
As with the water vapor analysis, this time-of-day segregation retained 16 h of data per day, discarding 8 h (or 1/3) of the data as “transitional” times. This time-of-day segregation does not introduce an “artificial” bias in dry data towards March; rather it is a physical one based on the fact that the nights are longer earlier in the spring. We found that the differences in the means, medians and extreme (10th and 90th) 20
percentiles of the segregated data were greater using the 33rd and 67th percentiles of water vapor as opposed to the “day” and “night” time-of-day segregation. As a result, we report results using water vapor as a segregating criterion.
ACPD
8, 16335–16379, 2008Interannual variability of long-range transport at MBO
D. R. Reidmiller et al.
Title Page
Abstract Introduction
Conclusions References
Tables Figures
◭ ◮
◭ ◮
Back Close
Full Screen / Esc
Printer-friendly Version
Interactive Discussion
results from the two spring seasons in the next section. Here, we briefly summarize the findings in spring 2006, the INTEX-B study period. Water vapor is significantly different between the driest and wettest 1/3 of data and a substantial difference in O3 is observed as well. This is to be expected as dry air is typically associated with
descending FT air which is rich in O3. In contrast, the wetter boundary layer (BL)-5
influenced air shows lower O3 reflecting the strength of regional deposition as well as
the scarcity of O3 precursors (e.g., NOx=NO+NO2) sources in the area. The other
significant difference between the dry and wet data can be seen in measurements of Hg species. Swartzendruber et al. (2006) found that elemental Hg (Hg0) and reactive gaseous Hg (RGM) are anticorrelated, with RGM showing significant enhancements 10
in subsiding FT air. RGM shows wide variability (1σ>100% of the mean), indicating a small number of significant enhancements create a non-normal distribution of the data. Wolfe et al. (2007) also found significant enhancements of acyl peroxy nitrates (APNs) in FT air relative to BL-influenced air at MBO during INTEX-B. In general, CO, O3and σspvalues are similar to measurements from other western US background sites (Jaffe 15
et al., 1999, 2001; Goldstein et al., 2004; Weiss-Penzias et al., 2004).
4 INTEX-B (Spring 2006) vs. Spring 2005: results
4.1 Interannual changes in springtime CO: MBO
The interannual variability in CO observed at MBO from spring 2005 to spring 2006 inspired much of this analysis. Figure 2a illustrates the complete timeseries of monthly 20
mean CO at MBO from January 2004 through December 2007. Figure 2b shows monthly CO anomalies referenced to monthly mean CO for the entire 2004–2007 pe-riod. Strong seasonal cycles are seen each year, illustrating a late-winter/early spring maximum (due to diminished OH concentrations from minimal sunlight throughout the winter) and a late summer minimum (when the OH sink is much stronger due to en-25
ACPD
8, 16335–16379, 2008Interannual variability of long-range transport at MBO
D. R. Reidmiller et al.
Title Page
Abstract Introduction
Conclusions References
Tables Figures
◭ ◮
◭ ◮
Back Close
Full Screen / Esc
Printer-friendly Version
Interactive Discussion
springtime (maximum) CO decreased by 41 ppbv (21%) from 2005 to 2006.
4.2 Interannual changes in springtime CO: GEOS-Chem chemical transport model
To understand what drove this significant change in CO we compared measurements from MBO to total and Asian-tagged CO from the GEOS-Chem model. Before dis-cussing the results from GEOS-Chem in detail, it is necessary to assess the model 5
skill in representing CO as measured at MBO. As discussed in Sect. 2.2., GEOS-Chem has difficulty vertically resolving BL-FT interactions in regions of complex terrain, such as the location of MBO. We have used the same time-of-day segregation criterion mentioned in Sect. 3 in an effort to show the role played by varying meteorological conditions in choosing the most appropriate model level to compare with the observa-10
tions. The results from a springtime (March 1–May 31) comparison with total CO from GEOS-Chem showed that results from sigma-levels 5–7 correlated best to hourly CO observations from MBO.
Figure 3 illustrates the percentage change in CO between the spring months of 2005 to 2006 at MBO as well as from the GEOS-Chem model and satellite retrievals over 15
the NE Pacific. GEOS-Chem showed a decline in total and Asian-tagged CO from spring 2005 to spring 2006. The magnitude of the percentage change is greater in the Asian- tagged CO (−4% to−7%) than in total CO (+7% to−6%), indicating that the
simulated decline is at least in part driven by changes in trans-Pacific transport of Asian CO. Recall, results from sigma-levels 5–7 (i.e., pressure levels from 746 hPa–574 hPa) 20
are used in Fig. 3 for reasons discussed above and in Sect. 2.2. Results from the individual upper sigma-levels (6 and 7) show an even greater CO decrease (5–9%). The results using climatological emissions do not fully capture the observed changes in CO, arguing that some change in emissions probably occurred as well. This will be discussed in more detail in Sect. 6.1.
ACPD
8, 16335–16379, 2008Interannual variability of long-range transport at MBO
D. R. Reidmiller et al.
Title Page
Abstract Introduction
Conclusions References
Tables Figures
◭ ◮
◭ ◮
Back Close
Full Screen / Esc
Printer-friendly Version
Interactive Discussion
4.3 Interannual changes in springtime CO: MOPITT and TES satellite retrievals
Figure 3 also illustrates results from MOPITT and TES satellite retrievals from a box representative of the region around MBO, but placed just off-shore over the Northeast Pacific Ocean (for reasons detailed in Sect. 2.3). As Edwards et al. (2006) note, we should not expect CO mixing ratios from MOPITT mid-tropospheric retrievals (or those 5
from TES) and measurements from a single point in space (e.g., MBO) to be quan-titatively comparable as they sample different parts of the troposphere. As a result, we used the over-ocean box for our retrievals and report the CO changes in Fig. 3 as percentages rather than mixing ratios. In Fig. 3 we show both the total column and 700 hPa monthly changes in MOPITT CO between 2005 and 2006. The results from 10
both pieces of information are quite similar, showing declines from April 2005 to April 2006 of∼5%. Mid-tropospheric (562 hPa) CO from TES, on other hand, showed the
greatest year-to-year decline (∼7%) in March. Unlike MBO and GEOS-Chem, however,
both satellite instruments detected an increase in CO from May 2005 to May 2006 of
∼7%. While these changes may be close to the uncertainty in CO measurements
15
from MOPITT and TES, the corroboration from other measurements and GEOS-Chem suggests they are real changes.
Taken together, we see fairly similar changes observed in springtime CO from MBO, GEOS-Chem and both MOPITT and TES satellite retrievals. The CO declines are greatest for April at MBO. The lower changes seen in the GEOS-Chem simulations 20
are largely caused by the utilization of constant, climatological emissions thereby re-flecting changes in transport only. However, vertical resolution / mixing issues that are a perennial issue with chemical transport models, particularly over areas of complex terrain such as MBO, are also likely to be part of the cause. The observed decrease in April CO from 2005 to 2006 in MOPITT and TES is also lower than observed at MBO. 25
This is potentially due to:
ACPD
8, 16335–16379, 2008Interannual variability of long-range transport at MBO
D. R. Reidmiller et al.
Title Page
Abstract Introduction
Conclusions References
Tables Figures
◭ ◮
◭ ◮
Back Close
Full Screen / Esc
Printer-friendly Version
Interactive Discussion
2. the influence of a priori profiles in the satellite retrievals.
4.4 Interannual changes in other species at MBO
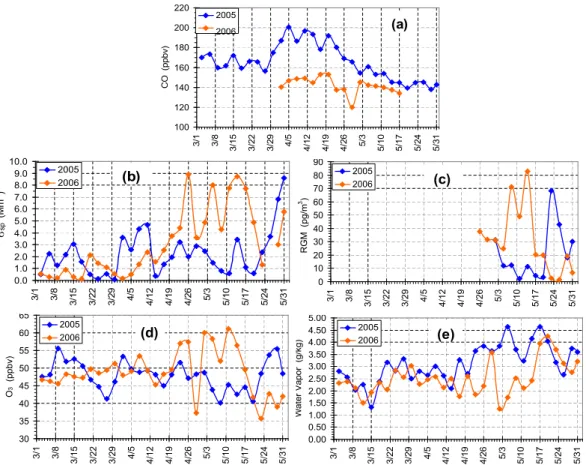
Figure 4a–e shows 3-day averages of various species (CO,σsp, RGM, O3 and water
vapor) measured at MBO throughout spring 2005 and 2006. Using 3-day averages allows us to smooth out most spikes due to transport events while still allowing sub-5
monthly resolution. Analysis of these plots allows us to paint a more complete picture of the differences between spring 2005 and spring 2006 at MBO. Figure 4a illustrates 3-day mean CO from 1 March–31 May of both years. Unfortunately, due to instrumental maintenance, a less-complete timeseries is available for 2006; however, significant differences between the two springs can readily be seen. CO is substantially greater in 10
April 2005 than in April 2006. Three-day average CO mixing ratios upward of 180 ppbv were observed, with episodes in excess of 200 ppbv. Towards the end of April and into May 2005, however, CO concentrations decreased to more climatological levels (∼150 ppbv). In contrast, during April and May 2006 (i.e., INTEX-B) we observed CO
levels of∼140 ppbv.
15
Figure 4b shows the 3-day means of σsp for the two years. Levels in both spring seasons are fairly low in March, possibly due to the cloudier/stormier conditions lead-ing to scavenglead-ing and wet deposition prior to sampllead-ing at MBO. The biggest diff er-ence between the two timeseries is seen in late April and May. Very high levels of σsp were observed throughout late April and May 2006. The high variability seen in 20
the 3-day average speaks to the episodic nature of strong aerosol events at MBO. These aerosol peaks also show minimal correlation to CO, possibly indicating the role of a non-anthropogenic source. This observation is corroborated by two independent studies. Fischer et al. (2008)2 found spring 2006 to be an unusually strong season (when compared to 1998–2007) for Asian dust transport to the western US. In ad-25
dition, observations from the background Whistler mountaintop site in southwestern British Columbia, Canada (∼900 km NNW of MBO) during INTEX-B showed several
ACPD
8, 16335–16379, 2008Interannual variability of long-range transport at MBO
D. R. Reidmiller et al.
Title Page
Abstract Introduction
Conclusions References
Tables Figures
◭ ◮
◭ ◮
Back Close
Full Screen / Esc
Printer-friendly Version
Interactive Discussion
Figure 4c–e depicts 3-day averages of RGM, O3and water vapor, respectively. Ana-lyzing these three plots simultaneously provides insight into the relative degree of dry, FT, subsiding air being sampled at MBO. As Swartzendruber et al. (2006) note, sig-nificant enhancements in RGM are well-correlated with O3-rich air, both of which are representative of FT-influenced air. While the RGM timeseries (Fig. 4c) is limited mostly 5
to May of both years, we can see that 2006 exhibited particularly strong RGM events in early- to mid-May. During this time, Fig. 4d shows enhancements in O3 upward of 60 ppbv and Fig. 4e shows some of the driest air in either spring was sampled during this time in May 2006. These indicators support our findings, as well as those of Fischer et al. (2008)2 and McKendry et al. (2008), that May 2006 conditions in the northwest 10
US/southwest Canada were particularly conducive to dust transport originating in west-ern Asia.
5 INTEX-B (Spring 2006) vs. Spring 2005: analysis and implications
5.1 Backtrajectory analysis of Asian long-range transport to MBO
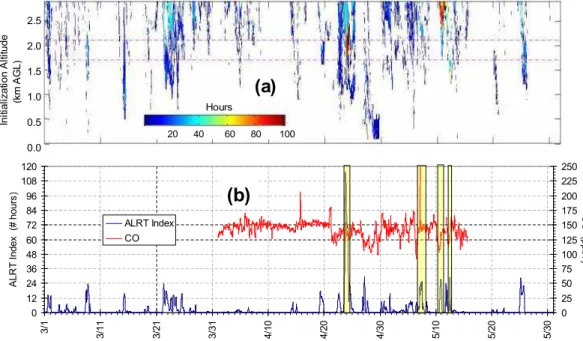
To examine the role of trans-Pacific pollution transport, we compare our CO measure-15
ments with an ensemble backtrajectory analysis described in Sect. 2.4. Figures 5a and 6a display the average residence time in the East Asian box for backtrajectories initialized at MBO for 2005 and 2006, respectively. A timeseries from each spring is plotted as a function of backtrajectory initialization altitude. As Wolfe et al. (2007) note, such plots illustrate ALRT events as downward-sloping “L”-shapes representing 20
the subsidence necessary to sample such plumes at lower tropospheric sites. Using Figs. 5a and 6a to compare predicted ALRT events with observations at MBO requires choosing HYSPLIT output from a representative altitude. The trajectory model calcu-lates ground level for MBO to be 1.0–1.1 km a.s.l., whereas the actual observatory on the summit is at 2.76 km a.s.l. Thus, MBO is∼1.7 km a.g.l. for the FNL meteorological
25
ACPD
8, 16335–16379, 2008Interannual variability of long-range transport at MBO
D. R. Reidmiller et al.
Title Page
Abstract Introduction
Conclusions References
Tables Figures
◭ ◮
◭ ◮
Back Close
Full Screen / Esc
Printer-friendly Version
Interactive Discussion
to analyze backtrajectories at several initialization altitudes to adequately capture de-scending LRT plumes.
In Figs. 5b and 6b, we plot the timeseries of the ALRT index (defined as the average number of hours the five backtrajectories initialized between 1.7 and 2.1 km a.g.l. spent in the Asian box) for 2005 and 2006, respectively. Overlaid in red is the hourly time-5
series of CO observations from MBO. Times when observed CO enhancements align with spikes in the ALRT index are highlighted with yellow boxes. It is worth noting that some plumes arrive at MBO at slightly different times from that predicted by the back-trajectory analysis. As Wolfe et al. (2007) point out this is especially true for strongly subsiding airmasses and a consequence of the accumulation of errors when running 10
the trajectory model over a 10-day period.
We should also note that a direct correlation between CO concentrations and the ALRT index should not necessarily be expected as there are numerous other influ-ences on the air sampled at MBO. In particular for CO, biomass burning emissions from Indonesia, Siberia and Alaska have been observed at MBO and other ground 15
sites in the northwestern US (Bertschi et al., 2004, 2005; Jaffe et al., 2004; Weiss-Penzias et al., 2007). Additionally, not all airmasses that have a high residence time in the Asian box will reach MBO with elevated CO levels as dilution and other chemical loss processes may deplete plume concentrations during transport.
Figures 5 and 6 illustrate the significant differences in ALRT influence in air sampled 20
at MBO in spring 2005 vs. 2006. Multiple events associated with fairly strong subsi-dence are evident in March 2005 (Fig. 5a). In most instances, these ALRT episodes co-incide with observed enhancements of CO and other pollutants at MBO. After mid-April 2005, however, there is a substantial decline in the ALRT influence. This is reflected in the CO measurements as well. In contrast, Fig. 6 shows far less ALRT influence 25
throughout spring 2006, particularly in March. According to the backtrajectory index, the strongest event in either year occurred 23–24 April 2006 in the middle of INTEX-B. However, the enhancement in CO is only ∼25 ppbv, far less than some of the other
ACPD
8, 16335–16379, 2008Interannual variability of long-range transport at MBO
D. R. Reidmiller et al.
Title Page
Abstract Introduction
Conclusions References
Tables Figures
◭ ◮
◭ ◮
Back Close
Full Screen / Esc
Printer-friendly Version
Interactive Discussion
Figure 7 shows the difference in ALRT index (in number of hours spent in the BL of the East Asian box) between 2005 and 2006. This clearly illustrates the interannual differences in ALRT influence in air sampled at MBO. The consistently negative values from 1 March through mid-April point to the far stronger influence of ALRT in 2005 than 2006, while the weakly positive values from late-April through mid-May indicate slightly 5
stronger ALRT influence in 2006 during this time.
5.2 LRT3 index analysis of Asian long-range transport to MBO
The other meteorological index used in diagnosing the influence of East Asian anthro-pogenic emissions on air sampled at MBO is the LRT3 index developed by Liang et al. (2005) and described in Sect. 2.4. Recall this index was designed specifically with 10
the transport of anthropogenic CO from the heavily developed east coast of China, Japan and Korean peninsula in mind. Positive LRT3 values indicate synoptic con-ditions characterized by a strong Pacific High pressure center coupled with a strong Aleutian Low. Table 2 displays a monthly climatology of springtime LRT3 index values from 2001 through 2006. March 2005 sticks out as an anomalously high positive value, 15
corroborating the findings presented earlier. The April 2005 value, however, is not anomalous, indicating that the prolonged CO enhancement observed at MBO during this time is likely not attributable to more efficient transport from East Asia. As we dis-cuss more in Sect. 6.1, the high CO values during April 2005 were due to very strong fires in Southeast Asia. Emissions from this region are transported to the Northeast 20
ACPD
8, 16335–16379, 2008Interannual variability of long-range transport at MBO
D. R. Reidmiller et al.
Title Page
Abstract Introduction
Conclusions References
Tables Figures
◭ ◮
◭ ◮
Back Close
Full Screen / Esc
Printer-friendly Version
Interactive Discussion
5.3 Other indicators of Asian long-range transport to MBO
Our conclusions regarding the interannual changes in trans-Pacific transport are sup-ported by other sources as well. The aerosol analyses of Fischer et al. (2008)2 and McKendry et al. (2008) suggest enhanced and significant transport of dust in spring 2006, especially in May. Swartzendruber et al. (2008) conducted 7 flights in a small 5
aircraft over and just offthe Washington State coast during INTEX-B. Outside of the Asian transport observed in late April, they found that plumes of Asian pollution re-mained at higher elevations (above ∼650 hPa) during the study period compared to
other years. This is consistent with results from our backtrajectory analysis as well as the LRT3 index values, both of which suggest that there was, in general, weaker subsi-10
dence over the Northeast Pacific in the early spring of 2006 than during the same time in 2005.
Returning to our segregation of the MBO data by water vapor, we compare our re-sults with those from Wolfe et al. (2007). Separating their data into three distinct sets – “ALRT”, “no ALRT” and “all” – Wolfe et al. (2007) found that median water vapor varied 15
minimally between the three datasets, indicating that ALRT is not necessarily restricted to dry FT airmasses. We have selected times when the ALRT index in Figs. 4b and 5b is greater than 20 h as being times when there is a potentially strong influence from the BL of the East Asian box. The largest CO enhancements tend to be observed when the ALRT index value is above 20 h (see highlighted boxes in Fig. 5b and 6b). These 20
times are compared to water vapor data collected at MBO. Both the ALRT index and the MBO water vapor measurements have 1 h resolution, so we compare the magni-tude of the ALRT index to the water vapor values at the same time. Figure 8 shows times when the ALRT index>20 h by 5th, 20th and 33rd percentiles of water vapor data for spring 2005 and spring 2006. For example, in 2005 20% of the hours when ALRT 25
ACPD
8, 16335–16379, 2008Interannual variability of long-range transport at MBO
D. R. Reidmiller et al.
Title Page
Abstract Introduction
Conclusions References
Tables Figures
◭ ◮
◭ ◮
Back Close
Full Screen / Esc
Printer-friendly Version
Interactive Discussion
March (climatologically drier air), whereas the presence of ALRT in 2006 did not reach MBO until much later in the spring (when wetter air is being sampled more often at MBO). Furthermore, the results show that segregating MBO data by the driest 1/3 is indeed a good first indicator of FT (and therefore potentially ALRT-influenced) air. This is certainly not to say that ALRT pollution cannot be seen in wet air, but rather that the 5
enhancements due to ALRT are more probable in dry air.
6 Interannual variability of CO in the western US and Northern Hemisphere
Figure 9 shows that significant changes in CO between spring 2005 and spring 2006 were observed throughout the western US. Data from the Niwot Ridge, CO (40.05◦N, 105.58◦W; 3523 m a.s.l.) and Wendover, UT (39.9◦N, 113.72◦W; 1320 m a.s.l.) high al-10
titude ESRL sites that are relatively uninfluenced by local pollution both show a decline in the springtime maximum CO from 2005 to 2006. The lone ESRL high-altitude site, Niwot Ridge, showed changes in CO concentrations of similar magnitude to those ob-served at MBO (1 March–31 May mean decline of 13 ppbv at Niwot Ridge vs. 24 ppbv at MBO), indicative of stronger CO enhancements in the lower free troposphere. It is 15
quite possible that the magnitude of change in CO was not as great at the ESRL sites as it was at MBO due to temporal sampling issues. While MBO collects continuous hourly measurements, the ESRL network collects instantaneous flask samples about 4–5 times per month.
Mid-tropospheric monthly mean TES and MOPITT CO retrievals averaged over the 20
entire Northern Hemisphere (NH) are also shown in Fig. 9. Similar patterns of decline in CO (though slightly lower in magnitude) are seen over the entire hemisphere as was seen over the Northeast Pacific (Fig. 3). As might be expected, the changes are more nuanced when averaging spatially over the entire NH and accounting for the lower temporal resolution of satellite data, but there is still evidence of some large-scale 25
ACPD
8, 16335–16379, 2008Interannual variability of long-range transport at MBO
D. R. Reidmiller et al.
Title Page
Abstract Introduction
Conclusions References
Tables Figures
◭ ◮
◭ ◮
Back Close
Full Screen / Esc
Printer-friendly Version
Interactive Discussion
7 Potential changes in CO emissions: the role of wildfires
The results presented in the previous section, coupled with findings from the GEOS-Chem simulations using constant, climatological emissions, all seem to indicate that more than just year-to-year trans-Pacific transport variability caused the observed in-terannual change in CO. The episodic nature and large inin-terannual variability of CO 5
emissions from wildfires appears to be the most likely non-meteorological cause. There have been several studies into the impacts of wildfires on tropospheric compo-sition for the period of interest in this study (van der Werf et al., 2006; Stohl et al., 2007; LePage et al., 2008; Tansey et al., 2008). Tansey et al. (2008) develop and validate a 1 km2burnt area product for 2000–2007 using SPOT4 VEGETATION reflectance data. 10
The authors found a steady decline in global burnt area from early 2002 through early 2006. More relevant perhaps are the results from Yurganov et al. (2008). Using total column CO retrievals from MOPITT, the authors estimate CO burden anomalies refer-enced to mean March 2000–February 2002 values over selected regions. The reader is referred to Yurganov et al. (2008) for a more detailed description of the methodol-15
ogy employed to calculate these regional CO burden anomalies. Figure 10 illustrates MOPITT-derived CO burden anomalies (courtesy of L. Yurganov, 2008) for three re-gions of interest to this study:
1. India and Thailand (10◦–30◦N, 70◦–110◦E),
2. Indonesia, Malaysia and New Guinea (10◦S–5◦N, 95◦–145◦E),and 20
3. China (25◦–40◦N, 105◦–120◦E).
The significantly higher magnitude of CO burden anomalies in the non-China regions signify the large interannual variations due to biomass burning in those regions. Con-versely, the total column CO burden anomaly over China is much less variable year-to-year as it is dominated by consistent anthropogenic emissions. The CO burden 25
ACPD
8, 16335–16379, 2008Interannual variability of long-range transport at MBO
D. R. Reidmiller et al.
Title Page
Abstract Introduction
Conclusions References
Tables Figures
◭ ◮
◭ ◮
Back Close
Full Screen / Esc
Printer-friendly Version
Interactive Discussion
biomass burning. The winter 2004 burden anomaly is important in terms of pollution transport because CO emitted during winter tends to be longer-lived due to decreased OH mixing ratios (Holloway et al., 2000).
Corroborating this finding are results from the Naval Research Laboratory’s global aerosol model (NAAPS, http://www.nrlmry.navy.mil/aerosol web/Docs/globaer model. 5
html), as presented in Fig. 11. Figure 11a–c illustrates an example of the influence emissions from fires in Southeast Asia had in the Northeast Pacific. Figure 11 shows a timeseries of modeled total aerosol optical depth (AOD) and depicts transport of biomass burning emissions originating in Southeast Asia to the Northeast Pacific from 00:00 UTC on 12 April–00:00 UTC on 17 April 2005. Figure 11d–f represents the same 10
timeseries but for AOD attributable to smoke aerosols. The red arrows highlight the transport pathway to the Northeast Pacific via strong southwesterly flow. The transport time from source to receptor is only about 5 days, significantly shorter than typical trans-Pacific transport times (Akimoto et al., 1996; Jaffe et al., 1999, 2003; Liang et al., 2004). According to the NAAPS model, such transport pathways are common 15
throughout April 2005. Intense biomass burning in Southeast Asia can lead to high smoke injection heights associated with convectively lofted plumes (Kahn et al., 2007, 2008). These plumes can then be transported rapidly via high winds in the mid- to upper-troposphere along sloping isentropes where they ultimately subside over the western US. These results are the most convincing evidence that interannual wildfire 20
variability, particularly the unusually strong fires in Southeast Asia during winter 2004 and spring 2005 drove the regional and NH interannual changes in CO presented here.
8 Conclusions and summary
We observe significant interannual variability in trans-Pacific transport of Asian pollu-tion to western North America between spring 2005 and spring 2006. Ground-based 25
partic-ACPD
8, 16335–16379, 2008Interannual variability of long-range transport at MBO
D. R. Reidmiller et al.
Title Page
Abstract Introduction
Conclusions References
Tables Figures
◭ ◮
◭ ◮
Back Close
Full Screen / Esc
Printer-friendly Version
Interactive Discussion
ularly for March. Results from aircraft measurements during the INTEX-B campaign (Swartzendruber et al., 2008) and the GEOS-Chem model (Zhang et al., 2008) show that the decline in CO from 2005 to 2006 was due, at least in part, to a lower frequency of Asian LRT events reaching into the lower free troposphere over the Northeast Pa-cific. In contrast, elevated levels of O3, RGM andσspin May 2006 vs. May 2005 indicate 5
more long-range transport of aerosols (i.e., Asian dust as Fischer et al., 20082, show) during this time.
Results from ground site measurements and satellite observations beyond the North-east Pacific also illustrate declines in lower- to mid-tropospheric CO levels from 2005 to 2006 (though smaller in magnitude than the changes observed at MBO). Regional total 10
column CO burden anomalies from MOPITT satellite retrievals (Yurganov et al., 2008) and transport pathways elucidated from the NAAPS global aerosol transport model confirm that unusually strong fires in Southeast Asia played a large role in enhancing CO over the Northeast Pacific and western US in spring 2005, particularly in April. Taken together, the results presented suggest that a combination of varying
15
1. wildfire frequency, intensity and location and
2. transport pathways
drove the observed interannual changes in CO. We have shown that there can be a high degree of interannual variability in CO. A similar analysis of interannual changes in peroxyacetyl nitrate (PAN) could add further insight into the interannual variability in 20
Asian anthropogenic long-range transport. PAN has both anthropogenic and natural precursors (NOxand VOCs) and at temperatures characteristic of the lower free
tropo-sphere in mid-latitudes it thermally decomposes to yield NO2. As a result, PAN mixing
ratios are very sensitive to transport pathway and elevation. Observations of PAN at MBO were started in 2006. Thus, information on its interannual variability in the free 25
ACPD
8, 16335–16379, 2008Interannual variability of long-range transport at MBO
D. R. Reidmiller et al.
Title Page
Abstract Introduction
Conclusions References
Tables Figures
◭ ◮
◭ ◮
Back Close
Full Screen / Esc
Printer-friendly Version
Interactive Discussion Acknowledgements. This work has been funded in large part by NSF grant ATM-0724327. The
authors also wish to thank Louisa Emmons (NCAR) for providing the MOPITT data; G. Oster-man and M. Luo (NASA – JPL) for providing the TES data; Paul Novelli (NOAA – ESRL) for providing the ESRL CO data; and L. Yurganov (University of Maryland – Baltimore County) for providing the regional total column CO burden anomalies from MOPITT. G. Wolfe acknowl-5
edges support from NASA Earth Systems Science Fellowship NNG-05GP64H.
References
Akimoto, H., Mukai, H., Nishikawa, M., Murano, K., Hatakeyama, S., Liu, C.-M., Buhr, M., Hsu, K. J., Jaffe, D. A., Zhang, L., Honrath, R., Merrill, J. T., and Newell, R. E.: Long-range transport of ozone in the East Asian Pacific rim region, J. Geophys. Res., 101(D1), 1999– 10
2010, 1996.
Akimoto, H.: Global Air Quality and Pollution, Science, 302, 1716–1719, 2003.
Allen, D. J., Kasibhatla, P., Thompson, A. M., Rood, R. B., Doddridge, B. G., Pickering, K. E., Hudson, R. D., and Lin, S.-J.: Transport-induced interannual variability of carbon monoxide determined using a chemistry and transport model, J. Geophys. Res., 101(D22), 28 655– 15
28 669, 1996.
Auvray, M., Bey, I., Llull, E., Schultz, M. G., and Rast, S.: A model investigation of tropo-spheric ozone tendencies in long-range transported pollution plumes, J. Geophys. Res., 112, D05304, doi:10.1029/2006JD007137, 2007.
Beer, R., Glavich, T. A., and Rider, D. M.: Tropospheric Emissions Spectrometer for the Earth 20
Observing System Aura satellite, Appl. Optics, 40, 2356–2367, 2001.
Bertschi, I. B., Jaffe, D. A., Jaegl ´e, L., Price, H. U., and Dennison, J. B.: PHOBEA/ITCT 2002 airborne observations of trans-Pacific transport of ozone, CO, VOCs and aerosols to the northeast Pacific: impacts of Asian anthropogenic and Siberian boreal fire emissions, J. Geophys. Res., 109, D23S12, doi:10.1029/2003JD004328, 2004.
25
Bertschi, I. B. and Jaffe, D. A.: Long-Range transport of ozone, carbon monoxide and aerosols to the NE Pacific Troposphere during the summer of 2003: observations of smoke plumes from Asian Boreal fires, J. Geophys. Res., 110, D05303, doi:10.1029/2004JD005135, 2005. Bey, I., Jacob, D. J., Yantosca, R. M., Logan, J. A., Field, B. D., Fiore, A. M., Li, Q., Liu, H.,
ACPD
8, 16335–16379, 2008Interannual variability of long-range transport at MBO
D. R. Reidmiller et al.
Title Page
Abstract Introduction
Conclusions References
Tables Figures
◭ ◮
◭ ◮
Back Close
Full Screen / Esc
Printer-friendly Version
Interactive Discussion
meteorology: Model description and evaluation, J. Geophys. Res., 106(D19), 23 073–23 095, 2001.
Brasseur, G. P., Hauglustaine, D. A., Walters, S., Rasch, P. J., Muller, J.-F., Granier, C., and Tie, X. X.: MOZART: A global chemical transport model for ozone and related chemical tracers – Part 1: Model description, J. Geophys. Res., 103(D21), 28 256–28 289, 1998.
5
Deeter, M. N., Emmons, L. K., Francis, G. L., Edwards, D. P., Gille, J. C., Warner, J. X., Khattatov, B., Ziskin, D., Lamarque, J.-F., Ho, S.-P., Yudin, V., Atti ´e, J.-L., Packman, D., Chen, J., Mao, D., and Drummond, J. R.: Operational carbon monoxide retrieval algo-rithm and selected results from the MOPITT instrument, J. Geophys. Res., 108(D14), 4399, doi:10.1029/2002JD003186, 2003.
10
Deeter, M. N., Edwards, D. P., Gille, J. C., and Drummond, J. R.: Sensitivity of MOPITT ob-servations to carbon monoxide in the lower troposphere, J. Geophys. Res., 112, D24306, doi:10.1029/2007JD008929, 2007.
Draxler, R. R. and Rolph, G. D.: HYSPLIT (HYbrid Single-Particle Lagrangian Integrated Tra-jectory) Model access via NOAA ARL READY web site, NOAA Air Resources Laboratory, Sil-15
ver Spring, MD, available at: http://www.arl.noaa.gov/ready/hysplit4.html, last access: May 2008.
Drummond, J. R. and Mand, G. S.: The Measurement of Pollution in the Troposphere (MOPITT) instrument: Overall performance and calibration requirements, J. Atmos. Oceanic Technol., 13, 314–320, 1996.
20
Duncan, B. N., Martin, R. V., Staudt, A. C., Yevich, R., and Logan, J. A.: Interannual and seasonal variability of biomass burning emissions constrained by satellite observations, J. Geophys. Res., 108(D2), 4100, doi:10.1029/2002JD002378, 2003.
Edwards, D. P., P ´etron, G., Novelli, P. C., Emmons, L. K., Gille, J. C., and Drum-mond, J. P.: Southern Hemisphere carbon monoxide interannual variability observed by 25
Terra/Measurement of Pollution in the Troposphere (MOPITT), J. Geophys. Res., 111, D16303, doi:10.1029/2006JD007079, 2006.
Emmons, L. K., Deeter, M. N., Gille, J. C., Edwards, D. P., Att´ıe, J.-L., Warner, J., Ziskin, D., Francis, G., Khattatov, B., Yudin, V., Lamarque, J.-F., Ho, S.-P., Mao, D., Chen, J. S., Drum-mond, J., Novelli, P., Sasche, G., Coffey, M. T., Hannigan, J. W., Gerbig, C., Kawakami, S., 30
ACPD
8, 16335–16379, 2008Interannual variability of long-range transport at MBO
D. R. Reidmiller et al.
Title Page
Abstract Introduction
Conclusions References
Tables Figures
◭ ◮
◭ ◮
Back Close
Full Screen / Esc
Printer-friendly Version
Interactive Discussion
Emmons, L. K., Pfister, G. G., Edwards, D. P., Gille, J. C., Sachse, G., Blake, D., Wofsy, S., Gerbig, C., Matross, D., and N ´ed ´elec, P.: Measurements of Pollution in the Troposphere (MOPITT) validation exercises during summer 2004 field campaigns over North America, J. Geophys. Res., 112, D12S02, doi:10.1029/2006JD007833, 2007.
Goldstein, A. H., Millet, D. B., McKay, M., Jaegl ´e, L., Horowitz, L., Cooper, O., Hudman, 5
R., Jacob, D. J., Oltmans, S., and Clarke, A.: Impact of Asian emissions on obser-vations at Trinidad Head, California during ITCT 2K2, J. Geophys. Res., 109, D23S17, doi:10.1029/2003JD004406, 2004.
Granier, C., M ¨uller, J.-F., Madronich, S., and Brasseur, G. P.: Possible causes for the 1990– 1993 decrease in the global tropospheric CO abundances: A three-dimensional sensitivity 10
study. Atmos. Environ., 30, 1673–1682, 1996.
Hemispheric Transport of Air Pollution (HTAP): Interim Report, United Nations Press, New York City, USA, 165 pp., 2007.
Holloway, T., Levy, H., and Kasibhatla, P.: Global distribution of carbon monoxide, J. Geophys. Res., 105(D10), 12 123–12 147, 2000.
15
Holzer, M. and Hall, T. M.: Low-level transpacific transport., J. Geophys. Res., 112, D09103, doi:10.1029/2006JD007828, 2007.
Irie, H., Sudo, K., Akimoto, H., Richter, A., Burrows, J. P., Wagner, T., Wenig, M., Beirle, S., Kondo, Y., Sinyakov, V. P., and Goutail, F.: Evaluation of long-term tropospheric NO2 data obtained by GOME over East Asia in 1996–2002, Geophys. Res. Lett., 32(11), L11810, 20
doi:10.1029/2005GL022770, 2005.
Jaffe, D., Anderson, T., Covert, D., Kotchenruther, R., Trost, B., Danielson, J., Simpson, W., Berntsen, T., Karlsdottir, S., Blake, D., Harris, J., Carmichael, G., and Uno, I.: Transport of Asian air pollution to North America, Geophys. Res. Lett., 26(6), 711–714, 1999.
Jaffe, D., Anderson, T., Covert, D., Trost, B., Danielson, J., Simpson, W., Blake, D., Harris, J., 25
and Streets, D.: Observations of ozone and related species in the northeast Pacific during the PHOBEA campaigns – 1: Ground-based observations at Cheeka Peak, J. Geophys. Res., 106(D7), 7449–7461, 2001.
Jaffe D., McKendry, I., Anderson, T., and Price, H.: Six “new” episodes of trans-Pacific transport of air pollutants, Atmos. Environ., 37, 391–404, 2003.
30
ACPD
8, 16335–16379, 2008Interannual variability of long-range transport at MBO
D. R. Reidmiller et al.
Title Page
Abstract Introduction
Conclusions References
Tables Figures
◭ ◮
◭ ◮
Back Close
Full Screen / Esc
Printer-friendly Version
Interactive Discussion
doi:10.1029/2004GL020093, 2004.
Jaffe, D., Prestbo, E., Swartzendruber, P., Weiss-Penzias, P., Kato, S., Takami, A., Hatakeyama, S., and Kajii, Y.: Export of atmospheric mercury from Asia, Atmos. Environ., 39, 3029–3038, 2005.
Jaffe, D. and Ray, J.: Increase in surface ozone at rural sites in the western US, Atmos. Environ., 5
41, 5452–5463, 2007.
Kahn, R. A. Li,, W.-H., Moroney, C., Diner, D. J., Martonchik, J. V., and Fishbein, E.: Aerosol source plume physical characteristics from space-based multiangle imaging, J. Geophys. Res., 112, D11205, doi:10.1029/2006JD007647, 2007.
Kahn, R. A., Chen, Y., Nelson, D. L., Leung, F.-Y., Li, Q., Diner, D. J., and Logan, J. A.: Wildfire 10
smoke injection heights: Two perspectives from space, Geophys. Res. Lett., 35, L04809, doi:10.1029/2007GL032165, 2008.
Khalil, M. A. K. and Rasmussen, R. A.: Carbon monoxide in the Earth’s atmosphere: indications of a global increase, Nature, 332, 242–244, 1988.
Khalil, M. A. K. and Rasmussen, R. A.: Global decrease in atmospheric carbon monoxide 15
concentration, Nature, 370, 639–641, 1994.
Kulawik, S. S., Worden, J., Eldering, A., Bowman, K., Gunson, M., Osterman, G. B., Zhang, L., Clough, S. A., Shephard, M. W., and Beer, R.: Implementation of cloud retrievals for Tropospheric Emissions Spectrometer (TES) atmospheric retrievals – 1: Description and characterization of errors on trace gas retrievals, J. Geophys. Res., 111, D24204, 20
doi:10.1029/2005JD006733, 2006.
LePage, Y., Pereira, J. M. C., Trigo, R., da Camara, C., Oom, D., and Mota, B.: Global fire activity patterns (1996–2006) and climatic influence: an analysis using the World Fire Atlas, Atmos. Chem. Phys., 8, 1911–1924, 2008,
http://www.atmos-chem-phys.net/8/1911/2008/. 25
Liang, Q., Jaegl ´e, L., Jaffe, D. A., Weiss-Penzias, P., Heckman, A., and Snow, J. A.: Long-range transport of Asian pollution to the northeast Pacific: Seasonal variations and transport pathways of carbon monoxide, J. Geophys. Res., 109, D23S07, doi:10.1029/2003JD004402, 2004.
Liang, Q., Jaegl ´e, L., and Wallace, J. M.: Meteorological indices for Asian outflow and 30
transpacific transport on daily to interannual timescales, J. Geophys. Res., 110, D18308, doi:10.1029/2005JD005788, 2005.