Rot and
BnaC.IGMT5.a
as a Candidate Gene of the Major
Resistant QTL
SRC6
in
Brassica napus
Jian Wu, Guangqin Cai, Jiangying Tu, Lixia Li, Sheng Liu, Xinping Luo, Lipeng Zhou, Chuchuan Fan, Yongming Zhou*
National Key Laboratory of Crop Genetic Improvement, Huazhong Agricultural University, Wuhan, China
Abstract
Stem rot caused bySclerotinia sclerotiorumin many important dicotyledonous crops, including oilseed rape (Brassica napus), is one of the most devastating fungal diseases and imposes huge yield loss each year worldwide. Currently, breeding for
Sclerotiniaresistance inB. napus, as in other crops, can only rely on germplasms with quantitative resistance genes. Thus, the identification of quantitative trait locus (QTL) forS. sclerotiorum resistance/tolerance in this crop holds immediate promise for the genetic improvement of the disease resistance. In this study, ten QTLs for stem resistance (SR) at the mature plant stage and three QTLs for leaf resistance (LR) at the seedling stage in multiple environments were mapped on nine linkage groups (LGs) of a whole genome map forB. napusconstructed with SSR markers. Two major QTLs,LRA9on LG A9 andSRC6on LG C6, were repeatedly detected across all environments and explained 8.54–15.86% and 29.01%–32.61% of the phenotypic variations, respectively. Genotypes containing resistantSRC6orLRA9allele showed a significant reduction in disease lesion after pathogen infection. Comparative mapping with Arabidopsis and data mining from previous gene profiling experiments identified that the Arabidopsis homologous gene ofIGMT5(At1g76790) was related to theSRC6locus. Four copies of theIGMT5gene inB. napuswere isolated through homologous cloning, among which, onlyBnaC.IGMT5.a
showed a polymorphism between parental lines and can be associated with theSRC6. Furthermore, two parental lines exhibited a differential expression pattern of theBnaC.IGMT5.agene in responding to pathogen inoculation. Thus, our data suggested thatBnaC.IGMT5.awas very likely a candidate gene of this major resistance QTL.
Citation:Wu J, Cai G, Tu J, Li L, Liu S, et al. (2013) Identification of QTLs for Resistance to Sclerotinia Stem Rot andBnaC.IGMT5.aas a Candidate Gene of the Major Resistant QTLSRC6inBrassica napus. PLoS ONE 8(7): e67740. doi:10.1371/journal.pone.0067740
Editor:Jinfa Zhang, New Mexico State University, United States of America ReceivedJanuary 23, 2013;AcceptedMay 22, 2013;PublishedJuly 2, 2013
Copyright:ß2013 Wu et al. This is an open-access article distributed under the terms of the Creative Commons Attribution License, which permits unrestricted use, distribution, and reproduction in any medium, provided the original author and source are credited.
Funding:The work was supported by the funding from Ministry of Science and Technology of China (Grant nos. 2006CB101604, 2011AA10A104, and 2012AA101107), Ministry of Agriculture of China (nycytx-00503), and Huazhong Agricultural University (STSIF 2012YB14). The funders had no role in study design, data collection and analysis, decision to publish, or preparation of the manuscript.
Competing Interests:The authors have declared that no competing interests exist.
* E-mail: ymzhou@mail.hzau.edu.cn
Introduction
Sclerotinia sclerotiorum(Lib.) de Bary is a necrotrophic and non-host-specific fungal pathogen that infects more than 400 plant species, including several important oil crops such as oilseed rape, soybean and sunflower [1,2]. Stem rot in oilseed rape (Brassica napus) caused by S. sclerotiorum is one of the most devastating diseases for the important crop worldwide. It imposes, for example, 10–20% of yield losses every year, and up to 80% in severely infected fields in China [3], one of the largest rapeseed producers in the world (FAOSTAT data 2011, http://faostat.fao. org/site/567/default.aspx#ancor). In addition to severe seed yield damage, the disease also causes reduction of oil content and changes in fatty acid profile, thus resulting in inferior quality in rapeseeds [4].
The stem rot fungus produces sclerotia, which is a long-lived melanized resting structure [5]. Sclerotia geminate under favor-able conditions through either formation of apothecia that release ascospores, or of mycelia that generate hyphae. This life cycle pattern, together with its wide host range, makes Sclerotinia stem rot in oilseed rape difficult to manage through cultural practices. Although several fungicides are available for the control of the
disease, it is difficult to pinpoint the optimal time to apply these fungicides, thus often resulting in ineffective sprays [6]. Further-more, the use of fungicides may cause environmental contamina-tions and increases farming costs. Therefore, breeding and cultivation of resistant varieties is the most efficient, economic and environment-friendly approach to the controlling of Scler-otinia stem rot. However, breeding ofSclerotinia-resistant varieties is confronted with two major difficulties at present. First, no immune or highly resistant germplasm in B. napus and its close relatives has been reported so far [7,8]. Second, the molecular mechanism of the interaction of pathogenic infection and resistance reaction in host plants is poorly understood [5].
mainly controlled by quantitative genes with additive effects [11– 14]. In recent years, mapping of the quantitative trait locus (QTL) for resistance to S. sclerotiorum has been conducted in B. napus. Three QTLs (located on the linkage group (LG) 3, LG12 and LG17, respectively) involved in leaf resistance at the seedling stage and three different QTLs (LG7, LG10 and LG15) for stem resistance at the mature plant stage in an F2:3 population were identified, and no common QTL was associated with both measures in leaves and stems [15]. Using two doubled haploid (DH) populations (HUA and MS), Zhao et al. (2006) mapped eight QTLs (located on N2, N3, N5, N12, N14, N16 and N19) and one (N3) for the resistance to S. sclerotiorum [8]. Yin et al. (2010) identified ten, one and ten QTLs corresponding to three different inoculation methods in a DH population consisting of 72 lines [7]. So far, all the QTLs identified forSclerotinia resistance only explained a small portion of the phenotypic variation. Few QTLs could be detected repeatedly in different populations, environments or with inoculation methods.
Gene expression changes associated withS. sclerotioruminfection have been investigated using microarray with different inoculation tissues including leaf [16], petiole [17] and stem [18]. These studies have revealed that several subsets of genes were differen-tially regulated after infection, such as defense-related genes, phytohormone-responsive genes, transcription factors, as well as genes involved in secondary metabolism and cell wall structure [17,18]. A large part of these genes exhibits temporal and quantitative differences between resistant genotypes and suscep-tible ones [17,18]. However, the relationships of the identified QTLs and the genes responding to pathogen inoculation in gene expression analysis are largely unknown.
With the long-term goal to develop an effective strategy for genetic improvement of the resistance toS. sclerotiorum, the current study was aimed to identify major QTLs for Scleratinia stem rot in B. napus, which can be immediately used in disease resistance breeding. Two widely used disease assay procedures, detached leaf inoculation [15,19] and stem inoculation [15,20] with mycelial agar plugs, were employed to map QTLs for leaf resistance (LR) at the seedling stage and stem resistance (SR) at the mature plant stage in different environments using a DH population. A major QTL (LRA9) for LR and a major QTL (SRC6) for SR were identified. Through comparative mapping, extensive data mining and homologous cloning, we identified BnaC.IGMT5.a as the candidate gene forSRC6.
Materials and Methods
Plant Materials
A DH population consists of 190 individual DH lines named as the HJ-DH population was used for trait analyses and genetic mapping in this study. The population was developed from microspore culture of F1 buds of the cross between B. napus genotypes, Huashuang 5 (Hua 5 thereafter), a cultivar with low Sclerotiniasusceptibility (susceptible parent), and J7005, a pure line with partlySclerotiniaresistance (resistant parent).
Field Experiments
The HJ-DH lines, along with their parental lines, were grown in disease nursery plots located at the experimental farm of Huazhong Agricultural University, Wuhan, China in three consecutive growing seasons from 2009 to 2012. The field trial did not require any specific permits as the nursery was set up for this type study. Experiments for stem resistant assay at the mature plant stage were performed in the seasons of 2009–2010 and 2010–2011, while for leaf resistant assay in 2010–2011 and 2011–
2012. Furthermore, a same set of DH lines was grown for stem resistant assay in the experimental farm of Huanggang Academy of Agricultural Sciences, Huanggang, China in the season of 2010–2011. The field experiment was granted permission by the administrative board of the Huanggang Academy of Agricultural Sciences. Apart from the season of 2009–2010 when 71 lines out of the 190 DH lines were randomly sampled and grown for an initial analysis of stem resistance at the mature plant stage, 190 DH lines were used for all the environments and growing seasons. All the field trials in this study did not involve endangered or protected species.
All the field experiments followed a randomized complete block design with three replications. Each line was planted in one row of 12 plants, with a distance of 21 cm between plants within each row and 30 cm between rows. The field management followed essentially regular breeding practice. Dates to bolting, budding and flowering in the DH population were recorded throughout the whole growth and development period in Wuhan, 2010–2011.
Assessment of Resistance toS. sclerotiorum
An isolate of S. sclerotiorum, SS-1, kindly provided by Dr. Guoqing Li from the State Key Laboratory of Agricultural Microbiology, Huazhong Agricultural University, was maintained and cultured on potato dextrose agar (PDA, 25% potato, 2.5% dextrose and 1.5% agar, pH 5.8). The isolate was maintained at 4uC in darkness, and cultured twice before inoculation at 23uC in darkness. Mycelial agar plug (7 mm in diameter) punched from the margin of a 2-day-old culture ofS. sclerotiorumgrown on PDA were used as the inoculum [15,21].
Two inoculation procedures as described in [15,20] with minor modifications were used for assessing the resistance to S. sclerotiorum. The first one dealt with detached leaves inoculation with mycelial agar plugs in growth room for evaluating leaf resistance (LR) at the seedling stage. The latest or penultimate fully extended leaves with similar size were excised from six- or eight-week old plants grown in the field (November and December of 2010 and 2011). Eight leaves of each DH line were collected and placed in a plastic tray (56 cm638 cm615 cm) with wet-gauze at the bottom of the tray. The mycelial agar plug was inoculated on the middle of each leaf. The inoculated leaves were sprayed with a fine mist of water, and the plastic tray was covered with plastic film to maintain a high level of relative humidity. The plastic trays with inoculated leaves were kept at 2262uC in darkness. The lesion sizes (S) was measured two days post inoculation (dpi) and calculated with the formula S =p6a6b/4, where a and b
represent the long and short diameters of the elliptic-like lesion areas, respectively. This assessment experiment was conducted with three replications for each of the 190 DH lines sown in two growing seasons of 2010–2011 and 2011–2012.
The second procedure was for stem inoculation with mycelial agar plugs, which measured stem resistance (SR) at the mature plant stage. Plants in disease nursery plots were inoculated one week after the termination of flowering, which represents the prevalent stage of Sclerotinia stem rot in natural field conditions. Eight to ten stems of each DH line in each replicate were inoculated with mycelial agar plugs at a height of 50 cm above the ground. Each plug was affixed with plastic wrap to ensure close contact of the inoculums with the stem surface and to maintain humidity. The plants were sprayed with water mist every day after inoculation for three days. The lesion length along the stems was measured at 7 dpi.
Molecular Marker and Linkage Map Construction Genomic DNA was extracted from young leaves of the parental lines and HJ-DH lines with the procedure as described [22].
Simple sequence repeat (SSR) markers were used in linkage map construction. Parts of the SSR markers used in this study have been previously described [23] and some were developed for this study (Table S1). Primers pairs prefixed by BEN, BGO and BGR were developed fromB. napusEST sequences,B. oleraceaand B. rapagenome sequences, respectively.
Linkage analysis with all markers was performed using MAPMAKER 3.0. A minimum log likelihood of the odds (LOD) score of 9.0 and a maximum distance of 30 cM were used to classify loci into linkage groups (LGs). The order within each LG was determined by the commands of order, try, and ripple. Assignment of LGs was based on common marker loci from B. napus mapping populations as described previously [24–28] (http://www.brassica.info/resource/markers/ssr-exchange.php). Genetic distances between loci were calculated using the Kosambi mapping function [29].
QTL Mapping and Statistical Analysis
QTL analysis was performed by composite interval mapping (CIM) [30] using the Windows version of QTL cartographer 2.5 software (http://statgen.ncsu.edu/qtlcart/WQTLCart.htm). For-ward and reverse regression analysis was applied for QTL detection. Cofactors were selected by the program using Model 6 with genetic background controlled by five markers, window size set at 10.0 cM and probability for into and out set at 0.05. Significance thresholds at the 0.05 significance level were estimated on the basis of 1,000 permutations using the procedure as described previously [31]. The confidence interval of QTL was determined by 1-LOD intervals surrounding the QTL peak. QTLs detected in different environments were considered to be the same if they had overlapped confidence intervals.
Epistatic interactions among loci were estimated using QTLNetwork 2 based on a mixed-model approach [32]. The 2D genome scans were conducted with a significance level of p,0.05 based on 1,000 permutations.
The heritability (h2) of LR and SR was calculated ash2=s2g/
(s2g+s2gl/n+s2e/nr), wheres2gis the genotypic variance,s2glis
the variance due to genotype by environment interaction,s2e is
the error variance, n is the number of environments, and r is the number of replications. The estimates of s2g, s2gland s2e were
obtained from an analysis of variance (ANOVA) using the general linear model (GLM) procedure in the SAS software (SAS Institute 2000) with environment considered as a random effect.
Comparative Mapping of Linkage Group C6 with Arabidopsis andB. oleracea
A procedure described by Cai et al. (2012) was used for comparative mapping betweenB. napusand Arabidopsis with SSR markers through B. rapaand B. oleraceagenome sequences [33]. Electronic PCR (e-PCR) [34] was performed to locate the SSR marker primer sequences of LG C6 on the B. oleracea genome (http://www.ocri-genomics.org/bolbase/) and to identify the homologous colinear loci in B. oleracea. The e-PCR amplicons’ sequences inB. oleraceagenome were used as queries in the search by using BLASTn [35] against TAIR10 (http://www.arabidopsis. org/) with an E-value of 1E-10. The positions and gene loci of best-hits in Arabidopsis genome sequences database were collected and comparatively mapped on theB. napus LGs. The conserved Arabidopsis genome blocks were divided and named as described previously [36].
Gene Cloning and Expression Analysis
To identify all putativeIGMT5copies inB. napusgenome, we searched for the sequences homologous to ArabidopsisAtIGMT5 (At1g76790) gene in the databases ofB. rapa (http://brassicadb. org/brad/index.php) and B. oleracea (http://www.ocri-genomics. org/bolbase/). The search was conducted first with the BLASTn program using an E value ,1E-20 and identity and query coverage.80%. All hits from this search were then used to locate the homologous sequences in the NCBI nucleotide collections (http://www.ncbi.nlm.nih.gov) with the same parameters as above. The nonredundant sequences resulted from the hits were then collected and compared with knownAtIGMT5in Arabidop-sis.
Primers were designed to amplify the genomic fragments of ArabidopsisAtIGMT5homologues inB. napusbased on sequence information inB.rapaand B.oleraceagenomes. The PCR products were cloned into pMD18-T vector (Takara Corporation, Japan) according to the manufacturer’s instructions. The M13F and M13R universal primers and the BigDye Terminator Cycle Sequencing v3.1 (Applied Biosystems, Foster City, CA, USA) were used for sequencing. Sequences were aligned using the computer program SEQUENCHER 4.1.2 (Gene Codes Corporation, Ann Arbor, MI, USA).
For gene expression analysis, the main stem of plants for disease challenge was inoculated at three sites (every other internode) at 40–60 cm above the ground with mycelial agar plugs, while mock plants were treated with an agar plugs at three sites only. Epidermal stem tissues extending 10 mm beyond the inoculation site and 1 mm deep were excised at 24, 48, 72 and 96 hours post inoculation (hpi) with a razor blade [18]. Three biological replicates were collected and the tissues harvested from three individual plants (9 inoculation sites in total) were pooled as one biological replicate for each time point. The sampled tissues were immediately frozen in liquid nitrogen and stored at280uC before RNA preparation.
Total RNA was prepared from the sampled tissues with Trizol reagent (Invitrogen, USA). For each sample, 5mg RNA was digested with 1ml of DNase (Thermo, USA) to exclude residuary DNA, and was then used for reverse transcription reaction with TransScript First-Strand cDNA Synthesis Super Mix (TransGen, China). Allele-specific primer pairs of MT5 (59 -CTGGATT-CAGCGTTGGAGTTA-39 and 59 -GTGAACTCAAGATC-CATGAAACT-39), were used to analyze the expression of BnaC.IGMT5.a.
Results
Phenotypic Evaluations
The correlation coefficients across seasons and environments for both the SR and LR assessments were significant (P,0.01; Table S2), indicating that the inoculation procedures were reliable. A two-way ANOVA for LR and SR at two environments with 190 DH lines (The SR assay data from the season of 2009–2010 with 71 DH lines were not included) showed that the differences among the genotypes and environments for LR or SR were highly significant (Table 1). A significant genotype-by-environment interaction was detected for SR, but not for LR (Table 1). The heritability (h2) of the LR and SR was as high as 61.01% and 68.31%, respectively (Table 1), indicating that genetic variance accounted for a large portion of the phenotypic variance of resistance toS. sclerotiorum.
A significant positive correlation (r = 0.18–0.46, p,0.01) between LR and SR was found in most of the environments (Table S2), suggesting that LR evaluated by detached leaf inoculation could be used as an indicator for SR. Observations on three key growth periods (bolting, budding and flowering time) in 2010–2011 growing season showed that there was no significant correlation between the three key growth periods and SR (Table S3), suggesting that the detected SR in the HJ-DH population was
mainly a result of genetic variation among the genotypes rather than disease escape.
Mapping of QTLs forS. sclerotiorumResistance
A total of 272 molecular markers corresponding to 302 SSR loci were mapped onto 19 LGs in the DH population, covering a genetic distance of 1,579 cM with an average interval of 5.2 cM between adjacent markers according to the Kosambi function [29]. The LGs corresponded to the 19 chromosomes ofB. napus including A1–A10 (A genome) and C1–C9 (C genome), as determined by shared SSR markers with public genetic maps in the literature (http://www.brassica.info/resource/maps/lg-assignments.php). All SSR markers were evenly distributed across the whole genome ofB. napuswith 147 and 155 SSR loci on A and C genome, respectively.
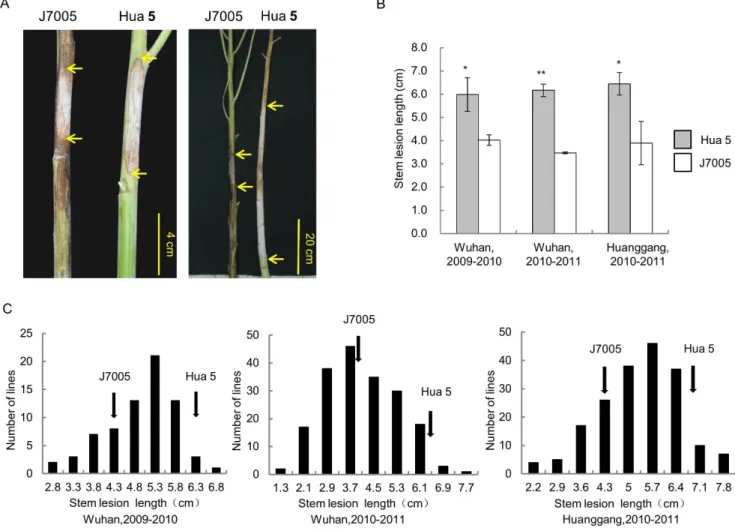
A total of 13 QTLs for LR and SR were identified (Table 2; Fig. 3). Among the QTLs, 3 for LR were mapped on LG A3, A9 and C5, and 10 for SR mapped on 9 LGs (A1, A2, A3, A6, A8, A9, C6, C7 and C8), respectively. Notably, a major QTLLRA9for LR was identified in both growing seasons, which accounted for 15.86% of the trait variation in 2010–2011 and 8.54% in 2011– 2012 (Table 2; Fig. 3). The allele from J7005 at this locus increased Figure 1. Stem resistance (SR) of the two parental lines, Hua 5 and J7005, and the HJ-DH population.(A) Disease lesion on the stem of Hua5 and J7005 at 7 dpi (left panel) and 30 dpi (right panel). Arrows indicate the lesion boundaries on the stem. (B) Lesion length of Hua5 and J7005 at 7 dpi. * and ** indicates a significant difference at P,0.05 and P,0.01 levels, respectively. (C) Frequency distributions of the lesion length in the HJ-DH population in Wuhan, 2009–2010 (left), Wuhan, 2010–2011(middle) and Huanggang, 2010–2011 (right). Arrows indicate the mean lesion length of the parental lines.
doi:10.1371/journal.pone.0067740.g001
the leaf resistance to S. sclerotiorum. The remaining two QTLs (LRA3andLRC5) for LR were detected in only one growing season with their resistant alleles from Hua 5 (Table 2).
A major QTL, SRC6, which explained 29.01%, 30.14%, 32.61% of the phenotypic variation for SR in the three environments, was detected in LG C6 (Table 2; Fig. 3). Moreover, three QTLs (SRA2,SRA9andSRC8a) were detected in two of the three environments, while the remaining six QTLs for SR were detected in only one environment (Table 2; Fig. 3). Seven of the 10 SR QTLs had their resistant alleles from J7005 (the resistant parent), while three others, includingSRC6, from Hua 5.
Two QTLs on LG A3,LRA3andSRA3, both of which had their resistant alleles from Hua 5, had an overlapping confidence interval, whileLRA9 and SRA9 on LG A9 with resistant alleles from J7005 were also located in the same confidence interval (Table 2; Fig. 3). The association of these two regions on LG A3 and LG A9 with resistance at different developmental stages (LR and SR) suggested that common loci or genes might be involved in the resistance at different developmental stages. The mapping results were consistent with the observation that there was a significant positive correlation between LR and SR (Table S2).
No significant epistatic interaction was detected in SR, while an epistatic interaction that showed significant additive-by-additive effect was found in LR. However, the epistatics only explained 2.14% of the phenotypic variation and was between a pair of non-QTL loci, implying that the non-QTLs for resistance toS. sclerotiorum detected in this HJ-DH population may primarily include genes with additive effects.
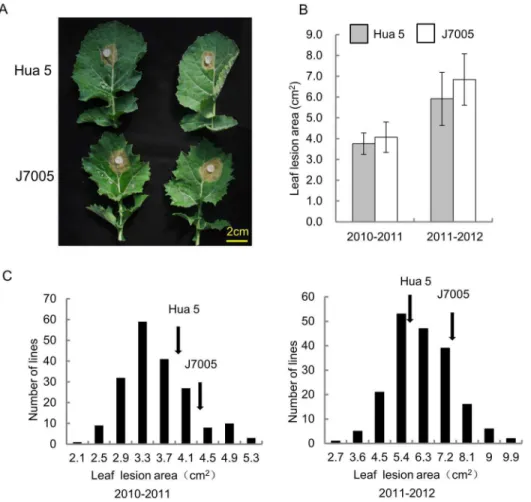
Figure 2. Leaf resistance (LR) of the two parental lines, Hua 5 and J7005, and the HJ-DH population.(A) Disease lesion on the leaf of Hua5 and J7005 at 2 dpi. (B) Lesion area of Hua5 and J7005 at 2 dpi. * and ** indicates a significant difference at P,0.05 and P,0.01 levels, respectively. (C) Frequency distributions of the lesion area in the HJ-DH population in the season of 2010–2011 (left) and in 2011–2012 (right). Arrows indicate the mean lesion size of the parental lines.
doi:10.1371/journal.pone.0067740.g002
Table 1.A two-way ANOVA analysis and broad sense heritability (h2) for stem rot resistance at two developmental stages in the HJ-DH population.
Traits Variation df MS F P h2(%)
LR Replication 2 156.74 64.55 0.0000 61.01
Genotype (G) 189 3.84 1.58 0.0000
Environment (E) 1 1623.50 668.63 0.0000
G6E 189 1.50 0.62 0.9999
Error 758 2.43
SR Replication 2 151.91 87.50 0.0000 68.31
Genotype (G) 189 6.84 3.94 0.0000
Environment (E) 1 515.35 296.84 0.0000
G6E 189 2.17 1.25 0.0230
Error 758 1.74
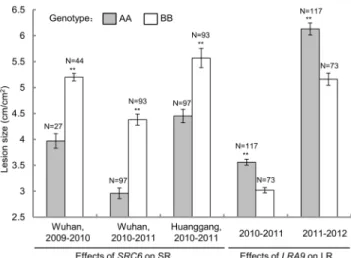
The Effects ofSRC6andLRA9 on Sclerotinia Resistance To examine the effects of the major QTLsSRC6andLRA9on disease resistance, the HJ-DH population was classified into two groups according to the genotypes of closely linked markers (BEN16 and BGR23, Fig. 3). ForSRC6, the average lesion length in the group with the allele from Hua 5 (genotype AA) was significantly shorter than that of J7005 (genotype BB) in all three environments, with the lesion length reduced by 20.1–32.4% at 7 dpi (Fig. 4). ForLRA9, the lesion area of the group containing the allele from J7005 (BB) was significantly smaller than that of AA group, with the lesion area reduced by 15.2–15.8% at 2 dpi (Fig. 4).
Comparative Mapping of C6 Linkage Group with Arabidopsis andB. oleracea
To predict the candidate genes forSRC6, a comparative map of LG C6 with Arabidopsis was constructed based on B. oleracea genome sequences using a previously described procedure [33]. With the SSR markers primers on LG C6, electronic PCR (e-PCR) was performed with the genome sequence ofB. oleraceaused as templates to obtain fragments amplified inB. oleraceagenomes (amplicons). In total, 19 of the SSR loci were aligned to chromosome 7 (BoC7) (Fig. 5). To validate the results of e-PCR, two amplified fragments with SSR markers (BrGMS231C and BEN327) in the confidence interval of SRC6 were cloned and sequenced. The cloned fragment was aligned to Scaffold000076 Figure 3. QTLs for LR and SR mapped on the HJ-DH genetic linkage map.The bar to the left of the LG indicates the 1-LOD confidence interval for the QTL and the triangle indicates the QTL peak position.
doi:10.1371/journal.pone.0067740.g003
and Scaffold000096 on BoC7 of the B. oleracea genome. Comparative analysis revealed that LG C6 was co-linear with BoC7 (Fig. 5), which was consistent with the findings in previous studies [33,37]. By BLASTn analysis against TAIR10 with these e-PCR amplicons’ sequences, 15 and 2 amplicons were matched to homologous loci from Arabidopsis chromosome 1 and 3 (AtC1 and AtC3), respectively (Fig. 5). Three Arabidopsis conserved blocks (D, E and B) were identified to correspond with the confidence interval of SRC6 (19–24.6 cM), and the peak of the SRC6fell in block E (Fig. 5).
Screening of Candidate Genes forSRC6 through Bioinformatic Analysis
In order to further narrow down the candidate genes forSRC6 among the genes located in the mapped region mentioned above, we conducted bioinformatics analysis on genes with significant changes in response to S. sclerotiorumchallenge inBrassicaspecies from public gene profiling databases. In a microarray study, Zhao et al. (2009) investigated gene expression patterns after stem
inoculation with S. sclerotiorum in two B. napus cultivars with different Sclerotinia resistance, ZhongYou 821 and Westar [18]. Among the genes with significant expression changes in Zhon-gYou821 (the resistant cultivar), we noticed that IGMT5, a putative Arabidopsis homologue of At1g76790 in B. napus, was located in the confidence interval ofSRC6(block E). Expression of theIGMT5gene was induced within 6 hour post-inoculation (hpi), and its expression level increased up to 31.1-fold at 72 hpi (Fig. S1), while the same gene in Westar (the susceptible one) did not show any significant change after inoculation [18]. This difference in expression patterns suggested that the gene may be involved in response to S. sclerotiorum infections. Gene annotation based on Arabidopsis genome information showed that IGMTs encodes indole glucosinolate methyltransferase (IGMT), which was similar to caffeic acid O-methyltransferase (COMT) [38].
Identification of theIGMT5Gene inBrassica Species To have a complete understanding of the IGMT5 gene in B. napusand its two progenitor species, we searched for all possible copies ofIGMT5in A-genome (B. rapa) and C-genome (B. oleracea) in databases using ArabidopsisIGMT5gene sequence (At1g76790) as a query. Two copies of theIGMT5 gene were identified inB. rapa and B. oleracea, respectively. The copies of the gene were named BraA.IGMT5.a, BraA.IGMT5.b, BolC.IGMT5.a and Bol-C.IGMT5.b, respectively (Table 3). Both BraA.IGMT5.a and BraA.IGMT5.bwere located on A7 with a distance of 6.6 Mb in B. rapa, while bothBolC.IGMT5.aandBolC.IGMT5.bwere located on C7 with a distance of 30.2 Mb inB. oleracea(Fig. S2).
Based on the sequence information of theIGMT5 genes inB. rapaandB. oleracea, putative genomic fragments of IGMT5inB. napuswere isolated through a homologous cloning strategy from Hua 5 and J7005. Four genomic DNA sequences ofIGMT5were identified after PCR amplification, molecular cloning and sequencing. The cloned fourIGMT5nucleotides inB. napuswere then named BnaA.IGMT5.a, BnaA.IGMT5.b, BnaC.IGMT5.a and BnaC.IGMT5.b, respectively. The four putative genes were located on A7, A7, C6 and C6 chromosome ofB. napus, respectively, based on the synteny ofB. napusand its two progenitor species,B. rapa andB. oleracea(Table 3; Fig. 6A; Fig. S3). Among the four copies of IGMT5inB. napus,BnaA.IGMT5.bhad a 2773 bp deletion at the Table 2.Putative QTLs for LR and SR in the HJ-DH
population.
Traits Location
(Season) QTLa PeakbLOD Ac R2(%)d CI (cM)e
LR Wuhan (2010–2011)
LRA3 151.1 4.96 20.20 7.91 148.7– 151.9
LRA9 37.6 9.29 0.28 15.86 36.2–39.7
Wuhan (2011–2012)
LRA9 37.1 3.81 0.40 8.54 36.2–38.2
LRC5 94.5 3.29 20.37 7.28 89.1–100.8
SR Wuhan (2009–2010)
SRA1 36.7 3.90 0.48 14.33 36–42.1
SRA2 47.6 3.45 0.34 14.11 36.9–54.3
SRA3 147.4 5.77 20.46 19.03 147.2– 149.5
SRA9 41.3 2.96 0.23 6.82 38.3–45.2
SRC6 23.8 10.0620.56 29.01 20.9–24.6
Wuhan (2010–2011)
SRA2 57.9 4.57 0.43 10.36 54.2–62.8
SRA9 37.6 6.25 0.48 13.07 37.1–41.5
SRC6 23.8 19.3820.74 30.14 21.5–24.3
SRC8a 108.5 4.38 0.44 9.95 98.3–114.3
Huanggang (2010–2011)
SRA6 41.3 3.83 0.34 5.44 36.3–44.5
SRA8 21.8 6.95 0.41 8.23 19.4–22.2
SRC6 20.0 22.9320.72 32.61 19–22.3
SRC7 21.2 4.54 20.36 12.16 14.9–24.4
SRC8b 69.1 4.66 0.40 7.02 65.2–73.5
SRC8a 93.8 3.28 0.27 3.43 92.4–120.7
aQTL nomenclature uses the trait name followed by the LG number; an alphabetical letter a or b or c is added if more than one QTL are identified in one LG.
bPeakmap position (cM) of peak LOD scores.
cAadditive effect: positive additivity indicates that the QTL allele originated from the parental line J7005 increase resistance; negative additivity means that the QTL alleles originated from the parental line Hua 5 increase resistance. dR2
proportion for the phenotypic variation explained by the QTL. eCIConfidence intervals were obtained by marking positions
61 LOD from the peak.
doi:10.1371/journal.pone.0067740.t002
Figure 4. Effects of the major QTLSRC6andLRA9on SR and LR. Each group (AA and BB) for the DH population is classified according to the genotype of the makers (BEN327 forSRC6, BGR23 for LRA9) that closely linked to the peaks of the major QTLs. * and ** indicate a significant difference between AA and BB group at P,0.05 and P,0.01 levels, respectively.
first exon and the 59untranslated regions (UTR) compared with BraA.IGMT5.b (Fig. S4). As such, no integrated cDNA of BnaA.IGMT5.b could be amplified, suggesting that it is a pseudogene inB. napus.
Phylogenetic analysis was performed based on the predicted protein sequences ofIGMT5genes identified in this study to reveal the evolutionary relationship among the copies. The three intact IGMT5members fromB. napusand their corresponding counter-parts in two diploid species could be grouped into two clusters (IGMT5.aandIGMT5.b; Fig. 6A). Members belonging to each of the two categories were more distantly related than the members within a same category (Fig. 6A). For example,BnaA.IGMT5.aand BraA.IGMT5.a were more closely related to each other than members from the same species such as BraA.IGMT5.a and BraA.IGMT5.b.
BnaC.IGMT5.a, is Involved in the Defense Reaction againstS. sclerotiorum Infection and a Candidate Gene forSRC6
To establish the relation of the identified IGMT5 gene and SRC6, we compared the sequence differences of all the copies of the gene between the two parental lines. For both of BnaA.IGMT5.a and BnaC.IGMT5.b, there was no sequence difference between Hua 5 and J7005, while the pseudogene, BnaA.IGMT5.b on A7, had 5 single nucleotide polymorphisms (SNPs) between Hua 5 and J7005 (Fig. S3). Due to its psudogene nature, such a difference was not likely to cause a phenotypic variation.
Another copy in LG C6 (BnaC.IGMT5.a) could be amplified as an integrated gene structure in Hua 5, while not be amplified in Figure 5. Comparative map of LG C6 ofB. napuswithB. oleraceaand Arabidopsis.Column A presents the linkage map of LG C6 of the HJ-DH population. The confidence interval ofSRC6is shown in color. Column B is the conserved blocks identified inB. napus, which is labeled according to Schranz et al. [36] and colored differently based on the Arabidopsis (At) chromosome positions defined by Parkin et al. [56]. Column C lists the homologous colinear loci inB. oleraceachromosome 7 (BoC7) corresponding to SSR markers in LG C6. The number designates the physical position in
B. oleraceachromosome with the size of amplification fragments. Column D lists the genes encoding homologous loci inA. thaliana. Column E presents the modified LG C6 after addingBnaC.IGMT5.aon the map.
doi:10.1371/journal.pone.0067740.g005
J7005 even with different primers, suggesting thatBnaC.IGMT5.a in J7005 may have been deleted or inserted with a large fragment. To further test such an inference we developed an allele-specific marker using primer pairs of MT5 (59 -CTGGATTCAGCGTTG-GAGTTA-39and 59-GTGAACTCAAGATCCATGAAACT-39), which were developed based on the genomic sequence and putative CDS ofBnaC.IGMT5.a. Using the HJ-DH population, the gene was mapped between the marker BrGMs231C (correspond-ing to At1g78040) and BnEMS82B (correspond(correspond-ing to At1g74970) (Fig. 5), the confidence interval ofSRC6, which was consistent with the comparative mapping results (Fig. 5).
We then investigated the expression of BnaC.IGMT5.a after inoculation with S. sclerotiorum by RT-PCR analysis with allele-specific primer pairs MT5. The expression of BnaC.IGMT5.ain Hua 5, the donor line of the resistant allele was very low at normal growth conditions (without pathogen inoculation). However, the expression was induced dramatically at 24 hpi compared with mock-inoculated control, and the expression levels continued to increase from 24 hpi to 96 hpi (Fig. 6B). This result was consistent with the microarray data from Zhongyou 821 (Fig. S1). However, we did not detect any expression of the gene in J7005, the parental line lacking the allele under the same condition (Fig. 6B).
The specificity of the allele-specific primer pairs MT5 was further validated with ten most resistant lines and ten most susceptible lines from the HJ-DH population. All the resistant lines had a band representing the BnaC.IGMT5.a gene, while the susceptible lines lacked this copy (Fig. 6C), indicating that the allele contributed to resistance significantly. Furthermore, we analyzed the gene expression ofBnaC.IGMT5.a in ten most resistant lines after inoculation with the pathogen. Compared with mock-inoculated control, all the ten most resistant lines exhibited a significant increase ofBnaC.IGMT5.amRNA (Fig. 6D). However, no such an inducible increase of mRNAs could be detected in ten susceptible lines under the same analytic conditions for gene expression (Fig. 6D).
Taken together, the above data suggest thatBnaC.IGMT5.ais involved in the defense against S. sclerotiorum infection in oilseed rape, and likely the candidate gene forSRC6.
Discussion
Our study indicated that the resistance toS. sclerotiorum in B. napus is a complex quantitative trait and is controlled by minor
polygenes, which is consistent with previous reports [7,8,11–15]. Several other crop species also exhibit such quantitative charac-teristics in defense against S. sclerotiorum, such as soybean [39], common bean [40–42], and sunflower [43–46]. Thus, it is important to identify Sclerotinia-resistance related genes through QTL mapping from the current breeding resources, as the identification of these QTLs and the understanding of the functions and action patterns of the genes for these QTLs provide not only direct gene resources for genetic improvement of Sclerotiniaresistance, but also the knowledge required for develop-ing effective strategies forSclerotiniaresistance breeding.
In the present study, we identified a major QTL,SRC6, which explained 29.01%–32.61% of the phenotypic variation in all three environments (Table 2; Fig. 3). To the best of our knowledge, this is the QTL with the largest genetic effect for resistance to S. sclerotioruminB. napusreported to date. In a previous study, two QTLs on C6, Sll16 and DW16 with overlapping confidence intervals were identified [8].Sll16was detected in three repeated experiments and explained 5.9%–14.9% of the phenotypic variation, while DW16, which was detected in only one experiment, explained 12.8% of the phenotypic variation [8]. It is not clear whether the QTLs on C6 identified in the previous and present studies are the same, as there lack shared markers in these genetic maps. The fact that QTLs for the resistance on C6 can be repeatedly mapped suggests the importance of genetic components fromB. oleracea(C-genome) forS. sclerotiorum. This is also consistent with recent studies which found several QTLs in C-genome [47,48]. Further fine mapping and eventually cloning of SRC6 identified in this research will offer novel information for understanding the resistance mechanism and provide valuable resources forSclerotinia-resistant breeding, since immune or highly resistant germplasms are not available in B. napus and its close relatives.
Currently, progress in QTL cloning in polyploidy crops is still behind that in model plant Arabidopsis and rice due to their complex genome structures. To date, there is no report on a QTL being cloned with map-based cloning procedure in amphidiploid B. napus. The issues pertaining to the quantitative resistance such as the resistance toS. sclerotioruminB. napusare even more complex because one has to deal with large segregation population and the complexity of plants-microbe-environment interactions to accu-rately identify the resistance phenotype in a study for QTL fine mapping. Recently, with the rapid advance in sequencing Table 3.Genome distributions ofIGMT5inB. napus,B. rapaandB. oleracea.
Gene identitya Chrb Accession Source
Forward primer
sequence(59to39) Reverse primer sequence(59to39)
BnaA.IGMT5.a A7c KC768107 This study ATTAGCTTCACCGAGGAGAAAGC CATTACCATGAGACATTACAGCCT
BraA.IGMT5.a A7 Bra015719 BRAD
BnaC.IGMT5.b C6c KC768109 This study ATACTTAGCAATTCGACGCCTAC GTGAACCCAAGAACCATACAACT
BolC.IGMT5.b C7 Bol039840 Bolbase
BnaA.IGMT5.b A7c KC768110 This study GCTATAACATTAGCAACTAGGTACG CTATTTAGAGAACTCAATGACCCAC
BraA.IGMT5.b A7 Bra003707 BRAD
BnaC.IGMT5.a C6c KC768108 This study GGAACCACAAGATGCATCTAGAG AAATGTGAACTCAAGATCCATG
BolC.IGMT5.a C7 Bol027603 Bolbase
aGene nomenclature follows the rules proposed by Østergaard and King [57]. bChr
chromosome. The chromosome locations of theIGMT5genes fromB. rapaandB. oleraceaare based on the sequencing information at BRAD (http://brassicadb. org/brad/index.php) and Bolbase (http://www.ocri-genomics.org/bolbase/).
technology, progress has been made in using primary mapping populations to pinpoint the candidate genes for QTLs. For example, ultra-high-density linkage map was used to improve the power and efficiency of genetic analyses and gene discovery in rice [49–51]. We have developed a procedure to identify candidate genes of QTLs using a SSR-basedB. napusgenetic map through comparative mapping among Arabidopsis andB. napusand its two progenitor speciesB. rapaandB. oleracea[33], which circumvents the difficulty of the lack of complete genome sequences inB. napus. In the present study, we anchored a candidate geneBnaC.IGMT5.a forSRC6by means of this procedure together with data mining of microarray expression with pathogen infection.
Several lines of evidence from our study strongly suggest that BnaC.IGMT5.a may be the candidate gene for SRC6. First, we
confirmed through homologous gene cloning thatBnaC.IGMT5a was the only polymorphic copy among three integratedIGMT5 copies between parents. In the analysis of the mapping population with allele-specific marker developed based on polymorphism, BnaC.IGMT5a was located in the confidence interval of SRC6 (Fig. 5), thus providing genetic evidence forBnaC.IGMT5aas the candidate gene ofSRC6. Our data showed that BnaC. IGMT5.a could be detected as an integrated mRNA coding fragment in Hua 5, the parent with resistance allele, while it could not be amplified in J7005 (Fig. 6C), indicating that the allele may have been deleted or inserted with a great fragment in J7005. Second, expression level ofBnaC.IGMT5.ain Hua 5 increased significantly at 24 hpi compared with mock-inoculated control, and continued to increase from 24 to 96 hpi by RT-PCR analysis at a 24-hour Figure 6. Molecular cloning ofIGMT5genes in threeBrassicaspecies and induced expression ofBnaC.IGMT5.aafter inoculation with Scelrotiniapathogen.(A) Phylogenetic analysis ofIGMT5genes inB. rapa,B. oleraceaandB. napus. Neighbor joining tree is presented based on the deduced amino acid sequences ofIGMT5genes in threeBrassicaspecies. Bootstrap values (1,000 replications) are shown at each branch as a percentage. A branch length scale bar is shown beneath each tree. (B)BnaC.IGMT5.aexpression is induced in Hua 5 after inoculation withSclerotinia
pathogen, but not induced in J7005. RT-PCR analysis was conducted with RNAs from pooled tissues after inoculations at each time point.BnActinwas used as an internal control. (C)BnaC.IGMT5.ais associated with resistant phenotype. PCR products amplified from the copy-specific marker of
BnaC.IGMT5.aare presented. Lane 1–10 are the samples from most resistant lines and lane 11–20 the most susceptible lines from the HJ-DH population. (D) RT-PCR analysis ofBnaC.IGMT5.ain the ten most resistant lines (lane 1–10) and ten most susceptible lines (lane 11–20) at 72 hpi. doi:10.1371/journal.pone.0067740.g006
interval (Fig. 6B). However, there was no detected expression in another parental line of J7500. This gene expression pattern is consistent with the observations in the microarray analysis with resistant cultivar ZhongYou 821 and susceptible Westar [18], in which IGMT5 expression in ZhongYou 821 was enhanced significantly after being inoculated with S. sclerotiorum (Fig. S1) while Westar showed no significant reaction to the inoculation. Third, the availability of BnaC.IGMT5.a allele from Hua 5 was associated with disease performance in lines with most resistant or susceptible phenotype from the HJ-DH population (Fig. 6C). Finally, mRNA analysis showed that the expression of Bna-C.IGMT5.awas obviously induced after inoculation in ten most resistant lines from the population, while the expression was not induced in ten most susceptible lines (Fig. 6D). Taken together, our data and previous studies showed that BnaC.IGMT5.a is involved in the molecular mechanism of oilseed rape defense toS. sclerotiorum, and is likely the candidate gene for SRC6.Given the fact that a large number of disease-resistant QTLs and resistance-related gene expression data are available but have not been fully explored, our strategy in identifying candidate genes for disease-resistant QTL may have wide applications in crop species. It is interesting to note that IGMT5 is a COMT-like gene, which belongs to the gene family involved in the monolignol biosynthetic pathway [38,52]. Monolignol biosynthesis has been shown to be associated with the resistance toS. sclerotioruminCamelina sativa[53] and the resistance to the wilt fungus Verticillium dahliain cotton (Gossypium spp.) [54]. Thus, the molecular mechanism of Bna-C.IGMT5.acontributing to rapeseed defense againstS. sclerotiorum merits further investigation. Further study is needed to verify the molecular functions of BnaC.IGMT5.a in stem rot resistance through more comprehensive investigations including a genetic transformation to validate its function in a susceptible genotype.
In this study,LRA9, a major QTL for LR, was identified across years and explained 8.54–15.86% of the total phenotypic variation (Table 2). There was no QTL identified in A9 for S. sclerotiorum resistance in B. napus in previous studies [7,8,15]. In the same region, we also identified a SR QTL,SRA9. Furthermore, a QTL region on LG A3 was also found to include both LR and SR. The availability of the two QTL regions associated with both LR and SR may indicate that there are some common loci or genes involved in both LR and SR, and thus partly explain the positive correlation between LR and SR (Table S2). The stem rot occurring at mature plant stage is the major cause of yield loss after infection ofS. sclerotiorumin oilseed rape. For that reason, our focus on S. sclerotiorumresistance is to identify SR QTLs mainly using stem inoculation for assessing the resistance, which is time-consuming and labor-costing. Considering the significant positive correlation between LR and SR, the use of detached leaf inoculation at seedling stage for initial screening and stem inoculation method at mature stage for verification can greatly reduce the workload of inoculation at mature stage and will be beneficial for large scale screening of germplasms in disease breeding.
In this study, we used the disease nursery inoculation for phenotypic evaluation on a large mapping population for stem rot resistance in oilseed rape. Such a procedure allows us to identify
the resistant differences among the lines under normal physiolog-ical conditions, which is important for the identification of putative resistant QTLs useful for practical breeding. It has been observed that plant architecture and mature date of oilseed may result in disease escape rather than physiological resistance in field screening experiments [55]. Mei et al. (2012) showed significant negative corrections(r =20.26 to20.39) between flowering time andSclerotiniaresistance inB. oleracea[47]. In the present study, we were able to determine S. sclerotiorum resistance in the DH population had a small correlation with the growth period (Table S3) in the field-growing condition. Therefore, we conclude that resistance segregation in the HJ-DH population was mainly caused by physiological resistance conferred partly by the genetic components identified in this study.
Supporting Information
Figure S1 Expression change ofIGMT5in ZhongYou 821 after S. sclerotioruminfection based on the microarray data in Zhao et al. [18].
(TIF)
Figure S2 The distribution of all copies ofIGMT5in A-genome (B. rapa) and C-genome (B. oleracea).
(TIF)
Figure S3 Alignment of the genomic nucleotide sequences of all copies ofIGMT5between Hua 5 (P1) and J7005 (P2).
(DOCX)
Figure S4 Alignment of the genomic nucleotide sequences of BraA.IGMT5.b and BnaA.IGMT5.b, and the deletion in BnaA.IGMT5.b.
(DOCX)
Table S1 Primer sequences of the newly developed SSR markers in the study.
(DOCX)
Table S2 Correlation coefficients of SR and LR in different environments.
(DOCX)
Table S3 Correlation coefficients of SR and three key growth periods (bolting, budding and flowering time) in Wuhan, 2010– 2011.
(DOCX)
Acknowledgments
The authors thank Dr. Guoqing Li (State Key Laboratory of Agricultural Microbiology, Huazhong Agricultural University) for providing the isolate of S. sclerotiorum, and Zuoxiong Liu (College of Foreign Language, Huazhong Agricultural University) for language editing.
Author Contributions
Conceived and designed the experiments: YZ JW. Performed the experiments: JW GC JT XL LL SL LZ. Analyzed the data: JW GC YZ. Contributed reagents/materials/analysis tools: GC SL CF. Wrote the paper: JW YZ.
References
1. Boland G, Hall R (1994) Index of plant hosts ofSclerotinia sclerotiorum. Can J Plant Pathol 16: 93–108.
2. Purdy LH (1979)Sclerotinia sclerotiorum: history, diseases and symptomatology, host range, geographic distribution, and impact. Phytopathology 69: 875–880. 3. Oilcrop Research Institute, Chinese Academy of Sciences (1975) Sclerotinia
disease of oilseed crops. Beijing: Agriculture Press. 1P.
4. McCartney HA, Doughty KJ, Norton G, Booth EJ, Kightley SPJ, et al. (1999) A study of the effect of disease on seed quality parameters of oilseed rape. Proc 10th Intern Rap Cong, Canberra, Australia.
6. Turkington T, Morrall R (1993) Use of petal infestation to forecast Sclerotinia stem rot of canola: the influence of inoculum variation over the flowering period and canopy density. Phytopathology 83: 682–689.
7. Yin X, Yi B, Chen W, Zhang W, Tu J, et al. (2010) Mapping of QTLs detected in aBrassica napus DH population for resistance to Sclerotinia sclerotiorum in multiple environments. Euphytica 173: 25–35.
8. Zhao J, Udall JA, Quijada PA, Grau CR, Meng J, et al. (2006) Quantitative trait loci for resistance toSclerotinia sclerotiorumand its association with a homeologous non-reciprocal transposition inBrassica napusL. Theor Appl Genet 112: 509– 516.
9. Li Y, Chen J, Bennett R, Kiddle G, Wallsgrove R, et al.(1999) Breeding, inheritance, and biochemical studies on Brassica napus cv. Zhongyou 821: tolerance to Sclerotinia sclerotiorum (stem rot). Proc 10th Intern Rap Cong, Canberra, Australia.
10. Wang H, Liu G, Zheng Y, Wang X, Yang Q (2004) Breeding of theBrassica napusCultivar Zhongshuang 9 with High-resistance toSclerotinia sclerotiorumand dynamics of its important defense enzyme activity. Sci Agric Sin 37: 23–28. 11. Huang Y, Chen J, and Li Y (2000) Genetic studies on resistance (tolerance) to
Sclerotinia sclerotiorumin rapeseed (B. napusL.) I. Genetic nature and analysis of combining abilities of resistance. Chin J Oil Crop Sci 22: 1–5.
12. Li Y, Zhang P, Mu J, and Li D (2001) Study on breeding potential of sclerotinose resistance inBrassica napusL. Acta Bot Boreali-Occidential Sin 21: 451–455. 13. Liu C, Du D, Huang Y, and Wang C (1991) Study on resistance (tolerance) and
genetic effects toSclerotinia sclerotioruminBrassica napus. Scientia Agric Sin 24: 43– 49.
14. Liu S, Zhou B, Zhang J, Guo X, Xu Z, et al. (2003) Inheritance of resistance to Sclerotinia sclerotiorumlesion expansion inB. napusL. Chin J Oil Crop Sci 25: 54– 58.
15. Zhao J, Meng J (2003) Genetic analysis of loci associated with partial resistance toSclerotinia sclerotiorumin rapeseed (Brassica napusL.). Theor Appl Genet 106: 759–764.
16. Yang B, Srivastava S, Deyholos MK, Kav NNV (2007) Transcriptional profiling of canola (Brassica napusL.) responses to the fungal pathogenSclerotinia sclerotiorum. Plant Sci 173: 156–171.
17. Zhao J, Wang J, An L, Doerge R, Chen ZJ, et al. (2007) Analysis of gene expression profiles in response toSclerotinia sclerotioruminBrassica napus. Planta 227: 13–24.
18. Zhao J, Buchwaldt L, Rimmer SR, Sharpe A, McGregor L, et al. (2009) Patterns of differential gene expression inBrassica napuscultivars infected withSclerotinia sclerotiorum. Mol Plant Pathol 10: 635–649.
19. Bradley CA, Henson RA, Porter PM, LeGare DG, del Rı´o LE, et al. (2006) Response of canola cultivars toSclerotinia sclerotiorum in controlled and field environments. Plant Dis 90: 215–219.
20. Yu B, Liu P, Hong D, He Q, Yang G (2010) Improvement ofSclerotiniaresistance of a Polima CMS restorer line of rapeseed via phenotypic selection, marker-assisted background selection and microspore culture. Plant Breeding 129: 39– 44.
21. Godoy G, Steadman JR, Dickman MB, Dam R (1990) Use of mutants to demonstrate the role of oxalic acid in pathogenicity ofSclerotinia sclerotiorumon Phaseolus vulgaris. Physiol Mol Plant Pathol 37: 179–191.
22. Murray MG, Thompson WF (1980) Rapid isolation of high molecular weight plant DNA. Nucleic Acids Res 8: 4321–4325.
23. Fan C, Cai G, Qin J, Li Q, Yang M, et al. (2010) Mapping of quantitative trait loci and development of allele-specific markers for seed weight inBrassica napus. Theor Appl Genet 121: 1289–1301.
24. Cheng X, Xu J, Xia S, Gu J, Yang Y, et al. (2009) Development and genetic mapping of microsatellite markers from genome survey sequences inBrassica napus. Theor Appl Genet 118: 1121–1131.
25. Lowe AJ, Moule C, Trick M, Edwards KJ (2004) Efficient large-scale development of microsatellites for marker and mapping applications inBrassica crop species. Theor Appl Genet 108: 1103–1112.
26. Parkin IAP, Sharpe AG, Keith DJ, Lydiate DJ (1995) Identification of the A and C genomes of amphidiploidBrassica napus(oilseed rape). Genome 38: 1122– 1131.
27. Piquemal J, Cinquin E, Couton F, Rondeau C, Seignoret E, et al. (2005) Construction of an oilseed rape (Brassica napusL.) genetic map with SSR markers. Theor Appl Genet 111: 1514–1523.
28. Qiu D, Morgan C, Shi J, Long Y, Liu J, et al. (2006) A comparative linkage map of oilseed rape and its use for QTL analysis of seed oil and erucic acid content. Theor Appl Genet 114: 67–80.
29. Kosambi DD (1943) The estimation of map distances from recombination values. Ann Hum Genet 12: 172–175.
30. Zeng ZB (1994) Precision mapping of quantitative trait loci. Genetics 136: 1457– 1468.
31. Churchill GA, Doerge RW (1994) Empirical threshold values for quantitative trait mapping. Genetics 138: 963–971.
32. Yang J, Zhu J, Williams RW (2007) Mapping the genetic architecture of complex traits in experimental populations. Bioinformatics 23: 1527–1536. 33. Cai G, Yang Q, Zhao Z, Chen H, Wu J, et al. (2012) Identification of candidate
genes of QTLs for seed weight inBrassica napusthrough comparative mapping among Arabidopsis andBrassicaspecies. BMC Genet 13: 105.
34. Schuler GD (1997) Sequence mapping by electronic PCR. Genome Res 7: 541– 550.
35. Altschul SF, Madden TL, Scha¨ffer AA, Zhang J, Zhang Z, et al. (1997) Gapped BLAST and PSI-BLAST: a new generation of protein database search programs. Nucleic Acids Res 25: 3389–3402.
36. Schranz ME, Lysak MA, Mitchell-Olds T (2006) The ABC’s of comparative genomics in theBrassicaceae: building blocks of crucifer genomes. Trends Plant Sci 11: 535–542.
37. Panjabi P, Jagannath A, Bisht NC, Padmaja KL, Sharma S, et al. (2008) Comparative mapping of Brassica junceaand Arabidopsis thalianausing Intron Polymorphism (IP) markers: homoeologous relationships, diversification and evolution of the A, B and CBrassicagenomes. BMC genomics 9: 113. 38. Raes J, Rohde A, Christensen JH, Van de Peer Y, Boerjan W (2003)
Genome-wide characterization of the lignification toolbox in Arabidopsis. Plant Physiol 133: 1051–1071.
39. Arahana VS, Graef GL, Specht JE, Steadman JR, Eskridge KM (2001) Identification of QTLs for resistance to in soybean. Crop Sci 41: 180–188. 40. Miklas PN, Johnson WC, Delorme R, Gepts P (2001) QTL conditioning
physiological resistance and avoidance to white mold in dry bean. Crop Sci 41: 309–315.
41. Kolkman JM, Kelly JD (2003) QTL conferring resistance and avoidance to white mold in common bean. Crop Sci 43: 539–548.
42. Ender M, Kelly JD (2005) Identification of QTL associated with white mold resistance in common bean. Crop Sci 45: 2482–2490.
43. Mestries E, Gentzbittel L, Tourvieille de Labrouhe D, Nicolas P, Vear F (1998) Analyses of quantitative trait loci associated with resistance to shapeSclerotinia sclerotiorum in sunflowers (Helianthus annuusL.) using molecular markers. Mol Breeding 4: 215–226.
44. Bert PF, Jouan I, de Labrouhe TD, Serre F, Nicolas P, et al. (2002) Comparative genetic analysis of quantitative traits in sunflower (Helianthus annuusL.) 1. QTL involved in resistance toSclerotinia sclerotiorumandDiaporthe helianthi. Theor Appl Genet 105: 985–993.
45. Ronicke S, Hahn V, Vogler A, Friedt W (2005) Quantitative trait loci analysis of resistance toSclerotinia sclerotiorumin sunflower. Phytopathology 95: 834–839. 46. Yue B, Radi SA, Vick BA, Cai X, Tang S, et al. (2008) Identifying quantitative
trait loci for resistance to Sclerotinia head rot in two USDA sunflower germplasms. Phytopathology 98: 926–931.
47. Mei J, Ding Y, Lu K, Wei D, Liu Y, et al. (2012) Identification of genomic regions involved in resistance againstSclerotinia sclerotiorum from wildBrassica oleracea. Theor Appl Genet 126: 549–556.
48. Mei J, Qian L, Disi JO, Yang X, Li Q, et al. (2011) Identification of resistant sources against Sclerotinia sclerotiorum inBrassica species with emphasis on B. oleracea. Euphytica 177: 393–399.
49. Huang X, Feng Q, Qian Q, Zhao Q, Wang L, et al. (2009) High-throughput genotyping by whole-genome resequencing. Genome Res 19: 1068–1076. 50. Xie W, Feng Q, Yu H, Huang X, Zhao Q, et al. (2010) Parent-independent
genotyping for constructing an ultrahigh-density linkage map based on population sequencing. Proc Natl Acad Sci U S A 107: 10578–10583. 51. Yu H, Xie W, Wang J, Xing Y, Xu C, et al. (2011) Gains in QTL detection
using an ultra-high density SNP map based on population sequencing relative to traditional RFLP/SSR markers. PloS One 6: e17595.
52. Rogers LA, Dubos C, Cullis IF, Surman C, Poole M, et al. (2005) Light, the circadian clock, and sugar perception in the control of lignin biosynthesis. J Exp Bot 56: 1651–1663.
53. Eynck C, Se´guin-Swartz G, Clarke WE, Parkin IAP (2012) Monolignol biosynthesis is associated with resistance toSclerotinia sclerotiorum in Camelina sativa. Mol Plant Pathol 13: 887–899.
54. Xu L, Zhu L, Tu L, Liu L, Yuan D, et al. (2011) Lignin metabolism has a central role in the resistance of cotton to the wilt fungusVerticillium dahliaeas revealed by RNA-Seq-dependent transcriptional analysis and histochemistry. J Exp Bot 62: 5607–5621.
55. Phillips DV, Raymer PL, Auld DL (1990) Apparent resistance to stem rot in oil seedBrassica. Phytopathology 80: 1039.
56. Parkin IAP, Gulden SM, Sharpe AG, Lukens L, Trick M, et al. (2005) Segmental structure of theBrassica napusgenome based on comparative analysis withArabidopsis thaliana. Genetics 171: 765–781.
57. Østergaard L, King GJ (2008) Standardized gene nomenclature for theBrassica genus. Plant Methods 4: 10.