Adaptability and stability of corn inbred lines
regarding resistance to gray leaf spot and
northern leaf blight
Belisa Cristina Saito
1*, Leonardo Queiroz Silva
1, João Antonio
da Costa Andrade
1and Major M Goodman
2Abstract: The objectives of this study were to identify resistant and susceptible corn inbred lines based on their stability and adaptability for resistance to disease symptoms of gray leaf spot and northern leaf blight, suggest resistant inbred lines aimed at producing synthetics, and identify the sowing dates with higher occurrence of diseases to use these dates for identification of genetic resistance. We evaluated 41 corn inbred lines in randomized block designs with three replications and 11 sowing dates. Evaluations were performed 30 days after silking. Stability and adaptability analyses were performed by the regres -sion method. The highest severities of disease occurred in sowing from June to September. On average, all the inbred lines were classified as resistant; however, considering adaptability and stability, five inbred lines were found suitable to produce dent synthetics resistant to both diseases. For flint synthetics resistant to both diseases, inbred lines IVF1-7, IVF1-10, 2F, 9F, and 10F are most suitable. Key words:Leaf diseases, disease resistance, synthetic.
Crop Breeding and Applied Biotechnology 18: 148-154, 2018 Brazilian Society of Plant Breeding. Printed in Brazil
http://dx.doi.org/10.1590/1984-70332018v18n2a21
ARTICLE
*Corresponding author:
E-mail: belisasaito@gmail.com
Received: 23 November 2016
Accepted: 30 August 2017
1 Universidade Estadual Paulista, Campus de
Ilha Solteira, Departamento de Biologia e Zootecnia, 15.385-000, Ilha Solteira, SP, Brazil
2 North Carolina State University, Crop Sci-ence, 27.6095-7620, Raleigh, USA INTRODUCTION
Gray leaf spot (Cercospora zeae-maydis Tehon & E.Y. Daniels) and northern
leaf blight (Exserohilum turcicum (Pass.) Leonard & Suggs) are among the leaf
diseases that affect the corn crop in Brazil and worldwide. Genotypes susceptible to these diseases are responsible for severe reduction in grain yield since the direct result of these diseases is decreased photosynthetic area from destruction of the green tissues. A 50% reduction in capturing incident radiation caused by the decrease in green tissue 15 days before and after female flowering may lead to 40% to 50% reduction in grain yield (Fischer and Palmer 1984).
Gray leaf spot was first described in the corn crop in Illinois, United States, in 1925. In Brazil, it was described by Chupp (1953), but the disease became common in 2000, when epidemics were reported in production fields in the
central region of the country, due to the increase in inoculum promoted by crop
Brito et al. (2007) evaluated 12 commercial corn hybrids for incidence of gray leaf spot and showed that the level of damage caused by the pathogen changes according to sowing dates and hybrids. A reduction in grain yield is especially associated with a late sowing date, and the use of resistant hybrids dispenses chemical control. Silva et al. (2012) evaluated two transgenic corn hybrids at two crop densities (78,000 and 100,000 plants per hectare) and concluded that an increase in population density is related to reduction in the severity of gray leaf spot, contributing to an increase in grain yield.
Northern leaf blight appears worldwide and can cause yield losses of more than 60% in susceptible germplasm (Raymundo and Hooker 1981). Disease symptoms appear about a week after infection, characterized by elliptical lesions on leaves, 2.5 to 15 cm in length, with well-defined edges, which become dark because of fructification (Wordell Filho and Casa 2012). Development of northern leaf blight is favored by a temperature from 18 to 27 ºC, with optimum temperature of 20 ºC and the presence of dew on the leaf surface (Sabato et al. 2013). In Brazil, the disease occurs more strongly in the second crop season due to the damage it causes to plants in the female flowering period. According to Fernandes
and Oliveira (2000), the development de E. turcicum is negatively correlated with the photoperiod, light intensity, and
the concentration of sugar in corn. These conditions, as well as possible higher concentration of pathogen inoculum, are most often seen in the second crop season (sowing date in March), which could explain the higher severity of this pathogen at this time.
Many authors describe the inheritance mechanisms associated with northern leaf blight and gray leaf spot. The diseases are mainly controlled using cultivars with quantitative (non-race-specific) and qualitative (race-specific) resistance, and these sources of resistance have been described. However, qualitative resistance is unstable and is easily broken before the emergence of virulent fungi (Welz and Geiger 2000). Quantitative resistance confers partial resistance to both diseases, causing reduction in development of disease and the percentage of affected leaf area. This may result in variation in expression of various components of the lesions, including the incubation period, latent period, intensity of sporulation, size, number, and growth rate (Lehmensiek et al. 2001, Parlevliet 2002, Carson and Goodman 2006, Benson et al. 2015, Hurni et al. 2015).
Interaction between the host and pathogen varies from one environment to another; a significant interaction between genotype and environment may often be observed, which may cause variation in disease severity due to the instability of resistance loci in their interaction with the environment, or differences in pathogen populations among environments (Carson et al. 2002). In this context, the objectives of this study were to identify resistant and susceptible inbred lines
based on their stability and adaptability for resistance to disease symptoms of gray leaf spot and northern leaf blight,
suggest resistant inbred lines aimed at producing synthetics, and identify the sowing dates with the higher occurrence of these two diseases to use these dates for identification of genetic resistance.
MATERIAL AND METHODS
Forty-one inbred lines (fully homozygous) were used, fourteen derived from the Isanão-VF1 population, nine from the Isanão-VD1 population, ten from the Flintisa population, and eight from the Dentado population. The first two populations are brachytic, with flint and dent grains, respectively. The others are of normal height, also with flint and dent grains. The inbred lines were obtained from the corn breeding program of the Universidade Estadual Paulista (UNESP) – Ilha Solteira Campus – SP (Brazil), and had already been selected for general combining ability for yield.
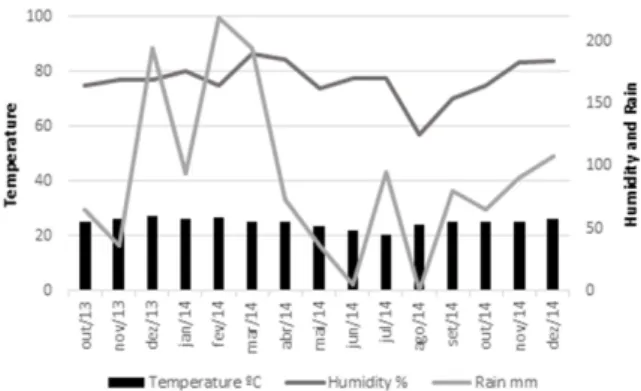
The experiments were conducted at the Teaching, Research, and Extension Farm of UNESP – Ilha Solteira Campus, in Selvíria, Mato Grosso do Sul (MS), Brazil (lat 20° 20’ S, long 51° 23’ W, and altitude of 335 m asl). The climate in the region, according to the Köppen classification, is Aw, defined as tropical humid with a rainy season in the summer and dry season in the winter. Average annual rainfall is 1330 mm, average annual temperature is about 25 °C, and average humidity is 66% (Centurion 1982).
the six-leaf stage. Temperature and relative humidity data were collected from the weather station located near the experiment throughout all the crop seasons (Figure 1).
The inbred lines were evaluated for gray leaf spot
(GLS) and northern leaf blight (NLB) based on natural
infection of the experiments. Evaluations were carried out at 30 days after silking in each of the eleven sowing
seasons, determining disease severity based on the mean percentage of symptoms of the plot, according to the
diagrammatic scale proposed in the ‘Guia Agroceres de Sanidade’ (Agroceres Plant Health Guide) (Agroceres 1996). The ratings assigned values of 1, 2, 3, 4, 5, 6, 7, 8, and 9, corresponding to 0, 1, 10, 20, 30, 40, 60, 80 and > 80 % leaf symptoms, respectively, for each plant plot, using the plot average for statistical analysis. The scores were further
classified into the following disease reaction types: 1 – highly resistant; 2-3 – resistant; 4 – moderately resistant; 5 – moderately resistant/moderately susceptible; 6 – moderately susceptible; 7-8 – susceptible; and 9 – highly susceptible.
The original severity scores were transformed by x + 0.5 , and joint analysis was performed, considering each
month as a sowing season and inbred lines as with fixed effects and environments as random effects. The Hartley test, which is based on the ratio between the largest and smallest mean square error, was employed, considering a ratio higher than seven as an indication that the error variances were not homogeneous (Pimentel Gomes 2000). To assure homogeneity of residual variance, the residual degrees of freedom and the inbred line x environment interaction were adjusted as recommended by Cochran (1954).
For adaptability and stability analysis, the following model, based on regression (Eberhart and Russell 1966), was used: Yij = ϐoi + ϐ1iIj + δij + εij
where ϐoi: overall average of genotype i; ϐ1i: linear response of genotype i for environmental variation; Ij: environmental index (j = 1, 2, …, a), with Ij =
y.j
g ‒ gay ; δij: deviation from regression; and εij: experimental error. Data analysis was
performed using the Genes software, version 2015.5.0 (Cruz 2013).
RESULTS AND DISCUSSION
The F test of combined analysis of variance for GLS was significant (P<0.01) for inbred lines (L), environments (E), and LxE interactions (P<0.01), whereas for NLB, the F test was significant (P<0.01) for environments and LxE interactions (Table 1). As the LxE interaction was significant for each disease studied, adaptability and stability analysis were performed as proposed by Eberhart and Russell (1966).
The severity values for GLS and NLB varied significantly in different months of sowing. Averages and environmental indexes (Ij) for each month (Table 2) showed that in the 2013
sowing dates and January, February, March, and May 2014, there was less GLS pressure. For NLB, the lowest averages were observed in October 2013 and January, February, and March 2014, although the amplitude of variation was low
(1.0 - 2.2). The highest average scores of inbred lines for
severity of both diseases were found for the sowing dates
in August and September 2014.
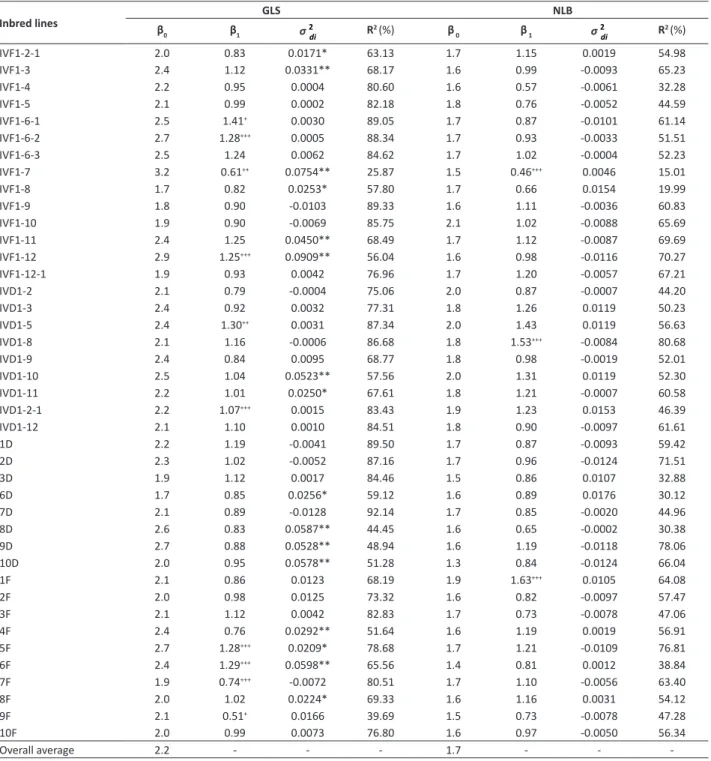
According to the averages (β0), adaptability parameter
(β1), and phenotypic stability (σ
2
di) (Table 3) for severity of
GLS, the inbred lines 7F, 9F, and IVF1-7 exhibited β1<1,
Figure 1. Temperature, humidity and rain in Selvíria - MS, Brazil,
from October 2013 until December 2014.
Table 1. Summary of the joint variance analysis for Gray leaf
spot score (GLS) and Northern leaf blight score (NLB), for 41 corn inbred lines in 11 environments
Sources of variation df GLS df NLB
Inbred lines (L) 40 0.267** 40 0.0723
Environments (E) 10 9.900** 10 2.240**
Lx E1 333 0.134** 254 0.084**
Error1 720 0.568 538 0.059
Average 2.2 1.7
CV (%) 14.8 16.7
** Significant by the F test (p ≤ 0.01); df – Degrees of freedom; 1 df adjusted due
indicating a low response to the severity of the disease with improvement in the environments for its manifestation. Genetically, that means a higher concentration of favorable alleles for disease resistance in these inbred lines. The inbred lines IVF1-6-1, IVF1-6-2, IVF1-12, IVD1-2-1, IVD1-5, 5F, and 6F exhibited β1>1, and the severity of the disease increased significantly with an increase in Ij. These inbred lines have a lower concentration of favorable alleles for resistance to disease. For the other inbred lines, the regression coefficient was 1 and the concentration of favorable alleles for disease
resistance is intermediate.
Inbred lines IVD1-8 and 1F responded positively to significantly increase the Ij for NLB, although the severity
averages are low. In cases where the overall mean of the genotypes is low, the regression coefficient of the severity as a function of the environmental indexes is an important tool to allow more efficient discrimination of the genotypes. The inbred line IVF1-7, with a low average (1.5) for NLB and β1<1, was nearly ideal for a resistant genotype, with high allele concentration for resistance. For the other inbred lines, the averages ranged from 0.57 to 1.31 and the regression coefficients were 1.
According to the phenotypic stability parameter for severity of GLS, the inbred lines IVF1-2-1, IVF1-3, IVF1-7, IVF1-8, IVF1-11, IVF1-12, IVD1-10, IVD1-11, 6D, 8D, 9D, 10D, 4F, 5F, 6F, and 8F were considered unstable (σ2
dinon-zero). For the
severity of NLB, all variances of the deviations were less than 0.1 and all lines were considered stable. This condition is interesting because it makes the behavior of greater or lesser resistance of the genotypes more predictable.
Gray leaf spot (GLS) is more severe and damaging in periods with high humidity, caused by the accumulation of water on the leaf surface and temperatures between 22 and 30 ºC (Beckman and Payne 1982). Northern leaf blight (NLB) requires temperatures from 18 to 27 ºC, with an optimum temperature of 20 ºC and the presence of dew on the leaf surface (Sabato et al. 2013). Throughout the period from the first sowing date to the final evaluation, the temperature conditions were favorable for development of GLS and NLB. In the period from July to October 2014 (except August), humidity was below 70%, which is considered less than ideal for development of the two diseases. Nevertheless, the severity of GLS and NLB was most intense then because the experiments were conducted under center pivot irrigation, which ensured the presence of free water on the leaves, providing the right conditions for development of the diseases. Therefore, the low averages for GLS are due to the good level of resistance of inbred lines with selection using same the standard method. Even so, small environmental variations allowed determination that the best times to evaluate resistance to both diseases are sowing dates from June to September, when Ij were positive and high (Table 2).
Through the Eberhart and Russell (1966) methodology, genotypes with ideal resistance would mean an average scale of symptoms around 1, a regression coefficient lower than 1, and no significant regression deviations. Ideally, the disease would not consistently increase along with improvement of the environment for the disease (positive Ij), which occurred with inbred lines IVF1-7 and 9F for GLS and IVF1-7 for NLB. However, IVF1-7 was unstable for GLS, as evidenced by the significance of the variance of the deviations and a low coefficient of determination. The GLS symptoms of inbred lines
Table 2. Environmental averages, range of variation and amplitude of disease for 41 corn inbred lines and environmental indexes (Ij)
in 11 environments for gray leaf spot (GLS) and northern leaf blight (NLB)
Environments GLS NLB
Average Ij Amplitude of disease Average Ij Amplitude of disease
Oct-13 1.1 -0.3725 1.0-2.6 1.6 -0.0458 1.0-2.0
Nov-13 1.3 -0.3011 1.0-2.3 1.9 0.0692 1.0-3.7
Jan-14 1.3 -0.2717 1.0-3.7 1.3 -0.1356 1.0-2.0
Feb-14 1.4 -0.25 1.0-4.3 1.1 -0.2073 1.0-2.0
Mar-14 1.8 -0.1424 1.0-5.0 1.0 -0.2233 1.0-1.7
Apr-14 2.7 0.1559 2.0-3.7 1.8 0.0576 1.0-2.3
May-14 2.0 -0.0534 1.0-4.0 1.7 0.0086 1.0-2.7
Jun-14 3.1 0.262 1.0-6.0 2.0 0.1067 1.0-2.7
Jul-14 3.1 0.2593 2.0-4.7 2.0 0.0821 1.0-3.7
Aug-14 3.6 0.3791 1.5-5.7 2.1 0.1211 1.0-3.5
IVF1-6-1 and IVD1-5 (B1>1) strongly increased with increasing Ij, and these lines may be considered the most susceptible group, which can be used only under low-pressure disease conditions (negative Ij). For NLB, this occurred with IVD1-8 and 1F inbred lines.
Table 3. Adaptability and stability parameters estimated using Eberhart and Russell (1966) method, for severity of gray leaf spot (GLS)
and northern leaf spot (NLB) for 41 corn inbred lines, in 11 environments
Inbred lines β GLS NLB
0 β1 σ
2
di R
2 (%) β
0 β 1 σ
2
di R
2(%)
IVF1-2-1 2.0 0.83 0.0171* 63.13 1.7 1.15 0.0019 54.98
IVF1-3 2.4 1.12 0.0331** 68.17 1.6 0.99 -0.0093 65.23
IVF1-4 2.2 0.95 0.0004 80.60 1.6 0.57 -0.0061 32.28
IVF1-5 2.1 0.99 0.0002 82.18 1.8 0.76 -0.0052 44.59
IVF1-6-1 2.5 1.41+ 0.0030 89.05 1.7 0.87 -0.0101 61.14
IVF1-6-2 2.7 1.28+++ 0.0005 88.34 1.7 0.93 -0.0033 51.51
IVF1-6-3 2.5 1.24 0.0062 84.62 1.7 1.02 -0.0004 52.23
IVF1-7 3.2 0.61++ 0.0754** 25.87 1.5 0.46+++ 0.0046 15.01
IVF1-8 1.7 0.82 0.0253* 57.80 1.7 0.66 0.0154 19.99
IVF1-9 1.8 0.90 -0.0103 89.33 1.6 1.11 -0.0036 60.83
IVF1-10 1.9 0.90 -0.0069 85.75 2.1 1.02 -0.0088 65.69
IVF1-11 2.4 1.25 0.0450** 68.49 1.7 1.12 -0.0087 69.69
IVF1-12 2.9 1.25+++ 0.0909** 56.04 1.6 0.98 -0.0116 70.27
IVF1-12-1 1.9 0.93 0.0042 76.96 1.7 1.20 -0.0057 67.21
IVD1-2 2.1 0.79 -0.0004 75.06 2.0 0.87 -0.0007 44.20
IVD1-3 2.4 0.92 0.0032 77.31 1.8 1.26 0.0119 50.23
IVD1-5 2.4 1.30++ 0.0031 87.34 2.0 1.43 0.0119 56.63
IVD1-8 2.1 1.16 -0.0006 86.68 1.8 1.53+++ -0.0084 80.68
IVD1-9 2.4 0.84 0.0095 68.77 1.8 0.98 -0.0019 52.01
IVD1-10 2.5 1.04 0.0523** 57.56 2.0 1.31 0.0119 52.30
IVD1-11 2.2 1.01 0.0250* 67.61 1.8 1.21 -0.0007 60.58
IVD1-2-1 2.2 1.07+++ 0.0015 83.43 1.9 1.23 0.0153 46.39
IVD1-12 2.1 1.10 0.0010 84.51 1.8 0.90 -0.0097 61.61
1D 2.2 1.19 -0.0041 89.50 1.7 0.87 -0.0093 59.42
2D 2.3 1.02 -0.0052 87.16 1.7 0.96 -0.0124 71.51
3D 1.9 1.12 0.0017 84.46 1.5 0.86 0.0107 32.88
6D 1.7 0.85 0.0256* 59.12 1.6 0.89 0.0176 30.12
7D 2.1 0.89 -0.0128 92.14 1.7 0.85 -0.0020 44.96
8D 2.6 0.83 0.0587** 44.45 1.6 0.65 -0.0002 30.38
9D 2.7 0.88 0.0528** 48.94 1.6 1.19 -0.0118 78.06
10D 2.0 0.95 0.0578** 51.28 1.3 0.84 -0.0124 66.04
1F 2.1 0.86 0.0123 68.19 1.9 1.63+++ 0.0105 64.08
2F 2.0 0.98 0.0125 73.32 1.6 0.82 -0.0097 57.47
3F 2.1 1.12 0.0042 82.83 1.7 0.73 -0.0078 47.06
4F 2.4 0.76 0.0292** 51.64 1.6 1.19 0.0019 56.91
5F 2.7 1.28+++ 0.0209* 78.68 1.7 1.21 -0.0109 76.81
6F 2.4 1.29+++ 0.0598** 65.56 1.4 0.81 0.0012 38.84
7F 1.9 0.74+++ -0.0072 80.51 1.7 1.10 -0.0056 63.40
8F 2.0 1.02 0.0224* 69.33 1.6 1.16 0.0031 54.12
9F 2.1 0.51+ 0.0166 39.69 1.5 0.73 -0.0078 47.28
10F 2.0 0.99 0.0073 76.80 1.6 0.97 -0.0050 56.34
Overall average 2.2 - - - 1.7 - -
-β1:
+, ++, +++ Differs from one, by the t test, at p ≤ 0.01, p ≤ 0.05 and p ≤ 0.10, respectively; σ2
di: *, ** Differs from zero, by the F test, at p ≤ 0.05 and p ≤ 0.01, respectively; β0: Inbred line average;β1: Regression coefficient; σ
2
In a quantitative approach, such as that taken by Moose et al. (2004) for oil and protein content in corn grain, we can
consider that resistance and the type of response to Ij depends on the concentration of alleles for disease resistance in
each genotype, the sensitivity of the encoded product of these alleles to environmental changes, and the sensitivity of regulatory factors involved in expression of these alleles. A higher concentration of favorable alleles initially causes the genotype to resist increased disease pressure (positive Ij), without consistently increasing the scale of symptoms, even under the best conditions for the disease. This effect will be maximized if the regulation of these alleles and the action mechanisms of their products are also uniformly positive, even with a change in environment. If a genotype has a good concentration of alleles for resistance, but they are disabled in the control level or encoded products, their behavior will be unstable, with a high regression coefficient, as may have happened with inbred lines IVF1-6-1 and IVD1-5 for GLS and IVD1-8 and 1F for NLB. For all those unstable GLS inbred lines, one or more such effects may also have occurred.
Another aspect that can generate a low response to Ij and good stability is the presence of a locus with major effect, little influenced by the environment. In another case, a locus of small effect, with alleles to increase or decrease the resistance, would act as modifiers. Ramalho et al. (2012) affirm that modifiers are smaller effect genes, able to alter the expression of other genes with greater effect. This hypothesis of the occurrence of major effect genes is confirmed by various studies with inbred lines from multiple sources that indicate that resistance is qualitatively inherited (locus with major effect) and quantitatively inherited, whereas the additive effect of genes is more important than the non-additive (Ward et al. 1999, Welz and Geiger 2000, Juliatti et al. 2009, Vivek et al. 2010, Brito et al. 2012, Vieira et al. 2012, Abera et al. 2016). Modifiers with major effect have not yet been detected in this group of inbred lines.
The results of this study show that the inbred lines exhibit a high concentration of favorable alleles for resistance to GLS and NLB. Thus, hybrids from these inbred lines will have good resistance, considering the additive action of these genes. If the intention is to produce a synthetic, the conditions for an inbred line to be included are stability, the lowest coefficient (or coefficient of one), and the desired type of grain. If the regression coefficient is equal to one, the average should be between the smaller groups.
The sowing dates most suitable for evaluation of genotypes for genetic resistance were August and September, as they showed the highest environmental indexes for gray leaf spot and northern leaf blight. The inbred lines IVD1-2, IVD1-3, IVD1-9, 2D, and 7D may be used to form a synthetic with dent grains for resistance to these two diseases. For synthetic flint grains, the inbred lines IVF1-7, IVF1-10, 2F, 9F, and 10F can be used for resistance to both diseases.
REFERENCES
Abera W, Hussein S, Derera J, Worku M and Laing M (2016) Heterosis and combining ability of elite maize inbred lines under northern corn leaf blight disease prone environments of the mid-altitude tropics.
Euphytica 208: 391-400.
Agroceres (1996) Guia de sanidade Agroceres. Sementes Agroceres,
São Paulo, 72p.
Beckman PM and Payne GA (1982) Cultural techniques and conditions influencing growth and sporulation of Cercospora zeae-maydis and
lesion development in corn. Phytopathology 73: 286-289.
Benson JM, Poland JA, Benson BM, Stromberg EL and Nelson RJ (2015) Resistance to gray leaf spot of maize: Genetic architecture and mechanisms elucidated through nested association mapping and
near-iisogenic line analysis. PLoS Genetics 11(3): 1-23.
Brito AH de, Davide LMC, Von Pinho RG, Carvalho RP and Reis MC (2012) Genetic control of resistance to gray leaf spot of maize in tropical
germplasm. Crop Breeding and Applied Biotechnology 12: 145-150.
Brito AH, Pinho RG Von, Pozza EA, Pereira JLAR and Filho EMF (2007) Efeito da cercosporiose no rendimento de híbridos comerciais de
milho. Fitopatologia Brasileira 32: 472-479.
Carson ML and Goodman MM (2006) Pathogenicity, aggressiveness, and virulence of three species of Cercospora associated with gray leaf
spot of maize. Maydica 51: 89-92.
Carson ML, Goodman MM and Williamson SM (2002) Variation in aggressiveness among isolates of Cercospora from maize as a potential cause of genotype-environment interaction in gray leaf
spot trials. Plant Disease 86: 1089-1093.
Casela CR and Ferreira AS (2003) A cercosporiose na cultura do milho.
Embrapa Milho e Sorgo, Sete Lagoas, 5p. (Circular Técnica, 24).
Centurion JF (1982) Balanço hídrico da região de Ilha Solteira. Científica
10: 57-61.
Chupp CA (1953) A monograph of the fungus genus Cercospora. The
Roland Press, New York, 667p.
Cochran WG (1954) The combination of estimates from different
experiments. Biometrics 10: 101-129.
Cruz CD (2013) GENES - a software package for analysis in experimental
statistics and quantitative genetics. Acta Scientiarum Agronomy
35: 271-276.
varieties. Crop Sciense 6: 36-40.
Fernandes FT and Oliveira E (2000) Principais doenças na cultura do
milho. Embrapa - CNPMS, Sete Lagoas, 80p.
Fischer KS and Palmer FE (1984) Tropical maize. In Goldsworthy PR and
Fisher NM (eds) The physiology of tropical field crops. J. Wiley &
Sons, New York, p. 231-248.
Hurni S, Scheuermann D, Krattinger SG, Kessel B, Wicker T, Herren G, Fitze MN, Breen J, Presterl T, Ouzunova M and Keller B (2015) The
maize disease resistance gene Htn1 against northern corn leaf blight
encodes a wall-associated receptor-like kinase. Proceedings of the
National Academy of Sciences 112:8780-8785.
Juliatti FC, Pedrosa MG, Silva HD and Silva JVC (2009) Genetic mapping
for resistance to gray leaf spot in maize. Euphytica 169: 227-238.
Lehmensiek A, Esterhuizen AM, Van Staden D, Nelson SW and Retief AE (2001) Genetic mapping of gray leaf spot (GLS) resistance genes in
maize. Theoretical Applied Genetics103: 797-803.
Moose SP, Dudley JW and Rocheford TR (2004) Maize selection passes the
century mark: a unique resource for 21st century genomics. Trends
in Plant Science 9: 358-364.
Parlevliet J (2002) Durability of resistance against fungal, bacterial and
viral pathogens; present situation. Euphytica 124: 147-156.
Pimentel Gomes FP (2000) Curso de estatística experimental. Nobel,
São Paulo, 466p.
Ramalho MAP, Santos JB, Pinto CABP, Souza EA, Gonçalves FMA and Souza
JC (2012) Genética na agropecuária. UFLA, Lavras, 566p.
Raymundo A and Hooker A (1981) Measuring the relationship between
northern corn leaf blight and yield losses. Plant Disease 65: 325-327.
Robertson A, Mueller D, Tylka GL and Munkvold G (2008) Corn diseases.
Iowa State University, Iowa, 40p.
Sabato EO, Pinto NFJA and Fernandes FT (2013) Identificação e controle
de doenças na cultura do milho. Embrapa, Brasília, 198p.
Silva RR, Theodoro GF, Liborio CB and Pessoa LGA (2012) Influência da densidade de cultivo de dois genótipos de milho na severidade da
mancha de cercospora e no rendimento de grãos na safrinha. Semina
Ciências Agrárias 33: 1449-1454.
Vieira RA, Scapim CA, Moterle LM, Moterle LM, Tessmann DJ, Amaral-Jr AT, Gonçalves LSA and Gonçalves LSA (2012) The breeding possibilities and genetic parameters of maize resistance to foliar diseases.
Euphytica 185: 325-336.
Vivek BS, Odongo O, Njuguna J, Imanywoha J, Bigirwa G, Diallo A and Pixley K (2010) Diallel analysis of grain yield and resistance to seven
diseases of 12 African maize (Zea mays L.) inbred lines. Euphytica
172: 329-340.
Ward JMJ, Stromberg EL, Nowell DC and Nutter Junior FW (1999) Gray
leaf spot: A disease of global importance in maize production. Plant
Disease 83: 884-895.
Welz HG and Geiger HH (2000) Genes for resistance to northern corn
leaf blight in diverse maize populations. Plant Breeding 119:1-14.
Wordell Filho JA and Casa RT (2012) Manejo de doenças na cultura do milho. In: Wordell Filho JA, Chiaradia LA and Babinot Junior AA (eds)
Manejo fitossanitário da cultura do milho. Epagri, Florianópolis,
p. 8-73.