The
Drosophila ETV5
Homologue
Ets96B
:
Molecular Link between Obesity and Bipolar
Disorder
Michael J. Williams*, Anica Klockars, Anders Eriksson, Sarah Voisin, Rohit Dnyansagar, Lyle Wiemerslage, Anna Kasagiannis, Mehwish Akram, Sania Kheder, Valerie Ambrosi, Emilie Hallqvist, Robert Fredriksson, Helgi B. Schiöth
Functional Pharmacology, Department of Neuroscience, Uppsala University, Uppsala, Sweden
*Michael.Williams@neuro.uu.se
Abstract
Several reports suggest obesity and bipolar disorder (BD) share some physiological and behavioural similarities. For instance, obese individuals are more impulsive and have heightened reward responsiveness, phenotypes associated with BD, while bipolar patients become obese at a higher rate and earlier age than people without BD; however, the molec-ular mechanisms of such an association remain obscure. Here we demonstrate, using whole transcriptome analysis, thatDrosophila Ets96B, homologue of obesity-linked gene
ETV5, regulates cellular systems associated with obesity and BD. Consistent with a role in obesity and BD, loss of nervous systemEts96Bduring development increases triacylglycer-ide concentration, while inducing a heightened startle-response, as well as increasing hyperactivity and reducing sleep. Of notable interest, mouseEtv5andDrosophila Ets96B
are expressed in dopaminergic-rich regions, and loss ofEts96Bspecifically in dopaminergic neurons recapitulates the metabolic and behavioural phenotypes. Moreover, our data indi-cate Ets96B inhibits dopaminergic-specific neuroprotective systems. Additionally, we reveal that multiple SNPs in humanETV5link to body mass index (BMI) and BD, providing further evidence forETV5as an important and novel molecular intermediate between obesity and BD. We identify a novel molecular link between obesity and bipolar disorder. TheDrosophila ETV5homologueEts96Bregulates the expression of cellular systems with links to obesity and behaviour, including the expression of a conserved endoplasmic reticulum molecular chaperone complex known to be neuroprotective. Finally, a connection between the obe-sity-linked geneETV5and bipolar disorder emphasizes a functional relationship between obesity and BD at the molecular level.
Author Summary
The World Health Organization suggests obesity is a major cause of poor health and is becoming the leading public health concern. Likewise, mood-based disorders, such as bipolar disorder, are one of the top ten causes of disability worldwide. There is evidence
a11111
OPEN ACCESS
Citation:Williams MJ, Klockars A, Eriksson A, Voisin S, Dnyansagar R, Wiemerslage L, et al. (2016) The
Drosophila ETV5HomologueEts96B: Molecular Link between Obesity and Bipolar Disorder. PLoS Genet 12(6): e1006104. doi:10.1371/journal.pgen.1006104
Editor:Bingwei Lu, Stanford University School of
Medicine, UNITED STATES
Received:November 5, 2015
Accepted:May 13, 2016
Published:June 9, 2016
Copyright:© 2016 Williams et al. This is an open access article distributed under the terms of the
Creative Commons Attribution License, which permits unrestricted use, distribution, and reproduction in any medium, provided the original author and source are credited.
Data Availability Statement:All relevant data are within the paper and its Supporting Information files.
Funding:The studies were supported by the Vetenskapsrådet—http://www.vr.se/(RF and HBS), Hjärnfonden—http://www.hjarnfonden.se/(RF and HBS), Åhlen-stoftelsenhttp://www.ahlen-stiftelsen.se/
(RF and HBS), Carl Tryggers Stiftelsen—http://www.
carltryggersstiftelse.se/(MJW), and Stiftelsen Olle Engkvist Byggmästare—http://www.
that obesity and bipolar disorder may be linked and that obesity may exacerbate bipolar disorder symptoms. For the first time, our work evidences a molecular-link between obe-sity and bipolar disorder. In humans the obeobe-sity-linked geneETV5was also associated with bipolar disorder. Using the model organismDrosophila melanogaster(the fruit fly) we show that theETV5homologueEts96Bregulates a series of genes known to be neuro-protective and inhibiting the expression ofEts96in dopaminergic neurons induces pheno-types linked to obesity and bipolar disorder, including increased lipid storage, increased anxiety and reduced sleep. Our work will help to further the understanding of how these to disorders may interact.
Introduction
Clinical studies indicate there may be a link between obesity and bipolar disorder (BD). Obese individuals have greater impulsivity and reward responsiveness—phenotypes associated with BD [1,2], while bipolar patients become obese and have cardiovascular disorders at a higher rate and earlier age than people without BD [3]. Although some studies link obesity and its sequelae to BD medication, a significant number of medication-naïve BD patients also display metabolic syndrome phenotypes [4,5]. Moreover, BD patients have high rates of carbohydrate consumption and low rates of physical exercise [6,7]. Hence, there seem to be several physio-logical and behavioural links between obesity and BD; however, the molecular mechanisms connecting these two diseases are not fully understood.
Ets variant 5 (ETV5, also known as ERM), an E-twenty-six (ETS) transcription factor belonging to the polyoma enhancer activator 3 (PEA3)-subfamily (ETV1,ETV4andETV5), was initially linked to BMI in a GWAS study [8]. Experimental evidence in mice also linksEtv5
to the regulation of metabolic homeostasis;Etv5transcriptional expression is affected by inges-tion of a high-fat/high-sugar diet, as well as food restricinges-tion [9,10]. Moreover,Etv5-/-mice exhibit decreased body weight compared to controls [9,10]. In mouse brain,Etv5is expressed in the arcuate nucleus (ARC), ventro-medial hypothalamus (VMH), substantia nigra (SN), and the ventral tegmental area (VTA) [9]. Expression in the ARC and VTA implies involvement in reward-driven or energy-driven food intake [11]. Interestingly, these same regions regulate impulsivity [12]. Also, the SN is a key regulator of locomotion and disruptions in this region lead to hyperactivity [13].
The endoplasmic reticulum (ER) is involved in the biosynthesis, folding, modification and trafficking of proteins. Apart from this role there is emerging evidence that the ER is centrally involved in sensing metabolic changes within a cell and transmitting this information to the nucleus [14]. Preclinical and clinical studies in the last decade indicate that ER stress, including the unfolded protein response (UPR), has a significant impact on the pathogenesis of obesity [15,16]. Additionally, recent studies suggest an involvement of UPR in the pathophysiology of BD [17,18].
We turned to the genetically tractable model organismDrosophila melanogasterto under-stand more about the molecular mechanism of how the PEA3-family memberETV5may affect body weight and BD. InDrosophilathe PEA3-family is represented by the homologueEts96B. Almost nothing is known aboutEts96B, but it is highly expressed in the central nervous system [19]. We knocked downEts96Bexpression in theDrosophilanervous system and performed SOLiD sequencing of the entire transcriptome, discovering associations to gene networks whose human homologues are connected to body mass index (BMI) and bipolar disorder. Fur-thermore, loss of neuronal Ets96B induced lipid storage defects, hyperactivity, and a
Ets96BRegulates Dopaminergic Signalling
heightened startle-response phenotype. Interestingly, our data indicate that Ets96B works to suppress an ER molecular chaperone system shown to be neuroprotective in dopaminergic neurons [20,21]. Finally, we reveal a human association ofETV5with bipolar disorder.
Results
Ets96B is a member of the PEA3 subfamily
To begin our studies we confirmed thatDrosophilaEts96B was homologous to human ETV5. Using the Maximum-likelihood method, the phylogenetic relationship between theDrosophila
protein Ets96B and vertebrate PEA3-family proteins was determined (Fig 1A). All major verte-brate and inverteverte-brate model organisms, where a PEA3-like protein existed that had an E-value of at least 1.0e-45 when compared to human ETV5, were included. The mammalian ETV2 subgroup was used as an outgroup. From the tree produced it was evident that inverte-brates contained only one PEA3-family member, while the vertebrate family expanded to include three members: ETV1, ETV4, and ETV5. We also searched for PEA3-family homo-logues in the important model organismsS.cerevisaeandD.discoideumby mining the NCBI’s protein database nr using protein PSI-BLAST withDrosophilaEts96B, as well as vertebrate ETV1, ETV4, and ETV5 protein sequences as queries, but no homologous proteins were dis-covered. From this data we conclude thatDrosophila melanogasterEts96B is basally related to the vertebrate PEA3-subfamily of ETS transcription factors.
A multiple sequence alignment was performed comparingDrosophilaEts96B with human PEA3-family proteins (Fig 1B). This alignment demonstrated that the ETS domain at the C-termi-nus, found in all ETS-family proteins, was well conserved (Fig 1B, dark blue underlining). Although some conservation was observed in the N-terminus, the PEA3 domain, present in all mammalian PEA3 family members, was not conserved. In regards to regulatory conservation, mammalian ETV5 is sumoylated on multiple sites, necessary for the inhibition of ETV5 activity [22]. These sumoylation sites were conserved in all human PEA3-family members (Fig 1B, black underlining). Using the Abgent sumoplot (http://www.abgent.com/sumoplot), as well as GPS-Sumo [23], we determined that most of the mammalian sumoylation sites were not conserved in Ets96B. Drosoph-ilaEts96B had a predicted site at lysine 429 (K429) with the sequence LKQD, and a site (K590) possibly conserved with human PEA3-family members, having the sequence GKGD (Fig 1B, light blue underlining). Whether or not these Ets96B sites are actually sumoylated is not known.
Differential gene expression in Ets96B knockdowns
Ets96Bis highly expressed in the nervous system [19], therefore we knocked it down in all neu-ronal cells throughout development, using the pan-neuneu-ronalelav-GAL4driver [24] to express
UAS-Ets96BRNAi1(Ets96BRNAi1) [25], and then performed SOLiD sequence analysis of the entire transcriptome. By mapping theDrosophilatranscriptome to the reference genome obtained from flybase (build dmel_r5.47_FB2012_05), 15147 transcripts were identified, including expressed genes (mRNA), miRNA, snRNA, snoRNA and tRNA (S1 Dataset). The
(P<0.005) (Fig 2A). At this time we also checkedEts96Bexpression levels using a second UAS-Ets96BRNAi line (Ets96BRNAi2) [25], transcript levels were also significantly lower in the heads ofelav-GAL4;UAS-ETS96BRNAi2males (P<0.005) (Fig 2A).
Fig 1. Comparison ofDrosophilaEts96B with mammalian PEA3-family members(A) The evolutionary relationship was inferred using the Maximum-likelihood method. The optimal tree with the sum of branch length = 3.794 is shown. The percentage of replicate trees in which the associated taxa clustered together in the bootstrap test (5000 replicates) are shown next to the branches. The tree is drawn to scale, with branch lengths in the same units as those of the evolutionary distances used to infer the phylogenetic tree. (B) The protein sequences were aligned and edited using CLC Sequence Viewer 6. Colors correspond to amino acid conservation (black = conserved, blue = no
conservation). The predicted ETS DNA binding domain is indicated by a dark blue underlining of amino acids near C-terminus. Human sumoylation sites are indicated by black underlining; predictedDrosophilasumoylation site is indicated by light blue underlining.
doi:10.1371/journal.pgen.1006104.g001
After performing pair-wise comparisons between all sequenced strains, 61 differentially expressed genes remained significant (Table 1). Interestingly, most of these genes were up-reg-ulated whenEts96Bwas knocked down in the CNS, with only 21% being down-regulated. Using DAVID and KEGG, we categorized the differentially expressed genes by function [26,
27]. The largest group was involved in oxidative phosphorylation and redox reactions, with 32.8 percent of the genes falling into this category (Fig 2B). The next largest groups were a tie between genes involved in lipid and sugar homeostasis, as well as those involved in translation,
Fig 2. Ets96Bregulates genes involved in oxidative phosphorylation and redox reactions(A) Relative expression level ofEts96Bin 5–7 day old control males or males whereEts96Bwas knocked down in the entire nervous system throughout development. This assay was repeated at least 7 times. (n = 25 males per treatment;**P<0.005 compared with controls, one-way ANOVA with Tukey’s post hoc test for multiple comparisons). Error bars = SEM. (B) Pie chart showing KEGG classification of gene groups (percentage of total Ets96B up or down regulated genes /percentage of all genes in the genome belonging to a particular category). (C)Drosophilagenome depicting the location of genes up (green) or down (red) regulated in Ets96B SOLiD sequencing of the entireDrosophilatranscriptome.
Table 1. Solid sequencing data for up and down regulated genes inEts96BRNAiversus all controls
Biological Process ID Gene Name Ets96BRNAi Expressed in CNS Human homologue log2 (fold change) according to FlyAtlas
Lipid/sugar homeostasis
FBgn0029831 CG5966 -2,91 Yes PNLIP
FBgn0015575 α-Est7 -0,99 Yes
FBgn0032136 Apoltp -0,65 Yes
FBgn0037312 CG11999 3,36 Yes SDF2
FBgn0036549 CG10516 2,05 Yes SPSB3
FBgn0004654 Pgd 2,03 Yes PGD
FBgn0025885 Inos 1,29 Yes ISYNA1
FBgn0004045 Yp1 1,10 Yes
FBgn0001092 Gapdh2 0,75 Yes GAPDH
Translation
FBgn0028697 RpL15 -0,70 Yes RPL15
FBgn0000556 Ef1α48D -0,59 Yes EEF1A1
FBgn0010409 RpL18A 1,28 Yes RPL18A
FBgn0004404 RpS14b 1,13 Yes RPS14
FBgn0004867 RpS2 0,76 Yes RPS2
FBgn0003279 RpL4 0,66 Yes RPL4
FBgn0036213 RpL10Ab 0,64 Yes RPL10A
FBgn0005593 RpL7 0,63 Yes RPL7
FBgn0000100 RpLP0 0,58 Yes RPLP0
Amino acid metabolism
FBgn0037146 CG7470 -1,51 Yes ALDH18A1
FBgn0002565 Lsp2 3,91 Yes
FBgn0022774 Oat 2,26 Yes OAT
FBgn0000150 awd 1,36 Yes NME1-NME2
FBgn0000116 Argk 0,76 Yes CKB
Oxidation reduction
FBgn0023507 CG3835 -1,53 Yes D2HGDH
FBgn0030041 CG12116 -1,22 Yes
FBgn0031689 Cyp28d1 -1,11 Yes
FBgn0000406 Cyt-b5-r -1,06 Yes
FBgn0025678 CaBP1 3,24 Yes CABP1
FBgn0033663 ERp60 2,57 Yes PDIA3
FBgn0013685 mt:ND6 2,13 Yes ND6
FBgn0013684 mt:ND5 1,57 Yes ND5
FBgn0013680 mt:ND2 1,38 Yes ND2
FBgn0013675 mt:CoII 1,30 Yes COX2
FBgn0086254 CG6084 1,29 Yes AKR1B15
FBgn0013678 mt:Cyt-b 1,26 Yes CYTB
FBgn0016691 Oscp 1,16 Yes ATP5O
FBgn0013672 mt:ATPase6 1,11 Yes ATP6
FBgn0020236 ATPCL 1,00 Yes ACLY
FBgn0010100 Acon 0,98 Yes ACO2
FBgn0013674 mt:CoI 0,96 Yes COX1
FBgn0024289 Sodh-1 0,96 Yes SORD
FBgn0000055 Adh 0,76 Yes ADH1
FBgn0013676 mt:CoIII 0,74 Yes COX3
each contained 14.7% of the genes (Fig 2B). Next, we mapped the differentially expressed genes to identify if they were enriched in any particular chromosomal region (Fig 2C). From this map it was evident that genes affected by loss ofEts96Bwere distributed throughout the genome.
Ets96B inhibits the expression of a conserved molecular chaperone
complex
Using a ±log2 change in expression of 2.5 as a cut-off, we investigated the genes most highly affected whenEts96Bwas knocked down in the entire nervous system throughout development (Fig 3A). We utilized STRING and BioGrid [28,29] to find interacting proteins for these top hits, however, it was immediately evident that three of them interacted:Calcium-binding pro-tein 1(CaBP1),Calreticulin(Crc), andERp60.
To confirm the SOLiD sequencing results we pickedCaBP1,CrcandERp60and performed qPCR analysis (Fig 3B). The level of expression inelav-GAL4heterozygous controls was set as 100%, represented as 1 on the graph (Fig 3B). Compared to eitherelav-GAL4+/-orEts96B
RNAi1+/-controls,Ets96BRNAi1knockdown flies had a significant increase inCaBP1(P<0.005),ERp60
(P<0.005) andCrc(P<0.005) expression (Fig 3B). This was similar to results obtained by
SOLiD sequencing (Fig 3A).
It was reported that overexpression of an RNAi can lead to saturation of the RNA-induced silencing complex (RISC), leading to neuronal cell death or stress [30,31]. Therefore, we per-formed a control experiment overexpressing GFP under the control ofelav-GAL4and then used two different GFP RNAi lines to inhibit GFP expression (Figs1AandS3). We then
Table 1. (Continued)
Biological Process ID Gene Name Ets96BRNAi Expressed in CNS Human homologue log2 (fold change) according to FlyAtlas
Protein processing
FBgn0033366 Ance-4 -1,31 Yes
FBgn0005585 Crc 2,75 Yes CALR
FBgn0001233 Hsp83 2,19 Yes HSP90AB1
FBgn0036015 CG3088 1,99 Yes
FBgn0039562 Gp93 1,27 Yes HSP90B1
FBgn0024352 Hop 2,06 Yes STIP1
FBgn0023529 CG2918 1,37 Yes HYOU1
Immune defense
FBgn0030262 Vago -1,78 Yes
FBgn0010225 Gel -0,58 Yes
FBgn0044812 TotC 3,71 Yes
FBgn0012042 AttA 2,75 Yes
FBgn0028396 TotA 1,43 Yes
FBgn0035290 CG1887 1,16 No
FBgn0022355 Tsf1 0,97 Yes
FBgn0016687 Nurf-38 0,93 Yes PPA2
Neuropeptide hormone signaling
FBgn0037290 CG1124 1,35 Yes
FBgn0027586 CG5867 0,96 Yes
FBgn0042201 Nplp3 0,81 Yes
Fig 3.Ets96Bregulates a conserved molecular chaperone complex.(A) SOLiD data for elav-GAL4>Ets96BRNAiversus controls (w,elav-GAL4>w1118andw1118>Ets96BRNAi) 5
–7 day old male heads. Only genes regulated more than±log2 2.5-fold change are included. (B) Relative expression levels of
CaBP1,ERp60andCrcin 5–7 day old control males or males whereEts96Bwas knocked down in the entire nervous system throughout development. This assay was repeated at least 7 times. Error bars indicate SEM. (n = 25 males per treatment;***P<0.005 compared withelav-GAL4controls, one-way ANOVA with Tukey’s post hoc test for multiple comparisons). (C) Biogrid and String were used to find all genes that interact with the molecular chaperone genes recovered in theEts96Bknockdown males. Genes in red were recovered in theEts96BSOLiD sequencing. (D) Data showing human homologues of Drosophila genes recovered in Biogrid and String analysis. Genes in red were recovered in theEts96BSOLiD sequencing. (E) Diagram
measured the level of expression ofCaBP1,ERp60andCrc; no differences in the expression lev-els ofCaBP1,ERp60andCrcwere observed between controls and GFP knockdown males (Figs
1BandS3).
When looking at interacting genes, we noticed thatCrcnetworked in both STRING and BioGRID with another hit from the SOLiD sequence data,Glycoprotein 93(Gp93, human
HSP90B1), which in turn interacted with yet another hit,CG2918(humanHYOU1) (Table 1). Utilizing these genes, and all the genes with which they were predicted to interact, we employed the STRING program to make a network (Fig 3C). From this it was evident that the genes formed a network, withGp93,Protein disulfide isomerise(Pdi), andCaBP1identified as hubs (Fig 3C).
All of the genes used to make the interaction map had human homologues (Fig 3D). These proteins locate to the ER and are involved in the regulation of protein folding (Fig 3E). Of note, all homologous genes in this pathway that were highly overexpressed whenEts96Bwas knocked down in the CNS, are involved in disulphide bridge formation (Crc,ERp60and
CaBP1) (Fig 3E, proteins marked in red and underlined).
Ets96B affects starvation resistance
Given that knocking downEts96Baffected genes involved in energy homeostasis (mitochon-drial electron transport chain,Table 1) and protein production (Fig 3E), as well as inhibited the expression ofCG5966(Drosophilahomologue of humanpancreatic lipase,PNLIP), we wanted to understand if loss ofEts96Bhad any effect on metabolism. Furthermore, to deter-mine ifEts96Bhad a developmental phenotype, both the pan-neuronalelav-GAL4driver and theEts96B-GAL4driver [32] were employed.Ets96Bis located on the right arm of the third chromosome at 96A22 in the forward orientation and encodes for two isoforms (S1 Fig). Recently, a 832 bp region from the third intron of Ets96B-RB, or fourth intron of Ets96B-RC, was cloned and used to make a GAL4 transgenic line (GMR36H05-GAL4, which we refer to as
Ets96B-GAL4) [32] (S1 Fig).
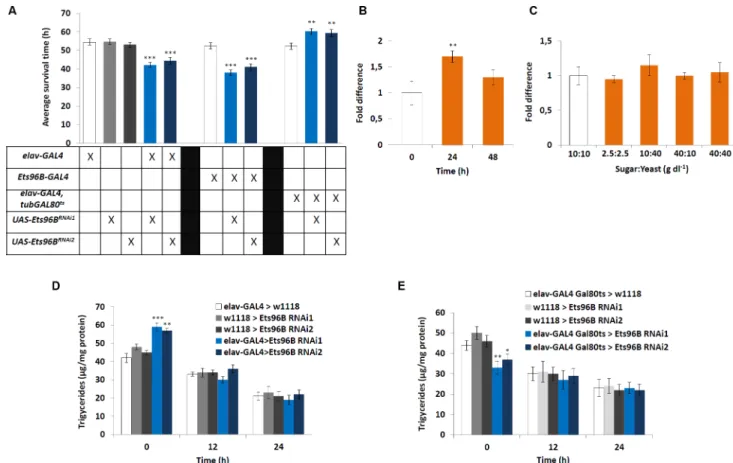
To begin, we performed a starvation assay utilizing the Drosophila Activity Monitoring Sys-tem (DAMS), as it is able to uncover broad defects in metabolism [33]. Knocking downEts96B
in the entire CNS during development using eitherEts96BRNAi1orEts96BRNAi2made flies more susceptible to starvation (P<0.005) (Fig 4A). A similar phenotype was observed whenEts96B
was knocked down throughout development using theEts96B-GAL4driver (P<0.005) (Fig
4A). To clarify if this was indeed a developmental phenotype, we used theelav-Gal4,tubGal80ts
driver [34] to knockdownEts96Bspecifically in adults using eitherEts96BRNAi1orEts96BRNAi2. Remarkably, this induced the opposite phenotype, where males were significantly more resis-tant to starvation than controls (P<0.01) (Fig 4A).
To establish ifEts96Btranscript levels in the brain were regulated by starvation, we per-formed qPCR analysis on heads from adult males starved for either 24h or 48h. Starving males for 24h significantly increasedEts96Bexpression (P<0.01) (Fig 4B). Additionally, we
deter-mined if macronutrient content influencedEts96Bexpression. Transcript levels of males fed a control diet (10 g/dl:10 g/dl sucrose:brewer’s yeast) were set as 100%, represented as 1 on the graph (Fig 4C). However, none of the diets had a significant effect onEts96Bexpression.
depicting molecules involved in endoplasmic reticulum protein folding. These include molecular chaperones that function to prevent aggregation (Bip, HSP90B1, DNAJC3, HYOU1 and CALR), protein disulfide isomerases that catalyze disulfide bond formation, isomerization and reduction (PDIA3, PDIA3 and P4HB), and proteins involved in de- or re-glycosylation of improperly folded glycoproteins (PRKCSH and UGGT1). Drosophilahomologues that were up-regulated whenEts96Bwas knocked down are in red, and those that were up-regulated more than 2.5-fold are underlined.
Ets96B affects lipid storage
Given that starvation resistance was affected inEts96Bknockdown males, to understand if
Ets96Bregulates normal feeding behaviour a CAFE assay was performed to measure how much food flies fedad libitumconsumed during a 24h period [35]. There was no significant difference in the amount of food consumed whenEts96Bwas knocked down in the nervous system by expressingEts96BRNAi1throughout development (S2 Fig). We also performed the CAFE assay using theelav-Gal4,tubGAL80tsdriver to knockdownEts96Bspecifically in adults. Again no significant difference was observed betweenEts96Bknockdown flies or controls (S2 Fig). Perhaps these are not surprising results, given that our SOLiD data revealed no significant change in the expression of any gene known to directly influence feeding behaviour (Table 1
andS1 Dataset).
Next, we determined the stored lipid content before and during starvation. For this we mea-sured triacylglyceride (TAG) levels in normal fed flies, as well as during starvation. Interest-ingly, the lipid content ofelav-GAL4;UAS-Ets96BRNAi1orelav-GAL4;UAS-Ets96BRNAi2
Fig 4.Ets96Bregulates starvation resistance.(A) We tested the effect ofEts96B-knockdown in flies using the starvation survival assay. 5–7 day old control andEts96Bknockdown males (GAL4 driver crossed to eitherEts96BRNAi1
orEts96BRNAi2
) were placed in a vial containing 1% agarose and maintained at 25°C. DAMS was used to monitor activity. (n = 30–60 flies per genotype, one-way ANOVA with Tukey’s post hoc test for multiple comparisons) (B) To examine how starvation affects the expression level ofEts96B, RNA was extracted from normal fed flies, as well as after 24 and 48 h of starvation. (C) To examine how nutritional state affects the expression levels ofEts96B, RNA was extracted under different nutritional states. Flies fed ad lib were set as 100%, represented by 1 on the graphs (B, C: n = 10 replicates, one-way ANOVA with Tukey’s post hoc test for multiple comparisons) (D, E) Triglyceride levels were determined in male flies at 0, 12 and 24 hours of starvation. The (D)elav-Gal4driver was used to express Ets96B RNAi (Ets96BRNAi1
orEts96BRNAi2)throughout development (UAS-Ets96BRNAi1and UAS-Ets96BRNAi2
) and (E) theelav-GAL4,tub-GAL80ts
driver was used to knockdownEts96B(Ets96BRNAi1
orEts96BRNAi2) in adult males. (D, E: n = 30 males per treatment, assay was repeated at least 10 times for each genotype, one-way ANOVA with Tukey’s post hoc test for multiple comparisons). In all graphs significance levels are indicated:*,P<0.05;**,P<0.01;***,P<0.005. Error bars = SEM.
doi:10.1371/journal.pgen.1006104.g004
knockdown males was significantly higher than either control (P<0.005) (Fig 4D). After 12h
and 24h of starvation all strains had lower total TAG levels and there was no significant differ-ence between strains (Fig 4D). This suggests that during the first 12h of starvation,Ets96BRNAi
knockdown males mobilized more of their stored lipids than control flies.
Next, using theelav-Gal4,tubGal80tsdriver, we knocked downEts96Bspecifically in adults. Similar to the starvation assay, this induced the opposite phenotype, where the TAG content of
Ets96BRNAi1orEts96BRNAi2knockdown males was significantly lower than either control (Ets96BRNAi1P<0.01,Ets96BRNAi2P<0.05) (Fig 4E). As before, after 12h and 24h of
starva-tion all strains had lower lipid contents and there was no significant difference between strains (Fig 4E). Contrary to knocking downEts96Bthroughout development, whenEts96Bwas knocked down specifically in the adult nervous system, males mobilized significantly less of their lipid stores during the first 12h of starvation.
Even though knocking down a random gene, such as EGFP, in the nervous system had no effect on the Ets96B-regulated molecular chaperones,CaBP1,ERp60orCrc, we still wanted to confirm that activating the RNAi system in the CNS didn’t induce unspecific phenotypes. Therefore, we measured triacylglyceride (TAG) levels in normal fed flies, as well as during star-vation; of controls (elav-GAL4;UAS-GFP) and GFP knockdown males, no differences in TAG levels were observed (Figs3CandS3).
Ets96B regulates startle-response and sleep
One of the molecular chaperones upregulated whenEts96Bwas knocked down in the nervous system,Crc, is necessary for startle-induced locomotion. Yamamoto et al. [36] reported that
Crcmutants lack a startle-response. Therefore, we hypothesized thatEts96Bknockdown males, whereCrcis overexpressed (seeFig 3A and 3B), would have the opposite phenotype and be excessively responsive to being startled. Using the same assay [36], we found that knocking downEts96Bin the nervous system throughout development induced a heightened startle-response (P<0.01) (Fig 5A). WhenEts96Bwas knocked down specifically in adults the
star-tle-response was the same as control males (P = 0.57) (Fig 5B).
Ets96B was further assessed for behavioural defects using a DAMS movement based assay. During the first hour in the DAMS knocking downEst96B(Ets96BRNAi1orEts96BRNAi2), using eitherelav-GAL4orEts96B-GAL4, had significantly more movement than controls (P<0.01,
exceptEts96B-GAL4;UAS-Ets96BRNAi1P<0.005) (Fig 5C) This hyperactivity continued
dur-ing the second hour in the DAMS (P<0.05) (Fig 5C). The activity level of all genotypes was
similar throughout the last two hours monitored. Furthermore, during the first 30 minutes after light shock, bothelav-GAL4;UAS-Ets96BRNAiandEts96B-GAL4;UAS-Ets96BRNAi knock-down males, using eitherEts96BRNAi1orEts96BRNAi2, had significantly more movement than either control (P<0.01, exceptelav-GAL4;UAS-Ets96BRNAi1P<0.05), but not 30 minutes
prior to or 30–60 minutes after light shock (Fig 5D). This indicates that knocking downEts96B
in the nervous system during development increased exploration/anxiety when the setting was novel, as well as after a light-shock stimulus.
Next, to check that the DAMS measured response was not specific for light-shock stimulus, we repeated the assay using a loud white noise (65-70dB) to induce stress. Similar to what was observed with light-stimulus, during the first 30 minutes after noise shock,elav-GAL4; UAS-Ets96BRNAi1knockdown males had significantly more movement than either control (P<0.005), but not 30 minutes prior to or 30–60 minutes after light shock (Fig 5E)
startle-response. Similar to what was observed in the TAG assay, general overexpression of an RNAi in the entire nervous system had no effect on the startle-response (Figs3DandS3).
In addition, we employed the DAMS to determine if there was an effect on general activity and sleep/wake behaviour (Fig 6A). To measure locomotor activity, male flies were placed in the DAMS and activity was quantified every minute for a 24h period. WhenEts96Bwas knocked down using either theelav-GAL4(P<0.01) orEts96B-GAL4(P<0.01) driver,
males were significantly more active (Fig 6B). WhenEts96Bwas knocked down specifically in adults, activity was similar to controls (P = 0.58 compared toelav-Gal4,tubGal80ts hetero-zygous control) (Fig 6C). We also observed thatelav-GAL4>Ets96BRNAiknockdown flies
(Ets96BRNAi1orEts96BRNAi2) slept significantly less during the night than controls (Fig 6A and 6D). WhenEts96Bwas specifically knocked down in adults there was no difference in sleep/wake behaviour between knockdown males and controls (Fig 6E, onlyEts96BRNAi1
used for this experiment).
Fig 5.Ets96Bknockdown during development induces a heightened startle-response.(A, B) Startle-response test demonstratingEts96Bknockdown males have a hyperactive startle-response. (A)Ets96Bknocked down throughout development using UAS-Ets96BRNAi1
or UAS-Ets96BRNAi2
crossed to the pan-neuronal driverelav-GAL4(B)Ets96Bknocked down only in adults using UAS-Ets96BRNAi1
crossed to the pan-neuronal driver and temperature sensitive allele of the GAL4 inhibitor GAL80elav-GAL4,tub-Gal80ts. (A, B: n = 50 males per strain;
**P<0.01 compared with controls, one-way ANOVA with Tukey’s post hoc test for multiple comparisons). (C) The DAMS system was used to monitor locomotion for the first four hours flies were placed in the system. (D) The DAMS system was used to monitor locomotion prior to and after light stimulation. (E) The DAMS system was used to monitor locomotion prior to and after sound stimulation (65–70 dB). OnlyEts96BRNAi1was used for this assay. (C-E: n = 30–60 males per strain;*P<0.05,**P<0.01,***P<0.005 compared with controls, one-way ANOVA with Tukey’s post hoc test for multiple comparisons) In all graphs error bars = SEM.
doi:10.1371/journal.pgen.1006104.g005
Drosophila
Ets96B and mouse Etv5 are expressed in dopaminergic
neurons
Next, to see where Ets96B could be involved in nervous system signalling we crossed Ets96B-GAL4toUAS-GFPand mapped GFP expression in the adult brain. Since dopamine is known to be a major regulator of the startle-response, we co-stained the brains for Tyrosine hydroxylase
Fig 6.Ets96Bregulates activity and sleep/wake behaviour.The DAMS system was used to monitor locomotion and sleep/wake behaviour over a 48 hour period. (A) Bar diagram indicating general activity over a 48 hour period of adult flies maintained on a 12:12 hour light:dark cycle. White bar indicates lights-on and dark bar and gray highlight indicate lights-off. Representative result for one run using Ets96BRNAi1
is shown (B) Total number a beam breaks over a 24 hour period in control flies or flies were Ets96B was knocked down (Ets96BRNAi1
orEts96BRNAi2) throughout development either in the entire nervous system (elav-GAL4) or specifically in Ets96B neurons (Ets96B-GAL4). (C) Total number a beam breaks over a 24 hour period in control flies or flies were Ets96B was knocked down (Ets96BRNAi1) specifically in adult neurons (elav-GAL4;tubGAL80ts). (D) Total minutes flies slept per night in control flies or flies were Ets96B was knocked down (Ets96BRNAi1
orEts96BRNAi2
) throughout development, either in the entire nervous system (elav-GAL4) or specifically in Ets96B neurons (Ets96B-GAL4). (E) Total minutes flies slept per night in control flies or flies were Ets96B was knocked down (Ets96BRNAi1
) specifically in adult neurons (elav-GAL4;tubGAL80ts
). (B-E, n = 30–60 males per strain;*P<0.05,**P<0.01 compared with controls, one-way ANOVA with Tukey’s post hoc test for multiple comparisons) In all graphs error bars = SEM.
(TH), which is necessary for the production of L-DOPA and specifically marks dopaminergic neurons [37]. Interestingly we saw that Ets96B was almost exclusively expressed in dopaminergic neurons (Fig 7A–7C). Specifically, we saw Est96B-GAL4 induced GFP expression in the suboe-sphageal ganglionic (SOG) region in the brain (Fig 7A and 7B). Furthermore, Est96B-GAL4 induced GFP-expression co-localized with TH in a subset of dopaminergic PPM1/2 neurons (Fig
Fig 7.Ets96BandEtv5expressed on dopaminergic neurons.(A-C)Ets96B-GAL4was crossed toUAS-GFPto examineEts96Bexpression in adult male brains. Adult male brains were then stained for GFP and Tyrosine hydroxylase (TH) expression. (A) Anterior section showing co-expression of GFP and TH in the eye, the ventrolateral prototcerebrum (VLP and the suboesophageal ganglion (SOG, see inset). (B) Midbrain, no co-expression was observed in the dopaminergic clusters PAM or PAL, while coexpression was observed in the SOG (see inset). (C) In the posterior brain section no expression was observed in dopaminergic clusters PPL1 or PPL2, but there was co-expression of GFP and TH in cluster PPM1/2 (see inset). There were also two neurons near the dopaminergic PPM1/2 cluster that were GFP specific, and had no TH expression (see inset, white arrow). In A-C size bar is equivalent to 100μm. (D-G) Black scale bar, 1mm. (H-P) white scale bar, 0.5 mm. Bregma levels and described brain regions are
according to Allen Mouse Brain Atlas. (H, I) Cortex layers 1–6. (J) basolateral amygdaloid nucleus, anterior part (BLA), basolateral amygdaloid nucleus, ventral part (BLV), basomedial amygdaloid nucleus, posterior part (BMP), central nucleus of amygdala, lateral part (CeL), dorsal endopiriform claustrum (DEn), stria medullaris (STIA), ventral endopiriform claustrum (VEn), (K) ventromedial thalamic nucleus (VM), (L) dorsomedial hypothalamic nucleus, ventral part (DMV), nigrostriatal tract (ns), ventromedial hypothalamic nucleus, central part (VMHC), ventromedial
hypothalamuc nucleus, dorsomedial part (VMHDM), ventromedial hypothalamic nucleus, ventrolateral part (VMHVL), (M) Cortex layers 1–6, (N) parabrachial pigmented nucleus of the VTA (PBP), ventral tegmental area (VTA), (O) field CA1 of the hippocampus (CA1), field CA2 of the hippocampus (CA2), field CA3 of the hippocampus (CA3), lacunosum moleculare layer of the hippocampus (LMol), pyramidal layer of the hippocampus (Py), (P) crus 1 of the ansiform lobule (Crus1), lobule 4 and 5 of the cerebellar vermis (4/5Cb).
doi:10.1371/journal.pgen.1006104.g007
7C). Interestingly, within the PPM1/2 neurons there were two neurons that were GFP positive but TH negative (Fig 7C, inset, white arrows). There was also a strong overlap between Ets96B-GAL4 driven GFP and TH in the eye and the ventrolateral protocerebrum (VLP) (Fig 7A). Although GAL4 driven GFP is not an entirely reliable source for mapping gene expression, this result is an indication thatEts96Bmay be expressed in the regions of theDrosophilabrain gov-erning locomotion, as well as odour and visual-driven memory and learning. Furthermore, the
Ets96B-GAL4driver may not recapitulate the entireEts96Bexpression pattern.
In order to specify if the expression pattern ofEtv5was enriched in dopaminergic-rich regions of the mouse brain, we performed detailed mRNAin situhybridization mapping on coronal sections (Fig 7D–7G,S1 Table).Etv5mRNA was expressed in a specific and distin-guishable pattern in certain brain regions, predominantly the cerebral cortex (Fig 7H, 7I and 7M), the amygdala (Fig 7J), and the hypothalamus (Fig 7L). Within the cerebral cortex there was conspicuously high expression in cortical layers 2, 4 and 6, while expression was almost absent from layers 1, 3, and 5 (Fig 7H, 7I and 7M). Furthermore, high expression was also observed in the dorsal and ventral endopiriform claustrum (Fig 7J). Strong expression was observed in limited parts of the amygdale, including the basolateral amygdaloid nucleus, ven-tral part (Fig 7J). Considerably high expression was found in the bed stria terminalis and the central amygdaloid nucleus (Fig 7J). Etv5 expression was observed at low to moderate levels in the hypothalamus, whereas expression was almost absent in the thalamus (Fig 7K and 7L). In conclusion, hypothalamic expression was found in the dorsomedial hypothalamic nucleus and also the central, dorsomedial and ventrolateral part of the ventromedial hypothalamic nucleus (Fig 7L). Strong expression was also identified in the nigrostriatal tract (Fig 7L). In the mesen-cephalon expression was restricted to the ventral tegmental area (VTA), including the parabra-chial pigmented nucleus of the VTA (Fig 7N). In the hippocampus, Etv5 was strongly
expressed in the pyramidal cell layer, CA1 through CA3. Some expression was also found in the lacunosum moleculare layer (Fig 7O). Low levels ofEtv5mRNA expression were observed in the cerebellum, including the Granular, Molecular and Purkinje cell layers (Fig 7P). Other regions in the brain are listed inS1 Table.
Ets96B required in dopaminergic neurons for proper metabolism and
behaviour
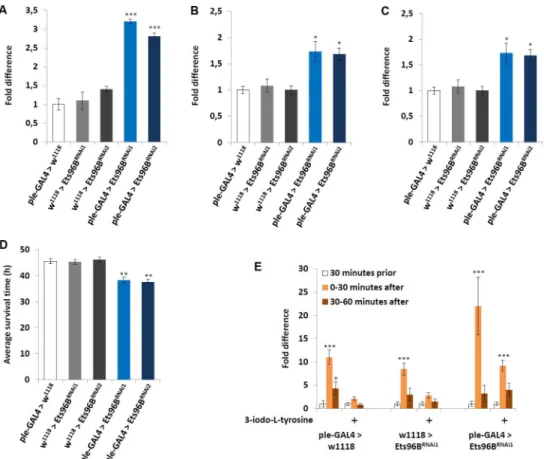
Given that Ets96B and mouse Etv5 seemed to be expressed in dopaminergic-rich regions, we used theple-GAL4driver (pale[ple] is theDrosophilatyrosine hydroxylase, necessary to con-vert tyrosine to L-DOPA) to knockdownEts96Btranscript specifically in dopaminergic neu-rons throughout development. We then examined the transcription levels of a select number of genes-ple,Vesicular monoamine transporter(Vmat), andDopamine transporter(DAT)-known to influence dopamine production, release or reuptake (Fig 8A–8C). Transcription levels of the
ple-GAL4heterozygous controls were set at 100%, shown as 1 on the various graphs. When
Ets96Bexpression was knocked down in dopaminergic neurons, the transcript level ofplewas significantly upregulated (P<0.005) (Fig 8A). Furthermore, the expression ofVmat, involved
in the transportation of monoamines such as dopamine into the synaptic vesicles, was also increased inEts96Bknockdown males (P<0.05) (Fig 8B). Finally, the expression ofDAT,
which is necessary to pump dopamine out of the synapse back into cytosol, was significantly lower whenEts96Bexpression was knocked down in dopaminergic neurons (P<0.005) (Fig
8C). Increased dopamine production and decreased dopamine reuptake should lead to pro-longed dopamine signalling.
using theelav-GAL4andEts96B-GAL4drivers, knocking downEts96Bspecifically in dopami-nergic neurons throughout development made adult males more susceptible to starvation (P<0.01) (Fig 8D). Furthermore, loweringEts96Btranscript levels in dopaminergic neurons
was sufficient to replicate the heightened light-induced startle-response (P<0.005) (Fig 8E).
To determine if the increased startle-response observed whenEts96Bwas knocked down spe-cifically in dopaminergic neurons was due to increased dopamine signalling, we fed adult males the tyrosine hydroxylase inhibitor 3-iodo-L-tyrosine before performing the light-induced startle-response assay. In controls this was sufficient to abolish the light-light-induced star-tle-response (Fig 8E). In males whereEts96Bwas knocked down in dopaminergic neurons, inhibiting dopamine production reduced the startle-response to the same level as normal fed controls (Fig 8E). From this result we conclude that reducingEts96Bexpression in dopaminer-gic neurons increases dopamine signalling.
Fig 8.Ets96Brequired in dopaminergic neurons.(A-C)Ets96Bwas knocked down throughout development (Ets96BRNAi1
orEts96BRNAi2
) specifically in dopaminergic neurons using theple-GAL4driver and the transcript level of genes (A)ple, (B)Vmatand (C)DATwas measured. RNA was collected from the heads of 5- to 7-day-old males for each genotype. qPCR was repeated at least 7 times for each transcript. (n = 25 males per treatment;*P<0.05,***P<0.005 compared with controls, one-way ANOVA with Tukey’s
post hoc test for multiple comparisons) (D)Ets96Bwas knocked down throughout development (Ets96BRNAi1 orEts96BRNAi2) specifically in dopaminergic neurons using theple-GAL4driver. 5–7 day old control and Ets96Bknockdown males were placed in a vial containing 1% agarose and maintained at 25°C, DAMS was used to monitor activity. (n = 30–60 flies per genotype,**= P<0.01, one-way ANOVA was used to
determine significance with Tukey’s post hoc test for multiple comparisons). (E) The DAMS system was used to monitor locomotion prior to and after light stimulation. OnlyEts96BRNAi1was used for this assay. (n = 30 males per strain;*P<0.05,***P<0.005 compared with controls, Kruskal-Wallis non-parametric ANOVA was used to determine significance). In all graphs error bars = SEM.
doi:10.1371/journal.pgen.1006104.g008
Human ETV5 SNPs link to BMI and Bipolar disorder
The startle-response phenotype demonstrated by loss ofEts96Bin the nervous system is similar to the effect of prepulse inhibition (PPI) in mammals. PPI is a neurological phenomenon where a weaker prestimulus (prepulse) inhibits the reaction to a subsequent stronger startle stimulus (pulse). In humans disrupted PPI responses are linked with bipolar disorder [38]. Using the GWAS Central database [39] we searched forETV5localized SNPs that had a signifi-cant link (P<0.05) to either BMI or bipolar disorder. Employing this method we found 12
SNPs mapped toETV5that significantly linked to BMI (S2 Table). Interestingly, three of these SNPs were also significantly linked to bipolar disorder (S2 Table). Next, we made a map to define where these 12 SNPs localized within theETV5genomic region (Fig 9A). Of notable interest, the three BMI/bipolar associated SNPs all localized aroundETV5exons 6 and 7 (Fig 9A, blue highlighted SNPs). This is an interesting genetic region as there is evidence a truncated ETV5 transcript is produced that stops after exon 7, which would encode only the inhibitory N-terminal PEA3 domain [40]. Furthermore, this same region encoded a long non-coding antisense RNA (lncRNA) calledETV5-AS1(Fig 9A). Using the NONCODE database [41] we determined thatETS5-AS1was expressed in the adrenal glands, testis and thyroid.
Using Encode Roadmap {http://www.encode-roadmap.org/} (S4 Fig) and RegulomeDB [42] (Table 2) databases we determined the methylation state of theETV5gene in various brain regions. By means of these databases we found that SNPs rs7647305 and rs1356292 mapped to the promoter region. In fact, rs7647305 was predicted to map to the TATA-box and rs1356292 was predicted to be at the transcription start site (Table 2). It was interesting that rs4686730 was predicted to map to an insulin promoter factor 1 (IPF1) binding site (Table 2), considering thatEtv5was found to be necessary for the secretion of insulin in mice [43]. When examining the chromatin state of the three SNPs linked to BMI and BD, (rs4686730, rs7433760 and rs4686728) they were all quiescent in the brain germinal matrix (BGM) (Table 2). Further-more, in brain regions known to control reward response, such as the anterior caudate (BAC) and midfrontal lobe (BMFL), rs7433760 mapped near a region with H3K4 single methylation, indicating an active enhancer (S4 Fig). In the RegulomeDB database, rs7433760 was predicted to map to an active enhancer in the angular gyrus (BAG), dorsolateral prefrontal cortex (BDPF) and the hippocampus middle (BHM), areas involved in decision making and memory. Finally, we made a linkage disequilibrium map that demonstrated tight linkage between all
ETV5SNPs linked to BMI and BD, except for BMI-linked rs6777779 (Fig 9B).
Next we wanted to determine if the human homologues of theDrosophilaER molecular chaperones (Fig 3D), whose expression is regulated byEts96B, also linked to BMI and BD. Using data from multiple GWAS studies (BMI, Waist-hip ratio or bipolar disorder [8,44–46]) we searched for SNPs localizing to the human ER molecular chaperone homologues. We found SNPs with a significant link (P<0.05) to either BMI or BD that localized to three of the
homo-logues (PDIA3,PDIA6andHYOU1) (Fig 10A). We located 9 SNPs mapped toPDIA3, 5 SNPS mapped toPDIA6and 5 SNPS mapped toHYOU1that significantly linked to BMI. Further-more, we found 1 SNP mapped toPDIA3, 3 SNPs mapped toPDIA6and 3 SNPs mapped to
HYOU1that significantly linked to BD (Fig 10A). Next, we made linkage disequilibrium maps forPDIA6andHYOU1that demonstrated tight linkage between allPDIA6SNPs linked to BD (Fig 10B); the same was true forHYOU1, except for BD-linked rs511134 (Fig 10C).
Discussion
Fig 9. HumanETV5SNPs associated with body mass index and bipolar disorder.(A) Localization of relevant single nucleotide polymorphisms (SNPs) in the ETV5 gene. SNP names according to NCBI dbSNP. The GWAS central database was used to link ETV5 associated SNPS to BMI. Interestingly, three SNPs were also associated with bipolar disorder (blue SNPs). The three bipolar-linked SNPs all localize around exons 6 and 7, which is also the location of the long, noncoding RNA (lncRNA) ETV5-AS1. Snap Proxy was then used to determine Pair-linked disequilibrium in various populations. (B) Linkage disequilibrium between SNPs in ETV5. Black boxes = exons, thick black lines between boxes = introns, red points = SNPs associated with BMI in GWAS, blue points = SNPs associated with bipolar disorder in GWAS. The LD between SNPs in the CEU population is expressed as R2and displayed as a color code below the plot.
doi:10.1371/journal.pgen.1006104.g009
that loss ofEts96Baffects starvation resistance, lipid storage, startle-response and sleep/wake behaviour. Moreover, knocking down Ets96B specifically in dopaminergic neurons influences the expression of genes involved in dopamine signalling, and is sufficient to recapitulate both metabolic and behavioural phenotypes. Finally, we map humanETV5-associated SNPs linked to BMI and bipolar disorder to a location surroundingETV5exons 6 and 7. This region is interesting as it may be involved in regulating the expression of a truncated ETV5 protein, comprising only the PEA3 inhibitory domain [40]. This same region also contains a long non-coding RNA (lncRNA),ETV5-AS1, whose function is unknown at this time; however, there is evidence that lncRNAs regulate alternative splicing [47].
The involvement ofETV5homologues in the development and maintenance of the dopami-nergic system has been studied previously [48–50]. The first evidence of anETV5homologue regulating dopaminergic neuronal development was discovered inC.elegans, where loss of ast-1resulted in the failure of dopaminergic neurons to develop [48]. Subsequently, dopaminergic neuronal development in the substantia nigra (SN) and ventral tegmental area (VTA) ofEtv5
knockout mice was studied. InEtv5knockout mice, within the studied regions the dopaminer-gic system developed normally and there was no significant difference observed in genes that regulate dopamine signalling, such asdopamine transporter(Dat) orvesicular monoamine transporter 2(Vmat2) [49]. Our study demonstrates that Etv5 is extensively expressed through-out the mouse brain (seeFig 7G–7P). One region where we observed high levels of Etv5 expres-sion, the amygdala (seeFig 7J), was not studied in Wang and Turner [49]. Interestingly, in mice dopaminergic neurons within the amygdala have been shown to regulate both anxiety and depressive-like behaviours [51,52]. There is a possibility that Etv5 function in the regula-tion of dopaminergic neuronal development or maintenance is more important in areas other than the SN or VTA, such as the amygdala. Given that we show thatDrosophilaEts96B regu-lates genes involved in cellular stress, in mice Etv5 might only become important in dopami-nergic neurons when they come under stress. These possibilities should be followed up in
Table 2. Regulatory elements and chromatin states associated withETV5SNPs. Histone Modifications/Chromatin State
rsID Bound Protein/Motifs BAG BAC BCG BDPF BGM BHM BITL BSN FB-F FB-M rs9816226 ND ND ND ND ND ND ND ND ND ND ND
rs7647305 Pit1, Tbp Q/L WRPC Q/L Q/L WRPC WT Q/L WT Q/L WRPC
rs1356292 None FATSS FATSS FATSS FATSS FBTSS FATSS ATSS E ATSS FSTSS
rs1516726 ND ND ND ND ND ND ND ND ND ND ND
rs1516725 GR WT WT WT WT RPC E WT WT WT WRPC
rs4234589 FOX WT WT WT WT WT WT WT WT E FATSS
rs6809651 ND ND ND C ND ND ND ND ND ND ND
rs4686730 MAX/ER, c-Myb, OPF1. TGIF1 WT WT WT WT Q/L WT WT WT Q/L WT
rs7433760 None E WT WT E Q/L E WT WT Q/L WT
rs4686728 None WT WT WT WT Q/L WT WT WT WT WT
rs6777779 ND ND ND ND ND ND ND ND ND ND ND
rs9824882 HNF3beta, Oct1, Fox WT WT ST WT WT ST ST WT WT St Abbreviations: POU domain, class 1, transcription factor 1 (Pit1), TATA-binding protein (Tbp), glucocorticoid receptor (GR), Forkhead box (Fox), MYC associated factor X (MAX), Insulin Promoter Factor 1 (IPF1), TGFB-Induced Factor Homeobox 1 (TGIF1), hepatic nuclear factor 3 beta (HNF3beta), Octamer-Binding Protein 1 (Oct1), No data (ND), quiescent, low transcription (Q/L), weak transcription (WT), strong transcription (ST), weak repressed polycomb (WRPC), active transcription start site (ATSS),flanking active transcription start site (FATSS),flanking bivalent transcription start site (FBTSS), enhancer (E).
future studies. Finally, more recently it was discovered thatetv5co-expressed with tyrosine hydroxylase in the brain of a cichlid fish,Astatotilapia burtoni, but no functional analysis was undertaken in this study [49].
Our study indicates that inDrosophilaEts96B is necessary to inhibit dopamine signalling. In fact, our results indicate that in the fruit flyEts96Bacts to repress the expression of more
Fig 10. Human ER molecular chaperon SNPs associated with body mass index and bipolar disorder.(A) Summary figure of SNP association results from Genome Central [39] forPDIA3,PDIA6andHYOU1linkage to body mass index (BMI), Weight-hip ratio and bipolar disorder. Horizontal axis lists significant SNPs and genes. The red line represents P = 0.05 nominal significance level; above the line represents significant results. (B) Linkage disequilibrium between SNPs in PDIA6. Boxes = exons, lines between boxes = introns, The LD between SNPs in the CEU population is expressed as R2and displayed as a color code below the plot. (C) Linkage disequilibrium between SNPs in HYOU1. Boxes = exons, lines between boxes = introns, The LD between SNPs in the CEU population is expressed as R2and
displayed as a colour code below the plot.
doi:10.1371/journal.pgen.1006104.g010
genes that it activates. Possibly, there are co-factors that interact with Ets96B to govern if it is a transcriptional repressor or activator. There is evidence for this with other Ets-family members. For instance, in both mammals andDrosophila, Ets-1 (known as Pointed inDrosophila) can act as an activator or inhibitor depending on interactions with Runx1 (known as Lozenge in
Drosophila) [53,54]. Depending on temporal or spatial differences, this interacting protein may or may not be present, meaning in some tissues or conditions Ets96B would act as a tran-scriptional activator, while under other conditions it would act as a repressor. Given that our whole transcriptome sequencing was performed on material collected from well fed, equally aged, whole male adults, our results cannot determine if this is the case.
The largest group of genes affected by loss ofEts96Bthroughout development in the Dro-sophilanervous system is involved in oxidation/reduction, including those regulating mito-chondrial electron transport (seeTable 1). Interestingly, many studies have linked the mitochondrial electron transport chain to obesity, as well as insulin resistance [55–58]. This includesCOX1andCYTB, human homologues of two genes (mt:Colandmt:Cyt-b) overex-pressed whenEts96Bis knocked down in the CNS, which are linked to insulin sensitivity [59,
60]. Lower expression levels of these two genes correlates with insulin resistance [60]. Further-more, an association with obesity was found for a frequent allele of the humanATP6gene [61,
62]. Similar tomt:Colandmt:Cyt-b, theDrosophilahomolog ofATP6,mt:ATPase6, is also upregulated whenEts96Bis knocked down in the CNS.
WhenEts96Bis knocked down in the nervous system during development a group of con-served interacting endoplasmic reticulum (ER) proteins are highly upregulated:CaBP1,Crc
andERp60(seeFig 3A and 3B). All three proteins localize to the ER, where they are involved in the regulation of protein folding. Also, human homologues ofCaBP1andERp60, known as
PDIA6andPDIA3, are involved in disulfide bridge formation (seeFig 3E). Of note, insulin contains three important disulphide bonds that are conserved inDrosophilainsulin-like pep-tides, and recently it was demonstrated thatEtv5knockout mice are deficient in insulin secre-tion [43], though not due to a decrease in insulin production. Disulphide bonds are important for proper protein folding, secretion and function, and disruption of disulfide bond formation in insulin proteins could inhibit proper secretion.
Previously, it was demonstrated thatCrcmutant flies fail to react when startled [36,63]. Interestingly, we observed that adult males have a heightened startle-response whenEts96Bis knocked down in the CNS during development, but whenEts96Bexpression is specifically knocked down in adults there is no difference in activity compared to control flies. Further-more, compared to controls, knocking downEts96Bexpression throughout development induces hyperactivity. WhenCrcwas mutated, the mushroom bodies and ellipsoid body were smaller than normal.Ets96Bis also expressed in the mushroom bodies and the ellipsoid body of theDrosophilaCNS [32]. The mushroom bodies are the centre of learning and memory [64] while the ellipsoid body mediates stress-related locomotion [65,66], and both regions are important components of the dopamine and serotonin systems [65,66]. InDrosophilathe ellipsoid body regulates the startle-response; more specifically, dopaminergic neurons within the ellipsoid body regulate the arousal-response to being startled [67]. Possibly, through its reg-ulation of the molecular chaperon complex,Ets96Bcontrols the proper development or signal-ling of dopaminergic neurons within the mushroom bodies and the ellipsoid body.
Interestingly, when murine dopaminergic neurons are put under stress they upregulate theCrc
signalling in adults due to increased dopaminergic neuronal innervations. In regions of the human brain linked to bipolar disorder, such as the anterior caudate and mid-frontal lobe [70], the ETV5-linked SNP rs7433760 mapped to an enhancer specific for those regions (seeS4 Fig). Thus, a decrease inETV5expression could lead to increased dopaminergic signalling.
WhenEts96Bis knocked down in the nervous system during development, phenotypes mimicking obesity (increased lipid storage) and bipolar disorder (startle-response and dis-rupted sleep) are observed. Of note, we found 12ETV5localized SNPs that link to BMI, of which three also link to BD (seeFig 9, as well asS2 TableandS4 Fig). Intriguingly,HSP90B1
(Drosophila Gp93) andCALR(Drosophila Crc), homologues of molecular chaperones upregu-lated whenEts96Bwas knocked down in the nervous system, are not properly induced during increased endoplasmic reticulum (ER) stress in lymphoblastoid cells recovered from bipolar disorder patients [18]. Furthermore, we also found multiple SNPs that localize toPDIA3,
PDIA6andHYOU1that link to either BMI or bipolar disorder (seeFig 10A).
Another possibility of how disruption of ER localized molecular chaperone expression may link to obesity and/or BD is increased expression of vesicle monoamine transporter 2
(VMAT2), which concentrates monoamine neurotransmitters into synaptic vesicles. Our results show that loss ofEts96Bin dopaminergic neurons is sufficient to increase tryosine hydroxylase (ple)Vmatexpression and decreaseDATexpression, which would lead to
increased dopamine signalling. Mammalian VMAT2 contains a disulphide bridge in its vesicu-lar luminal loops that contributes to efficient monoamine transport [71]. This could be enhanced by increased expression ofPDIA3,PDIA6orCALR, whoseDrosophilahomologues,
CaBP1,ERp60andCrc, were all upregulated whenEts96Bwas knocked down in the nervous system. Increased VMAT2 function would influence monoamine signalling, including dopa-mine and serotonin. Vmat2 expression levels are reduced in Flinders sensitive line (FSL) rats, which represent a genetic animal model for clinical depression in humans [72,73]. This sug-gests that alterations in VMAT2 may play a role in the aetiology of depression and anxiety. Interestingly, reduced Vmat2 levels were localized to the ventral tegmental area and the sub-stantia nigra in FSL rats, regions that expressEtv5in mice [9,73]. Interestingly, in FSL rats, the reduced levels of Vmat2 protein were not caused by a reduction inVmat2mRNA levels. Thus, the activity of Vmat2 in FSL rat brain is likely not affected at the transcriptional level, but at the functional level.
In conclusion, here we identify a specific molecular link between obesity and bipolar disor-der, both conditions with highly complex and overlapping genetics and pathophysiology. We found that Ets96B regulates the expression of cellular systems with links to obesity and behav-iour, with phenotypes at the physiological level in the mutant flies supportive of these findings. In particular, we find thatEts96Binhibits the expression of a conserved ER molecular chaper-one complex shown to be neuroprotective in dopaminergic neurons. Furthermore, Ets96B is expressed in a subset of dopaminergic neurons in adult males and loss ofEts96Bspecifically in dopaminergic neurons influences the expression of genes involved in dopamine production, release and reuptake and would increase dopamine signalling. Finally, the new association of
ETV5to human bipolar disorder emphasizes a functional relationship between obesity and BD at the molecular, as well as behavioural level.
Methods
Fly stocks and maintenance
w,P{w[+mW.hs]=GawB}elav[C155],w1118;P{y[+t7.7] w[+mC] = GMR36H05-GAL4}attP2 P
{GawB}elavC155 w; P{FRT(whs)}G13 P{tubP-GAL80}LL2, and thew; P{w[+mC] = ple-GAL4.
F}3driver lines, thew; UAS-GFPline, as well as the Transgenic RNAi Project (TRiP) [25]
RNAi linesy1,sc,v1;P{TRiP.HMS00092}attP2(Ets96BRNAi1) andy1, v1;P{TRiP.JF02226}attP2 (Ets96BRNAi2) and the RNAi linesw1118;P{w[+mC] = UAS-GFP.dsRNA}143(GFPRNAi1) and
w1118;P{w[+mC] = UAS-GFP.dsRNA}142(GFPRNAi2) [74] were received from the Bloomington Stock Center (Bloomington, Indiana, USA;http://flystocks.bio.indiana.edu/). All strains were crossed into the samew1118genetic background. All flies, unless otherwise stated, were main-tained on Jazz mix standard fly food (Fisher Scientific, Göteborg, Sweden), supplemented with 5% Brewer’s yeast extract (VWR, Stockholm, Sweden). Flies were maintained at 25°C in an incubator at 60% humidity on a 12:12 light:dark cycle. Flies crossed to GAL4 drivers (GAL4 drivers crossed to UAS-RNAi lines) and controls (GAL4 drivers or UAS-RNAi crossed to
w1118) were raised at 25oC until the adults emerged (F1generation); once collected adults were raised at 29oC for the appropriate times. All assays were performed at 25°C. In all assays, the GAL4 drivers and UAS transgenic flies were crossed tow1118flies and their F1 progeny used as controls.
Multiple sequence alignments and Phylogenetic analysis
The protein sequences used for the sequence alignment and phylogenetics analysis were mined using Flybase (www.flybase.org), NCBI HomoloGene (www.ncbi.nlm.nih.gov/homologene), and Hmmer (www.ebi.ac.uk/Tools/hmmer/). Protein sequences were aligned using CLC sequence Viewer 6 using default parameters. The sequence alignment used for phylogenetic analysis was exported in clustal format and viewed using MEGA5 [75]. The file was then trans-formed into a MEGA file for further analysis. Evolutionary history was inferred using the Max-imum-likelihood method. The optimal tree with the sum of branch length = 3.794 is shown. The percentage of replicate trees in which the associated taxa clustered together in the boot-strap test (5000 replicates) is shown next to the branches. The tree is drawn to scale, with branch lengths in the same units as those of the evolutionary distances used to infer the phylo-genetic tree. The evolutionary distances were computed using the Dayhoff matrix based method and are in the units of the number of amino acid substitutions per site. The rate varia-tion among sites was modelled with a gamma distribuvaria-tion (shape parameter = 5). The analysis involved 35 amino acid sequences. All positions containing gaps and missing data were elimi-nated. There were a total of 170 positions in the final dataset. Evolutionary analyses were con-ducted in MEGA5 [75].
Library preparation and sequencing
Primary processing of SOLiD RNA-Seq reads. RNA-seq reads for whole transcriptome were obtained using SOLiD 5500xl paired end sequencing from life technologies. This version produces read length of 75 bp for fragment libraries with the alternative to sequence an addi-tional 35 bp in the reverse direction (paired-end sequencing). The samples were divided into six libraries and since the libraries were molecularly bar-coded the separation of libraries for control and experimental samples was done effortlessly using respective barcodes. The initial quality analysis was performed using a propriety tool 'XSQ Tools package' provided by the life technologies. This package also provides tools for converting files from XSQ to csfasta format and additionally provides qual files containing read quality information. Further analysis was done using the 'Tuxedo suit' [76] composed mainly of three tools TopHat, Cufflinks and CummRbund.
(build dmel_r5.47_FB2012_05) obtained from flybase using TopHat using the prebuilt bowtie index downloaded from the TopHat homepage (http://TopHat.cbcb.umd.edu/igenomes. shtml).
Transcript assembly and abundance estimation using Cufflinks. The aligned reads were then processed by Cufflinks v2.0.2. Cufflinks tool estimates the relative abundances of tran-scripts based on how many reads support each transcript, taking into account biases in library preparation protocols and reports it in“fragments per kilobase of transcript per million frag-ments mapped”or FPKM. Cufflinks constructs a minimum set of transcripts describing the reads in the dataset rather than using existing gene annotation allowing Cufflinks to identify alternative transcription and splicing. However it should be noted that Cufflinks (and other tools too) are dependent on the provided genome annotation and therefore the reported FPKM values relate only to genes described and genes missing in the annotation description file (even though reads map to it) will not be reported.
Differential expression testing using Cuffcompare and Cuffdiff. Cuffcompare was used to produce combined General Transfer Format (GTF) files of the six libraries. The GTF files were then passed to cuffdiff along with original alignments obtained with TopHat. Cuffdiff re-estimates the abundance of transcripts listed in.GTF files using alignment files. The differential expression is checked for genes, transcripts and isotopes. By tracking changes in the relative abundance of transcripts with a common transcription start site, cuffdiff can identify changes in splicing. We used cuffdiff to compare expression difference between three stages of controls and one experimental sample wherein geneETS96Bwas down regulated. Cuffdiff learns how read counts vary for each gene across the replicates and uses these variance estimates to calcu-late the significance of observed changes in expression. The calcucalcu-lated P value and q value (the FDR-adjusted P value of the test statistic) from cuffdiff were used to determine significance of differential expression The significance depends on whether P is greater than the false discov-ery rate (FDR) after a Benjamini-Hochberg correction [78] for multiple testing
RNA purification
The phenol-chloroform method was used for RNA extraction from tissue samples [79]. Fifty fly heads were homogenized with 800μl TRIzol (ThermoFisher Scientific, MA, USA), 200μl Chloroform (Sigma-Aldrich, MO, USA) was added and samples were centrifuged at 12000 rpm for 15 minutes at 4°C. The aqueous layer, which contained RNA, was separated and 500μl isopropanol (Solvaco AB, Sweden) was added. The RNA was precipitated by storing the sam-ples at -32°C for 2 hours. Samsam-ples were centrifuged at 12000 rpm for 10 minutes at 4°C, to col-lect the RNA pellets, which were then washed with 75% ethanol (Solvaco AB, Sweden) to remove the organic impurities. Samples were allowed to air dry to remove any traces of ethanol. Dried RNA pellets were dissolved in 21.4μl of RNAse free water (Qiagen GmBH, Germany) and 2.6μl of DNAse incubation buffer (Roche GmBH, Germany). The samples were incubated at 75°C for 15 minutes to ensure complete dissolution of RNA-pellets. 2μl of DNAse I (10 U/ μl, Roche GmBH, Germany) was added to each sample, and incubated at 37°C for 3 hr to remove DNA contamination. DNAse was deactivated by incubating the samples at 75°C for 15 minutes. Removal of DNA was confirmed by PCR using Taq polymerase (5U/μl, Biotools B & M Labs, Spain), followed by agarose gel electrophoresis. The RNA concentration was measured using a nanodrop ND 1000 spectrophotometer (Saveen Werner).
cDNA synthesis
cDNA was synthesized from RNA template using dNTP 20 mM (ThermoFisher Scientific, MA, USA), random hexamer primers and M-MLV Reverse Transcriptase (200 U/μl,
ThermoFisher Scientific, MA, USA) by following manufactures instructions. cDNA synthesis was confirmed by PCR followed by agarose gel electrophoresis.
qRT-PCR
Relative expression levels of three housekeeping genes (EF-1,Rp49&RpL11) and of the genes of interest were determined with quantitative RT-PCR (qPCR). Each reaction, with a total volume of 20μl, contained 20 mM Tris/HCl pH 9.0, 50 mM KCl, 4 mM MgCl2, 0.2 mM dNTP, DMSO (1:20) and SYBR Green (1:50000). Template concentration was 5 ng/μl and the concentration of each primer was 2 pmol/μl. Primers were designed with Beacon Designer (Premier Biosoft) using the SYBR Green settings. All qPCR experiments were performed in duplicates; for each primer pair a negative control with water and a positive control with 5 ng/μl of genomic DNA were included on each plate. Amplifications were performed with 0.02μg/ml Taq DNA polymerase (Biotools, Sweden) under the following conditions: initial denaturation at 95°C for 3 min, 50 cycles of denaturing at 95°C for 15 sec, annealing at 52.8–60.1°C for 15 sec and extension at 72°C for 30 sec. Analysis of qPCR data was performed using MyIQ 1.0 software (Bio-Rad, CA, USA) as previously reported [80]. Primer efficiencies were calculated using LinRegPCR [81] and sam-ples were corrected for differences in primer efficiencies. The GeNorm protocol described by Vandesompele et al. [82] was used to calculate normalization factors from the expression levels of the housekeeping genes. Grubbs' test was performed to remove outliers. Differences in gene expression between groups were analyzed with ANOVA followed by Fisher's PLSD test where appropriate. P<0.05 was used as the criterion of statistical significance. The following primers
were used:EF-1F: 5´-GCGTGGGTTTGTGATCAGTT-3´, R: 5´-GATCTTCTCCTTGCCCA TCC-3´;Rp49F: 5´-CACACCAAATCTTACAAAATGTGTGA-3´, R: 5´-AATCCGGCCTTGC ACATG-3´;RpL11F: 5´-CCATCGGTATCTATGGTCTGGA-3´, R: 5´-CATCGTATTTCTGCT GGAACCA-3´,Ets96BF: 5´-CCTCCATAGACTACCATAT-3´, R: 5´-GTAACTCAACCTCAA TGC-3´;CaBP1F: 5´-GCAGCGTTAGTGCCTTCTATT-3´, R: 5´-CTTTCAGCACCTCCCGG TC-3´;ERp60F: 5´-GACTTTGCCACCACCCTAAAA-3´, R: 5´-TACTCGGGCTTCAATCGC TTG-3´;CrcF: 5´-GAAAACTGGGAGGATACGTGG-3´, R: 5´-GAGAGGTCTGAATGCCT TTGTC-3´;pleF: 5´-CGAGGACGAGATTTTGTTGGC-3´, R: 5´-TTGAGGCGGACCACCA AAG-3´;VmatF: 5´-CGTGACCTTCGGGACGATAG-3´, R: 5´-ACTAGAGCGGGAAAACC AGC-3´; DAT F: 5´-GCTTCAAACCATAAGTTCTAA-3´, R: 5´-TCGGACTTGATATTATCT ACAA-3´
Starvation assay
Starvation resistance assay was performed in a similar fashion as Hergarden et al (2012) [33] Starvation resistance was measured by placing 30, 5 to 7 days old, male flies in individual tubes containing 1% agarose in the Drosophila activity monitoring system (DAMS) (Trikinetics, MA, USA). DAMS was performed at 25°C in an incubator, on a 12h:12h light:dark cycle.
Triacylglycerol determination
triglyceride reagent was added in each standard and sample and incubated at 37°C for 15 min-utes. The final absorbance was taken at 540 nm to calculate triglyceride concentration from the generated standard curve. The protein concentration of each sample was measured by the Bio-Rad (Hercules, CA, USA) protein assay kit. The concentrations of free glycerides and Triglycer-ides in samples (mg/mg of protein) were calculated from five replicates.
Startle-response assay
We measured startle behaviour as described previously [50]. In brief, single 5–7 day old males were placed in a plastic culture vial and subjected to a mechanical disturbance by a gentle, yet sudden, tap of the vial. The vial was then placed horizontally on a bench top. Startle-induced locomotion was calculated as the number of seconds each fly was active within the 60 s period following the startle-induced locomotion. All tests were done at 25°C with 3 hours of lights on. The sample size for all genotypes was N = 50.
DAMS activity assays
Flies were tested using the Drosophila Activity Monitoring System (DAM2, TriKinetics,www. trikinetics.com). Flies were placed in 5mm x 65mm glass tubes during the morning, with food placed at one end of the tube. Flies were continually monitored by the use of a light beam, with the number of beam breaks continuously recorded over a 48 hour period. A light shock or sound shock stimulus was given approximately one day after the animals were first placed in the tubes, at 12 noon. The number of beam breaks during the first four hours the flies were housed in the tube (when the arena is at its most novel and anxiogenic), the half hour prior to the light shock or sound shock stimulus and the hour post light shock or sound shock stimulus were all recorded.
Drug treatment
For the pharmacological manipulations 1% agar with 5% sucrose was used as a vehicle medium. The tyrosine hydroxylase inhibitor, 3-iodo-L-tyrosine (Sigma-Aldrich, Stockholm, Sweden) was mixed into the medium to a final concentration of 3 mM. There day old male flies were transferred and kept on the media for 48 hours.
Drosophila brain immunohistochemistry
Male flies were anesthetized and decapitated, and the proboscis was removed. Heads were placed into a staining glass bowl containing 4% paraformaldehyde in 0.1 M sodium phosphate buffer (PBS) and left to fixate in the dark for 2 hr on ice. After fixation, heads were placed in a petri dish containing 4% agarose, and brains were dissected under a light microscope using fine forceps. Brains were washed four times for 15 min each with 0.1 M PBS. Tissues were blocked in 10% normal goat serum (NGS) for 1 hr. The NGS was then discarded, and tissues were incubated with primary antibodies (Millipore, Darmstadt, Germany, anti-GFP chicken polyclonal diluted 1:200 and Immunostar, Wisconsin, USA, mouse anti-Tyrosine hydroxylase 1:500), diluted in 0.01 M PBS containing 0.25% Triton X-100 (PBX) for 2 days at 4°C. Bowls were sealed with parafilm and aluminium foil. Following 48 hr of incubation, brains were washed four times for 15 min each with 0.01 M PBX and incubated with secondary antibody (ThermoFisher Scientific, MA, USA, goat anti-chicken Alexa Fluor 488 and goat anti-mouse Alexa Fluor 594 goat anti-rabbit), diluted 1:1000 in 0.01 M PBX, overnight. Bowls were sealed with parafilm and aluminum foil. Tissues were washed once with 0.01 M PBX for 15 min and twice with 0.01 M PBS for 15 min. Samples were mounted in Vectashield (Vector Laboratories,