www.nat-hazards-earth-syst-sci.net/14/1391/2014/ doi:10.5194/nhess-14-1391-2014
© Author(s) 2014. CC Attribution 3.0 License.
On the behavior of site effects in central Mexico (the Mexican
volcanic belt – MVB), based on records of shallow earthquakes that
occurred in the zone between 1998 and 2011
A. Clemente-Chavez1, F. R. Zúñiga2, J. Lermo3, A. Figueroa-Soto2, C. Valdés4, M. Montiel1, O. Chavez1, and M. Arroyo1
1División de Investigación y Posgrado, Facultad de Ingeniería, Universidad Autónoma de Querétaro, Centro Universitario, Cerro de las Campanas s/n, Querétaro, Querétaro, C.P. 76010, México
2Centro de Geociencias (CGEO), Juriquilla, UNAM, P.O. Box 1-742, Querétaro, Querétaro, C.P. 76001, México 3Instituto de Ingeniería, UNAM, Ciudad Universitaria, Coyoacán, México D.F., C.P. 04510, México
4Instituto de Geofísica, UNAM, Ciudad Universitaria, Coyoacán, México D.F., C.P. 04510, México
Correspondence to:A. Clemente-Chavez ([email protected])
Received: 11 March 2013 – Published in Nat. Hazards Earth Syst. Sci. Discuss.: 15 November 2013 Revised: 8 August 2013 – Accepted: 6 April 2014 – Published: 4 June 2014
Abstract. The Mexican volcanic belt (MVB) is a seismo-genic zone that transects the central part of Mexico with an east–west orientation. The seismic risk and hazard of this seismogenic zone has not been studied in detail due to the scarcity of instrumental data as well as because seismicity in the continental regime of central Mexico is not too fre-quent. However, it is known that there are precedents of large earthquakes (Mw>6.0) that have taken place in this zone. The valley of Mexico City (VM) is the sole zone, within the MVB, that has been studied in detail. Studies have mainly focused on the ground amplification during large events such as the 1985 subduction earthquake that occurred off coast of Michoacán. The purpose of this article is to analyze the be-havior of site effects in the MVB zone based on records of shallow earthquakes (data not reported before) that occurred in the zone between 1998 and 2011. We present a general overview of site effects in the MVB, a classification of the stations in order to reduce the uncertainty in the data when obtaining attenuation parameters in future works, as well as some comparisons between the information presented here and that presented in previous studies.
A regional evaluation of site effects and Fourier accel-eration spectrum (FAS) shape was estimated based on 80 records of 22 shallow earthquakes within the MVB zone. Data of 25 stations were analyzed. Site effects were es-timated by using the horizontal-to-vertical spectral ratio (HVSR) methodology. The results show that seismic waves
are less amplified in the northeast sites of the MVB with re-spect to the rest of the zone and that it is possible to classify two groups of stations: (1) stations with negligible site am-plification (NSA) and (2) stations with significant site ampli-fication (SSA). Most of the sites in the first group showed small (<3) amplifications while the second group showed amplifications ranging from 4 to 6.5 at frequencies of about 0.35, 0.75, 15 and 23 Hz. With these groups of stations, aver-age levels of amplification were contrasted for the first time with those caused by the subduction zone earthquakes. With respect to the FAS shapes, most of them showed similari-ties at similar epicentral distances. Finally, some variations of site effects were found when compared to those obtained in previous studies on different seismicity regions. These varia-tions were attributed to the location of the source.
1 Introduction
The MVB is related to the subduction of the Rivera and Co-cos plates below the continental North American plate (Singh et al., 2007; Ferrari et al., 2012). In general, the regional tec-tonics in the MVB have shown to be of extensional type with the minimum compressive stress in the north–south direction (Suter et al., 2001). The stress state of the MVB area has been inferred largely from major structures – such as align-ments, faults, and barriers of volcanoes and dikes (e.g., Suter et al., 1995) – because of the scarcity of instrumental seismic-ity data (Zuñiga et al., 2003). Several studies have suggested that due to the morpho-tectonic composition of the MVB, there are significant differences in the behavior of seismic signals originated from subduction earthquakes among sites within the MVB as opposed to other reception sites (e.g., Shapiro et al., 1997; Ferrer-Toledo et al., 2004; Cruz et al., 2009). These studies suggest that the site effects may differ within the entire MVB. However, at present time there are no detailed studies focusing on these characteristics. Most of the studies in the region (e.g., Singh et al., 1988a; Or-daz and Singh, 1992; Chávez-García et al., 1994; Sánchez-Sesma et al., 1995; Singh et al., 1995; Chávez-García and Cuenca, 1996; Reinoso and Ordaz, 1999; Montalvo et al., 2000; Chávez-García and Salazar, 2002) have emphasized the ground response within and around the Valley of Mex-ico (where MexMex-ico City is located, hereafter referred to as VM).
The MVB is a zone of low seismicity compared to other seismogenic sources in Mexico. Few studies dealing with its seismicity characteristics in this region have been pub-lished (e.g., Astiz-Delgado, 1980; Suárez et al., 1994; Suter et al., 1996; Zúñiga et al., 2003; Quintanar et al., 2004). However, earthquakes have occurred in the past within the MVB which caused destruction including the 1568 Jalisco earthquake which had a magnitude Mw estimated between 7.5 and 7.8 (Suárez et al., 1994); the 1912 earthquake oc-curred in Acambay, State of Mexico, withMw=7.0 (Singh
and Suárez, 1987) and the 1920 earthquake which took place near Jalapa, Veracruz with Ms=6.4 (Suárez, 1992). These
types of earthquakes represent an important risk due to their proximity to urban areas.
Previous studies on seismic signal behavior within the MVB, which have been based on the analysis of small zones of the MVB (mainly in or around the VM) have observed that there is variability in the amplified signal depending on the trajectories of analysis (e.g., Cruz et al., 2009) being signifi-cantly higher in the VM (e.g., Singh et al., 1988a, b; Shapiro et al., 1997; Reinoso and Ordaz, 1999). In the VM, ampli-tudes decrease rapidly toward the north (Figueroa, 1986), and the ground motion is commonly associated with longer durations (Kawase and Aki,1989). The velocity of the seis-mic waves is slower as they propagate through the MVB, but higher velocities have been recorded in the north section of the MVB in comparison with the south (Shapiro et al.,
1997). Attenuation values show a low seismic quality factor (Q)Q(Q(f )=98f0.72), as compared to the regionalQ val-ues (Q(f )=273f0.66)(Ordaz and Singh, 1992), determined from analysis of seismic signals recorded at the extremes of a section of the MVB from south to north, including the VM (Singh et al., 2007).
Site effects are attributed to the response of shallow ge-ology. In Mexico, several methods for the evaluation of site effects with the use of ambient noise and earthquake records have been carried out (e.g., Lermo, 1992; Lermo and Chávez-García, 1993, 1994a, 1994b). In particular the so-called standard spectral ratio (SSR) (Borcherdt, 1970) and the horizontal-to-vertical spectral ratio (HVSR) (Lermo and Chávez-García, 1993) have been used. The HVSR method which makes use of ambient noise data, has been employed for seismic microzonation studies worldwide, providing a re-liable fundamental frequency (e.g., Nath et al., 2009; Abd El-Aal, 2010; Gosar et al., 2010). However, the HVSR method when employing data from earthquake signals, besides the fundamental frequency, allows for the estimation a reliable amplification (Lermo and Chávez-García, 1993). Based on the HVSR method with the use of earthquake data, two types of seismic stations can be identified: (1) rock-ground and (2) soft-ground stations. This is possible since negligible site amplification (NSA) values at sites on rock is expected, while significant site amplification (SSA) values at sites on soft-ground (Castro and Ruíz-Cruz, 2005) should be found. How-ever, SSA have occasionally been observed in rock sites (e.g., Tucker et al., 1984; Castro et al., 1990; Humphrey and An-derson, 1992). This classification of sites has been fundamen-tal in several studies of seismic attenuation models in the world in order to confidently estimate how seismic ampli-tude decreases with distance (e.g., Joyner and Boore, 1981; Mandal et al., 2009). In Mexico, the evaluation of site ef-fects has also helped to establish reliable attenuation models (e.g., Ordaz et al., 1989; García, 2006; Clemente-Chavez et al., 2012).
Several studies have included stations within the MVB that have been classified as with NSA, but they did not use the seismicity source types analyzed in this paper (e.g., Singh et al., 2006, 2007; Lozano et al., 2009; García et al., 2009), so currently there is no published study based on seismicity records within the MVB for sources also in the MVB. Even when there are seismic stations located within and around this region, which have been identified as having NSA (e.g., Castro and Ruíz-Cruz, 2005; Singh et al., 2006, 2007; García et al., 2009; Lozano et al., 2009), it is necessary to compare the level of amplification of each station due to local sources to the values observed for regional sources.
Table 1.Earthquakes analyzed in this study.
Earthquake Date Latitude Longitude H M∗ Epicentral Number Epicentral
No. (◦N) (◦W) (km) Location Records DistanceR
(State) (km)
1 18 Mar 1998 20.10 99.23 5 4.3 Hidalgo 6 69–85
2 27 Apr 1998 19.04 98.51 2 4.0 Puebla 1 13
3 4 Mar 2000 18.84 98.57 4 4.1 Puebla 3 26–110
4 12 Mar 2000 20.10 99.29 5 4.1 Hidalgo 3 134–190
5 5 Aug 2001 20.47 103.67 10 4.3 Jalisco 2 143 and 180
6 3 Nov 2002 19.26 98.04 2 4.0 Tlaxcala 2 65 and 182
7 16 Nov 2002 19.17 98.49 9 4.1 Puebla 5 18–226
8 4 Feb 2003 18.92 98.51 2 4.1 Puebla 2 21 and 120
9 28 Apr 2003 19.55 103.46 4 4.0 Jalisco 2 47 and 166
10 16 Nov 2003 19.18 98.97 7 4.0 Distrito Federal 13 11–242
11 5 Dec 2003 19.72 101.25 7 4.3 Michoacán 4 8–263
12 15 Dec 2003 20.35 99.07 4 4.0 Hidalgo 7 7–286
13 7 Oct 2004 20.81 103.48 5 4.2 Jalisco 2 219 and 268
14 5 Jun 2005 19.44 103.55 5 4.2 Colima 2 32 and 157
15 5 Dec 2007 18.64 102.22 4 4.1 Michoacán 2 27 and 153
16 29 Nov 2009 19.36 103.76 5 4.0 Colima 2 50 and 136
17 17 Apr 2010 20.38 98.96 2 4.1 Hidalgo 8 12–251
18 18 May 2010 20.27 99.04 3 4.3 Hidalgo 9 3–281
19 18 May 2010 20.35 98.92 5 3.6 Hidalgo 2 44 and 195
20 20 May 2010 20.34 98.89 2 3.9 Hidalgo 1 167
21 3 Oct 2010 19.48 103.52 6 4.0 Jalisco 3 25–203
22 8 Feb 2011 19.73 104.51 5 4.0 Jalisco 1 147
M∗= Magnitude reported by Servicio Sismológico Nacional (SSN) (http://www.ssn.unam.mx/).
zone. We study the behavior of site effects in the MVB zone based on records of shallow earthquakes (data not reported before) that occurred in this region between 1998 and 2011. We furthermore provide a general overview of site effects in the MVB. A classification of the stations is also given to help future studies of attenuation parameters.
Site effect results based on the type of shallow seismic-ity of this study are compared with results of previous stud-ies (e.g., Singh et al., 2006, 2007; Lozano et al., 2009; Cas-tro and Ruíz-Cruz, 2005). These authors have reviewed only a few stations within or around the MVB based on in-slab seismicity and inter-plate seismicity. None of these studies have focused on showing regional site effect characteristics as presented in this study, much less with earthquakes oc-curring within the MVB. A discussion of some of the FAS shapes found is also given. Finally, a comparison of these re-sults was made with the amplification levels that García et al. (2009) reported for a zone outside the MVB (an area be-tween the Mexican Pacific coast and the MVB); due to the inter-plate seismicity that occurs in the Mexican Pacific. It has been shown that this inter-plate seismicity represents the greatest seismic hazard for central Mexico.
This study presents the first steps for the analysis of re-gional seismic hazard and risk due to the shallow seismicity present in the central zone of Mexico.
2 Data
A total of 80 records of 22 shallow earthquakes were used (see Table 1); of these, 77 records are of earthquakes with magnitudes between 4.0≤M≤4.3 and the three remaining
records correspond to two earthquakes ofM <4. These last three records were included for their contribution to a better evaluation of site effects at DHIG and JUR1 stations (located north of the MVB, see Fig. 1). All the selected earthquakes were recorded at epicentral distances within the range of 3.4 to 286 km and with depths ofH≤10 km and occurred within
the MVB during the period between 1990 and early 2011. The records were provided by the major seismic networks in Mexico (Tables 1 and 2)
For the purpose of obtaining a site effect average for each station, we selected only stations with at least two records. From this group, the first 13 stations in Table 2 were selected (12 seismographic stations and one acelerograph station). All records were converted to acceleration.
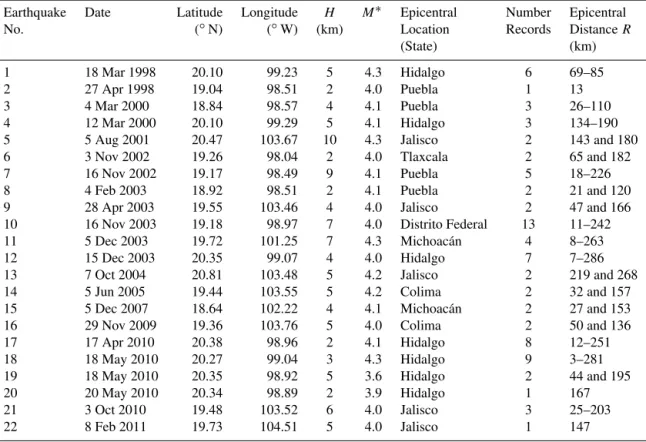
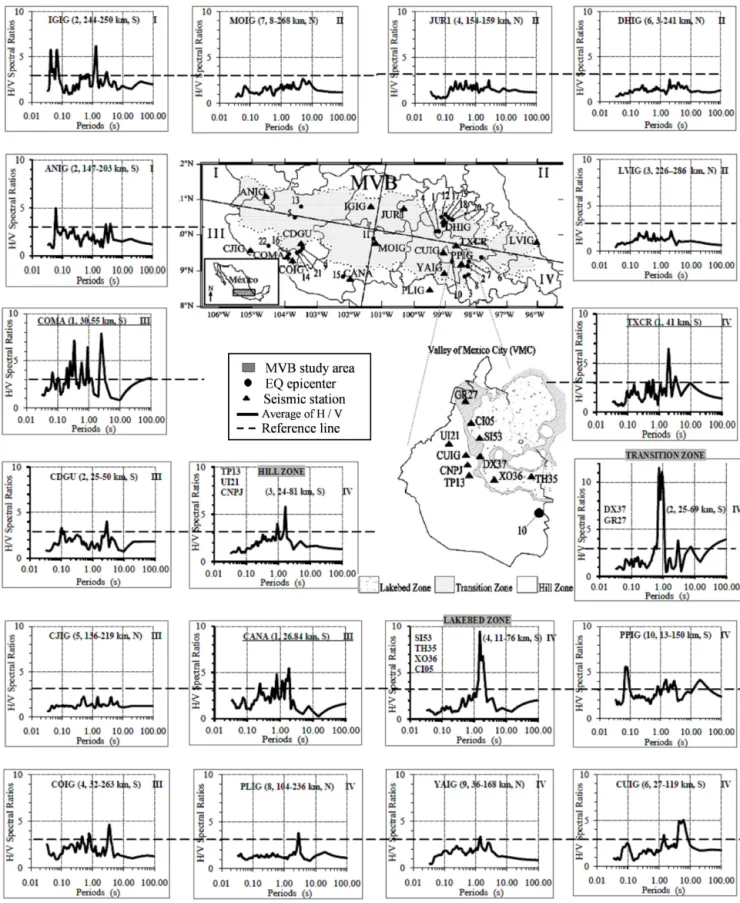
Figure 1.Map of the Mexican volcanic belt (MVB) according to Gómez-Tuena et al. (2005); Location of: epicenters in Table 1, seismic stations in Table 2, and the zone divided in quadrants (solid straight lines) are shown. To the right, the map of the VM located within the Distrito Federal, the stations, and the classification of the three geotechnical zones are also shown.
zone, transition zone and hill zone) (e.g., Reinoso and Ordaz, 1999) in order to obtain three representative H /V averages of each zone, (H /V represent the spectral ratio of the com-ponent horizontal to vertical. It was not possible to group the last 3 stations due to their geographic dispersion, so the site effects were estimated separately.
The location of earthquakes and the stations are shown in Fig. 1, a division of the zone in four quadrants is also shown and will be discussed later.
3 Methodology
The horizontal-to-vertical spectral ratio (HVSR) method (Lermo and Chávez-García, 1993) was used to estimate the site effects. First, the records were visually inspected to select signals that are complete and that had a good signal-to-noise ratio (S / N)≥2.0. A baseline correction was applied to all
the signals. For the spectral analysis only the strong ground motion was considered (this according to the criteria recom-mended by Castro et al., 1997), taking different time-window lengths of 5 to 40 s starting from the S-wave onset.
Two software packages were used for data processing: Degtra (Ordaz and Montoya, 2000) and Geopsy (Geophys-ical Signal Database for Noise Array Processing) (SESAME WP05, 2002). The results of these programs were compared because they have a different smoothing function in obtain-ing FASs, which are the basis to evaluate theH /V spectral ratios.
To determine the HVSR transfer functions, the FASs were calculated for the three components of each record. This is done automatically when estimating theH /V ratio with the Geopsy software. For the calculation of FAS for each selected window, a smoothing function defined in Eq. (1) (Konno and Ohmachi, 1998) was applied with a bandwidth coefficient ofb=40 and a 5 % cosine taper-window. This
type of smoothing function employs a different number of points at low and high frequency; its use is strongly recom-mended for frequency analysis (Konno and Ohmachi, 1998). The results are very similar in comparison with Degtra soft-ware results with a smoothing factorFS=6, which contains
another type of smoothing function defined in Eq. (2). A comparison of these results is shown in Fig. 2.
As(f, fc)=
" sinlog
10(f, fc)b log10(f, fc)b
#4
, (1)
As(f )2= 1
N X
A(f )2, (2)
f1=f.2(−
1
2FS)f2=f.2(
1 2FS).
In Eq. (1), As(f, fc) represents the smoothed amplitude;
Table 2.Classification of the database by seismic network with its stations.
Institution Seismic Station Site Number of records Instrument type network name geology /Station /Network /Network %
Servicio Sismológico Nacional SSN (IG- PPIG Rock 10 62 77.5 Broadband seismographs. Most (SSN), Instituto de Geofísica (IG) UNAM) YAIG Rock 9 of them are composed of a Universidad Nacional Autónoma PLIG Rock 8 STS-2 sensor and Q330 de México (UNAM) MOIG Rock 7 digitizer. Most of their
CUIG Rock 6 recordings are at 80 samples DHIG Rock 6 per second (sps), while a few CJIG Rock 5 are at 100 sps.
COIG Rock 4 LVIG Rock 3 IGIG Rock 2 ANIG Rock 2
Centro de Geociencias (CGEO) CGEO JUR1 Rock 4 4 5.0 Broadband seismograph. in Juriquilla, Querétaro, (UNAM) Composed of a Trillium 120P
Campus UNAM sensor and a Taurus digitizer.
All its records are at 100 sps. Instituto de Ingeniería II- CDGU Rock 2 5 6.3 Accelerographs. With Etna (II), UNAM (UNAM) COMA Rock 1 episensor. Their records are at
CANA Rock 1 100, 200 or 250 sps. TXCR Rock 1
Centro de Instrumentación CIRES CI05 Clay 1 8 10 Accelerographs. Models SSA-1 y Registro Sísmico A.C. GR27 Clay 1 and RAD-851. Most of their (CIRES) UI21 Sand 1 recordings are at 200 sps, while
DX37 Clay 1 a few are at 100 sps. SI53 Clay 1
TH35 Clay 1 TP13 Sand 1 XO36 Clay 1
Centro Nacional de Prevención CENAPRED CNPJ Rock 1 1 1.2 Accelerograph. Model Altus de Desastres (CENAPRED) K2. Its record is at 100 sps.
80
The results of both programs did not show significant differences. Each program had advantages according to the available tools. Geopsy software was used to evaluate spec-tral ratiosH /V, and Degtra software to estimate FAS shapes separately for each horizontal component.
We obtained HVSR transfer functions for all the records of the 25 stations. For this purposeHwas defined as the square average of FAS of the horizontal components. Afterwards, for each group of earthquakes recorded at each station site, H /V averages were calculated with their standard deviations and plotted on a logarithmic scale.
Finally, FASs were obtained for each horizontal compo-nent of records of earthquakes with greater azimuthal cover-age. This was performed with the aim of qualitatively ana-lyzing the behavior of the shapes and amplitudes in the FASs for different trajectories of seismic wave propagation.
4 Results and discussion
Figure 3 shows averages and standard deviations of theH /V spectral ratios for the 13 stations analyzed as well as for the
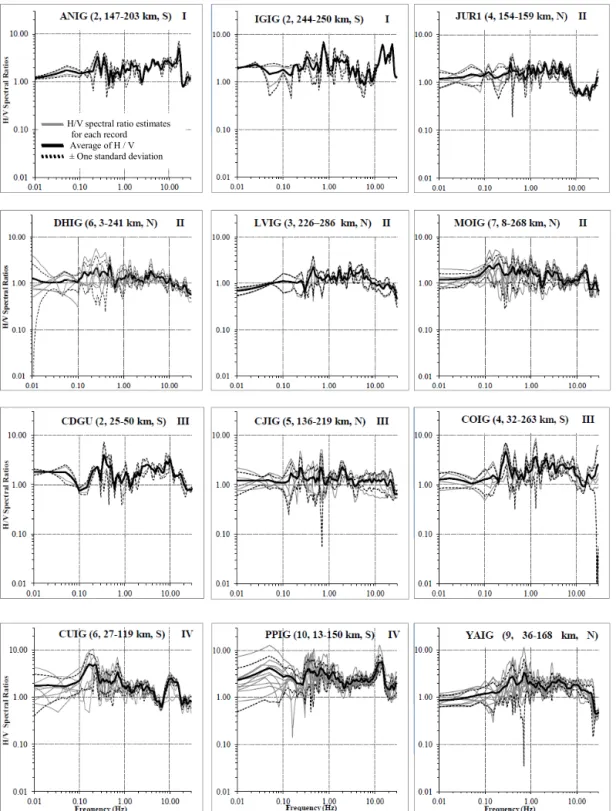
three zones within the VM (Fig. 1) in order to estimate the site effects. Moreover, Table 3 shows all the estimated site effects grouped by quadrants in the MVB. Results are given for the fundamental frequency (fo), the amplification factor (Ao) and values of other peaks in frequencies with smaller amplitudes.
Most of the ratios of Figs. 3 and 4 show a greater and more frequent variability at a frequency of about 0.5 Hz as com-pared to other frequencies. This coincides with the observa-tions of Singh et al. (2007) who analyzed inter-plate earth-quake data from two stations in order to estimateQfor a strip in the MVB. On the other hand, Table 3 and Fig. 5 show that stations LVIG, DHIG, JUR1 and MOIG can be consid-ered as reference stations to estimate relative amplification in the MVB zone, due to a lowAo(Ao<2.7), as well as an almost flat level in theH /V spectral ratio.
Table 3.Results of the estimation of site effects grouped by quadrants in the MVB. It shows the following: fundamental frequency identifi-cation (fo), amplified factor (Ao), the classification of the amplification level at each seismic station site, values of other peaks at frequencies with smaller amplitudes and the number of records used in each evaluation of the sites.
Quadrant Station name fo Ao Classification f1 A1 f2 A2 f3 A3 Number
no. or zone (Hz) of the site (Hz) (Hz) (Hz) of
amplification level Records
I ANIG 16.58 4.97 S 0.25 3.36 0.35 3.29 – – 2
IGIG 0.75 6.20 S 23.59 5.80 14.82 5.80 – – 2
II JUR1 0.37 2.52 N 0.92 2.20 2.10 2.45 4.56 2.40 4 DHIG 0.50 2.46 N 0.25 2.13 0.35 1.78 – – 6 LVIG 0.45 2.23 N 1.65 1.95 2.89 2.16 5.06 2.00 3 MOIG∗ 0.20 2.65 N 0.13 2.43 0.40 2.31 1.00 2.07 7
III CDGU 0.35 4.02 S 8.19 2.95 9.85 3.31 – – 2
CJIG 1.94 2.26 N 0.67 2.23 0.23 2.19 – – 5 COIG 0.28 4.64 S 1.30 3.72 2.17 3.37 – – 4
IV CUIG 0.17–0.22 5.05–4.93 S 0.70 3.40 10.75 2.54 – – 6 PPIG 12.52–14.01 5.53–5.61 S 0.67 4.20 0.05 4.19 0.35 4.05 10 YAIG 0.70 3.35 N 0.40 2.75 4.05 2.37 – – 9
PLIG 0.35 3.81 N – – – – – – 8
HILL 0.60 5.83 S 1.07 3.98 – – – – 3
TRANSITION 1.33 11.56 S 1.07 11.11 0.33 3.82 0.13 3.16 2
LAKEBED 0.67 9.48 S – – – – – – 4
S=Significant, N=Neglible.∗Considered in quadrant II, due to its behavior inH /Vspectral ratio, in addition to its central location in the MVB.
Figure 2.Comparison ofH /V results of the Geopsy and Degtra softwares are shown. Observe that the ratios are similar although the smoothing functions are different.
of period and according to its geographical position associ-ated to each site. Information of this type is often used to relate with the structural periods in order to evaluate the ex-pected damage due to an earthquake.
Figure 5 shows the following key points in each MVB quadrant:
1. The sites evaluated in quadrant II indicate lesser ampli-fications than the sites at other quadrants. On the con-trary, the greatest amplifications of seismic signals
oc-cur – in decreasing order – at sites in quadrants I, IV and III, with an amplification factor of up to 6.2, mostly at low frequencies of 0.1 to 2 Hz (or 10 to 0.5 s);
2. All sites of the four quadrants have up to three peaks with amplitudes of around 2, except for PLIG, which presents a single well-defined peak. This could be a clear difference in site effects for stations within and outside the MVB, since PLIG is regarded as outside the MVB. CJIG station, also outside the MVB, shows sim-ilar behavior.
3. Important differences on the averages of site effects for two of the three zones within the VM were iden-tified with respect to those given by Reinoso and Or-daz (1999) in their analysis based on large earthquakes (magnitude between 7.4 and 8.1) of the subduction type. In the transition zone our results are similar to those of Reinoso and Ordaz (1999). On the other hand, in the southern part of the lakebed zone, our results do not show large values (values between 50 and 75) of am-plification in the range of 3 to 4 s as those obtained by these authors for this period. However, our results agree with them in a second peak at approximately the 1.5 s period with amplification of about 10.
H/V spectral ratio estimates for each record Average of H / V ± One standard deviation
Figure 3.Averages ofH /V spectral ratios±one standard deviation for all stations are shown. The headers in each graph correspond to the following nomenclature: Station (Number of records, epicentral distance range in km, site classification:N=negligible site amplification or S=significant site amplification) and quadrant number.
Lermo and Chávez-García, 1993; Bard, 1999; Castro and Ruíz-Cruz, 2005; García et al., 2009). They consider a site as having an NSA whenAo is≤2.5–3.0 at the
fundamen-tal frequencyfo(as it occurs for most hard-rock sites) and, conversely, they assign an SSA label to sites with Ao>3.
Figure 3.Continuation of Fig. 3. The last three graphs correspond to averages of grouped stations within each geotechnical zone in the VM, this according to the Fig. 1.
3.35 and 3.81. This is because: (a) they have a flat response (H /V <2) for most of the frequency range (0.01 to 30 Hz) (see Figs. 3 and 5); and (b) their site amplification values do not significantly alter the average for this group of stations (see Fig. 4).
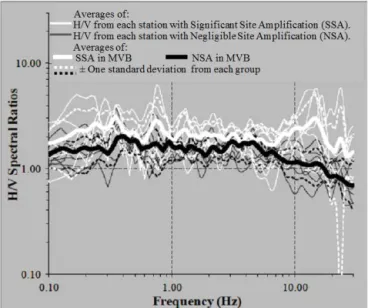
In order to show the behavior and differences between the two groups of stations (with clasification NSA and SSA), we estimated the averages for both groups. These averages are shown in Fig. 4, which indicate that the main differences lie in the low frequency range of 0.1–1.0 Hz. The averages of the three zones within the VM were not considered in the above averages because they do not represent the general character-istics of the MVB, due to the large amplifications observed for that particular region. Only CUIG station has been in-cluded for such averages since itsH /V ratio is close to those which represent site effects within the MVB.
Of the stations analyzed in this study it is clear that a low amplification occurs in quadrant II, compared to the rest of the MVB area. The causes of this behavior can be due to the wave velocity in the north being higher than in the southern part of the MVB as reported by Shapiro et al. (1997) for a strip in the zone. These authors associated this low veloc-ity zone with the migration of volcanic activveloc-ity from north to south, such as reported in Robin (1981). Recently, Singh et al. (2007) reported a higher attenuation, – lowQ– in the northern part of the MVB with respect to the forearc (based on the station DHIG). Jödicke et al., 2006 also showed a correlation between this lowQand a low resistivity region.
Figure 4.Comparison of the behavior and differences of site am-plification between the two groups of stations within the MVB: (1) with SSA and (2) with NSA. Both groups are shown with±1 stan-dard deviation. Observe that the main differences are in the low frequency range of 0.1–1.0 Hz. Averages of all the stations, which form each group, are also shown.
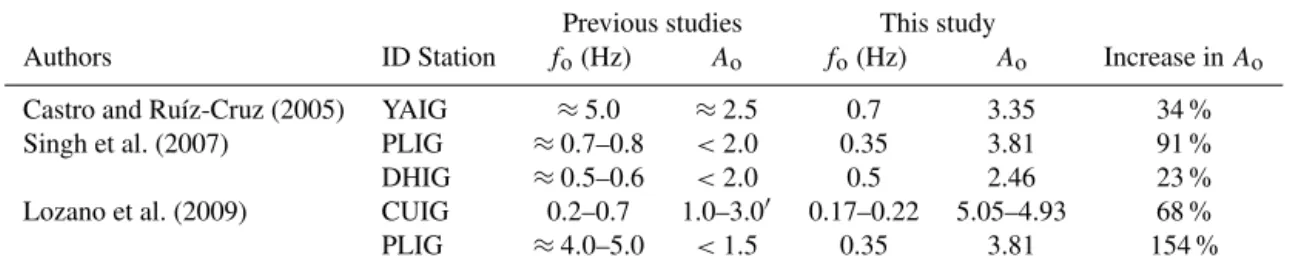
Table 4.Comparisons ofAoandfo(at sites of stations), reported in previous studies with the results of this study.
Previous studies This study
Authors ID Station fo(Hz) Ao fo(Hz) Ao Increase inAo
Castro and Ruíz-Cruz (2005) YAIG ≈5.0 ≈2.5 0.7 3.35 34 %
Singh et al. (2007) PLIG ≈0.7–0.8 <2.0 0.35 3.81 91 %
DHIG ≈0.5–0.6 <2.0 0.5 2.46 23 %
Lozano et al. (2009) CUIG 0.2–0.7 1.0–3.0′ 0.17–0.22 5.05–4.93 68 %
PLIG ≈4.0–5.0 <1.5 0.35 3.81 154 %
(≈results observed in their results).
With respect to FAS, several FAS shapes of the horizontal components were estimated, in order to compare the decay of the amplitudes at each signal frequency with respect to the epicentral distance. This was made for earthquakes 10, 17 and 18 in Table 1, which have the largest number of records in quadrants I, II and IV, despite having a similar magnitude. The locations and FAS shapes of these earthquakes for each site are shown in Fig. 6. From this, the following aspects can be discerned:
1. In quadrants II and IV, the FAS estimated near the source of earthquakes 10 and 18, registered at YAIG and DHIG at distances of 37 and 3 km, respectively, show that their largest amplitudes occur at high frequencies (range 15 to 20 Hz). These FASs are similar to the FASs at the source according to the model presented by Had-don (1996);
2. In records at distances greater than 100km, the highest amplitudes of the FAS shapes are in the range of fre-quencies from 1 to 10 Hz. This occurs at sites in quad-rants I, II and IV, except for YAIG station, which retains its highest amplitudes at high frequencies of around 21 Hz;
3. The values of the maximum amplitudes are very sim-ilar between quadrants I, II and IV, except for earth-quake 17, recorded at stations IGIG, MOIG and PLIG. It showed greater attenuation at low frequencies (f ≤
6 Hz) than at high frequencies (about 15 Hz);
4. The FAS shapes obtained from each horizontal compo-nent for each record showed little variability between them. The largest difference takes place at low frequen-cies (less than 1 Hz).
In Fig. 7, an analogous analysis to that shown in Fig. 6 was made for earthquake no.11 whose epicenter is in the center of the MVB, recorded in three sites located in quadrants II, III and IV. There was a fourth record at MOIG station, which is located at a close distance from the epicenter (R=8.5 km).
The three records are from DHIG, COIG and PLIG sta-tions, with similar epicentral distances (with an average of R=247 km). Key points from this analysis are:
1. The FAS obtained close to the source, from the record in MOIG station, shows its maximum amplitudes at about 1 Hz as opposed to previous cases, in which their maxi-mum amplitudes appeared at high frequencies (range 15 to 20 Hz), for similar epicentral distances (3 and 12 km) as MOIG station (R=8.5 km);
2. When the four FAS shapes are superimposed (Fig. 7g), it is clear that the signal at DHIG presents larger atten-uation in the 0.3 to 10 Hz frequency range;
3. To better understand the latter point, the seismograms recorded at the four stations are shown in Fig. 7f. In DHIG record, smaller amplitudes are observed at high frequencies as well as, partially, at low frequencies com-pared to the other north–south records.
Comparing our results to those from previous studies, we find the following.
Chávez-García and Tejeda-Jácome (2010) presented an evaluation of site effects in Tecoman, Colima, Mexico, an area close to the MVB. These authors used inter-plate earth-quake records with epicentral distances of about 100 km. In their results they reported two peaks. The first peak is the fundamental frequency of the site that varies between 0.5 and 0.7 Hz, with an amplification factor that varies between 6 and 8. A second smaller amplitude peak was also shown in their results, with an amplification of about 4 in the range of 1.2 to 2.1 Hz.
Of all the sites analyzed in the present study, the closest to Tecoman is the COIG station. In the present study, three well-defined peaks instead of only two were identified for that site. The first peak corresponds to a fundamental frequency fo=0.28 Hz with amplification factorAo=4.64; these
val-ues differ from those reported in the Tecoman study. The two other peaks (f1=1.30 Hz withA1=3.72 andf2=2.17 Hz
withA2=3.37) are similar to the second peak values
re-ported in the Tecoman study.
≈
MVB study area EQ epicenter Seismic station North-south components
East-west components
Figure 6.Comparisons of the amplitudes decay among the Fourier acceleration spectra (FAS) of earthquakes 10, 17 and 18 ecorded in different places within the MVB are shown (earthquakes of the Table 1 with the largest record number and similar magnitudeM=4). FAS shapes correspond to the horizonal components. The legends in each graph indicate: earthquake number, epicenter location, and epicentral distance. (HGO=Hidalgo State, DF=Distrito Federal).
occurred at the Mexican Pacific coast. They obtainedH /V averages for two groups of stations with NSA: (a) a group of inland stations and (b) a second group made up of coastal stations (see Fig. 8). Figure 8 shows the differences in site amplification averages of stations on rock at regional level, classified with NSA, outside and inside of the MVB.Asseen
MVB study area
EQ epicenter Seismic station North-south components East-west components
Figure 7.In the panels(a–e)Fourier acceleration spectra (FAS) of earthquake 11 for the station sites MOIG, COIG, PLIG and DHIG (with similar epicentral distances) are shown; In panel(f)seismograms of the north–south component of the COIG, DHIG and PLIG stations (where the DHIG station shows longer periods than the other stations) are also shown; and in panel (g)FAS shapes of the north–south components of the four stations are superimposed, where the greater attenuation is observed at DHIG site (at frequencies of 0.3 to 10 Hz) with respect to COIG and PLIG sites.
average levels of amplification at MVB station sites are very similar to the levels of both groups of stations (inland stations and coast stations).
Finally, Table 4 shows other comparisons of Ao andfo from previous studies (which were based on inter-plate seis-micity), with the results of this study. This is for specific sta-tions. In general, the main differences are inAowith an in-crement to up a 150 % compared to previous studies.
Regarding the instrumental response correction, it was done based on the generic value of station gain provided by Servicio Sismológico Nacional (SSN) from an instrument calibration sheet (station with STS-2 sensor and Q330 dig-italizer). On the other hand, we did some tests for the in-strumental response correction (deconvolution process) with two methods, in order to compare and validate our H /V results. First, we performed a deconvolution process (with use of the constant, poles and zeros; from factory informa-tion) and second, with the use of the value of station gain;
this was performed for the JUR1 station (Trillium 120 – TR120-broadband seismograph with similar instrumental flat response to the SSN stations), for which we have the com-plete information from factory (see technical information in Figueroa et al., 2010). TheH /V results are shown in Fig. 9, where we can see that the H /V shapes are identical. This is due to the range of frequency content of the analyzed earthquakes in our study (0.01–40 Hz) which are within the flat range of the typical instrumental response for broadband seismographs. Thus, we performed the same procedure for all the SSN stations.
Figure 8.Comparisons of averages of site effects with NSA between those reported by García et al. (2009) – sites with trajectories in the subduction zone – and the results of this study are shown. The results of García et al. (2009) are shown for(a)inland stations and(b)coastal stations, this based on records of the inter-plate seismicity of the Mexican Pacific coast. Observe: in(a)an higher amplification factor in MVB sites than the amplification level of inland stations, this of up to 1.5 times at the frequency of 0.36; and in(b)the comparison between the MVB sites with averages of the coastal stations, the behavior is similar.
than the amplitude of the electronic noise of the instrument, then the H /V results are excellent. In our study, we have accelerometer data, but these are records at close epicentral distances (11–81 km) within the Mexico City area, where the ambient noise is much higher than the electronic noise level; furthermore our H /V results are acceptable because we can identify clear peaks for the fundamental frequencies of 0.6–1.33 Hz (this in last three graphics of the Fig. 3).
Another point worth discussing is the possibility that the different choice of the window employed in our analysis might bias the estimation of the fundamental frequency, in particular with reference to the results shown in Table 4. Thus, we performed a test with two different windows. We selected only the S-wave trend, with the criteria according to Castro et al. (1997), and compared it to our results from the whole record. The record used was the same from JUR1 station shown in Fig. 9. The H /V results are displayed in Fig. 10. Using an S-wave window alone as opposed to the complete record, we can see that both show the same fre-quency peaks; the only difference being lower amplitudes at low frequencies. This effect is similar to the effect reported by Parolai and Richwalski (2004) when the choice window is different.
5 Conclusions
The Mexican volcanic belt (MVB) is a seismogenic zone that has not been studied in detail in terms of its hazard. This is due to the scarcity of data and the low seismicity in the conti-nental regimen of central Mexico. However, there are prece-dents of large earthquakes (Mwmagnitude greater than 6.0) within the MVB. In this study, seismic data from this seis-mogenic zone were gathered in order to advance the under-standing about the expected regional hazard and seismic risk in central Mexico. Eighty records of 22 shallow earthquakes (obtained from 25 stations belonging to the main seismic networks of Mexico during the last 13 years) that occurred within the MVB zone were used to determine site effects and Fourier Acceleration Spectra (FAS). The purpose of this study was to show a general overview of the behavior of site effects in the zone, a classification of seismic stations and to compare with previous studies.
In general, our study yielded the following results: 1. A difference in the level of amplification in the MVB
Figure 9. Example of instrumental response correction with two methods: SSN station gain and factory data. TheH /V results show identical shapes. The earthquake record used corresponds to the number 18 of the Table 1 with magnitude 4.3 and epicentral dis-tance of 154 km.
behavior covers a greater area of the MVB, correspond-ing to approximately a quarter of the total MVB area. The average H /V spectral ratios indicate an amplifi-cation factor of 2.5 at a frequency of 0.38 Hz. On the other hand, the attenuation of the signals was analyzed qualitatively with FAS shapes to examine the difference in behavior (e.g., frequency ranges for the maximum amplitudes) between different propagation trajectories within the MVB. FAS shapes obtained for the horizontal component records showed a uniform behavior within the MVB, mainly for frequenciesf ≥1 Hz. However,
only one trajectory showed greater attenuation in the northeast part of the MVB. This trajectory starts from the center to the northeast of the zone (see Fig. 7). 2. From the 13 stations on rock sites analyzed, two groups
were identified: (1) seven stations with negligible site amplification (NSA) and (2) six stations with signifi-cant site amplification (SSA). The first group of stations in general showed amplification factors of 4 to 6.5 at frequencies of about 0.35, 0.75, 15 and 23 Hz. From this classification, the first group shows an amplifica-tion average similar to the sites analyzed by García et al. (2009) for coastal stations, which were also classi-fied as negligible.
3. NSA and SSA average levels of amplification based on shallow seismicity within the MVB region are analyzed for the first time. We observed amplification differences with respect to the zones outside of the MVB (in partic-ular between the Mexican Pacific coast and the MVB). The most important difference is that in the MVB there
Figure 10.Comparison ofH /V results with the use of different window longitude to analysis. The dotted lines show the same peaks at same frequencies in bothH /V shapes.
is an amplification of up to 1.5 times more than that found by García (2009) for the Pacific coast in the fre-quency of 0.36 Hz. This result highlights the relevance of further studying the hazard within the MVB. Finally, the dependence of site effects results on the charac-teristics of the source was analyzed. Variations of site effects were found when compared to those obtained in previous studies on different seismicity regions. These variations were attributed to the location of the source. Moreover, we iden-tified more than one peak as the fundamental frequency (we attribute such behavior as typical of the MVB), as opposed to previous studies, in which only one peak was identified.
Acknowledgements. The authors are grateful to CONACYT,
En-gineering Institute-UNAM, Geosciences Center-UNAM, Institute of Geophysics-UNAM, CIRES and CENAPRED for their support and collaboration in this research. In particular to Mario Gus-tavo Ordaz Schroeder for his help in obtaining the data. Finally, Alejandro Clemente-Chavez wants to thank CONACYT-Mexico for this funded support for his PhD studies under the project number 227579.
Edited by: T. Glade
Reviewed by: three anonymous referees
References
Astiz-Delgado, L. M.: Sismicidad en Acambay, Estado de México, El temblor del 22 de febrero de 1979, B.Sc. Thesis Universidad Nacional Autónoma de México, Mexico City, 130 pp., 1980. Bard, P.-Y.: Microtremor measurements: a tool for site effect
es-timation?, State-of-the-art paper, Second International Sympo-sium on the Effects of Surface Geology on seismic motion, Yoko-hama, 1–3 December 1998, edited by: Irikura, Kudo, Okada & Sasatani, Balkema, Rotterdam, 3, 1251–1279, 1999.
Borcherdt, R. D.: Effects of local geology on ground motion near San Francisco Bay, Bull. Seism. Soc. Am., 60, 29–61, 1970. Castro, R. R. and Ruíz-Cruz, E.: Stochastic Modeling of the 30
September 1999 Mw 7.5 Earthquake, Oaxaca, Mexico, Bull. Seism. Soc. Am., 95, 2259–2271, 2005.
Castro, R. R., Anderson, J. G., and Singh, S. K.: Site response, attenuation and source spectra of S waves along the Guerrero, México, subduction zone, Bull. Seism. Soc. Am., 80, 1481– 1503, 1990.
Castro, R. R., Mucciarelli, M., Pacor, F., and Petrungaro C.: S-wave site response estimates using horizontal-to-vertical spectral ra-tios, Bull. Seism. Soc. Am., 87, 256–260, 1997.
Chávez-García, F. J., and Cuenca, J.: Site effects in Mexico City urban zone. A complementary study, Soil Dyn. Earthquake Eng., 15, 141–146, 1996.
Chávez-García, F. J. and Salazar, L.: A model to explain site re-sponse at Mexico City, Bull. Seism. Soc. Am., 92, 3087–3101, 2002.
Chávez-García, F. J. and Tejeda-Jácome, J.: Site response in Teco-man, Colima, Mexico-I: Comparison of results from different in-struments and analysis techniques, Soil Dyn. Earthquake Eng., 30, 711–716, 2010.
Chávez-García, F., Sánchez-Sesma, F. J., Campillo, M., and Bard, P.-Y.: El terremoto de Michoacán de Septiembre de 1985: efectos de fuente, trayecto y sitio, Física de la Tierra, 6, 157–200, 1994. Clemente-Chavez, A., Arroyo, G., Moisés, Zúñiga Ramón, Figueroa Ángel, Pérez Miguel A., and López Carlos S.: Relación de atenuación del movimiento del suelo para la aceleración máx-ima (PGA) sobre el Cinturón Volcánico Mexicano (MVB); análi-sis por trayectoria: Guerrero-Querétaro, Revista de Ingeniería Sísmica, 87, 67–93, 2012.
Cruz, J. H., Chávez, G. F., and Furumura, T.: Differences in attenu-ation of ground motion perpendicular to the mexican subduction zone between Colima and Guerrero: An explanation based on numerical modeling, Bull. Seism. Soc. Am., 99, 400–406, 2009. Ferrer-Toledo, H., Chávez-García, F., and Cárdenas-Soto, M.: Ground motion in Central Mexico. Path effects due to the Trans-mexican Volcanic Belt, 13th World Conference on Earhquake Engineering, Vancouver, B.C., Canada, 1-6 August, 13 WCEE, Vancouver, BC, Canada, paper no. 948, 2004.
Ferrari, L., Orozco-Esquivel, T., Manea V., and Manea, M.: The dy-namic history of the Trans-Mexican Volcanic Belt and the Mex-ico subduction zone, Tectonophysics, 522/523, 122–149, 2012. Figueroa, J.: Isosistas de grandes temblores ocurridos en la
República Mexicana, Serie Amarilla del Instituto de Ingeniería, Universidad Nacional Autónoma de México, México, DF, 1986. Figueroa, A., Clemente-Chávez, A., and Zúñiga, R.: Decon-volución de sismogramas digitales y determinación del ruido sísmico para el sismógrafo Trillium 120 instalado en el campus Juriquilla de la UNAM, Bol-e Órgano de comuni-cación electrónica del Centro de Geociencias de la UNAM,
6, http://www.geociencias.unam.mx/~bole/bole/page1/page29/ files/fe7b6457275b6460b9f86be2f9bfba89-0.html, 2010. García, D.: Estimación de parámetros del movimiento fuerte del
suelo para terremotos interplaca e intraslab en México central, PhD thesis, Universidad Complutense de Madrid, Spain, 2006. García, D., Singh, S. K., Herraiz, M., Ordaz, M., Pacheco, J. F.,
and Cruz-Jiménez, H.: Influence of subduction zone structure on coastal and inland attenuation in Mexico, Geophys. J. Int., 179, 215–230, 2009.
Gómez-Tuena, A., Orozco-Esquivel, T., and Ferrari, L.: Petrogé-nesis ígnea de la faja volcánica transmexicana, Boletín de la Sociedad Geológica Mexicana, Vol. Conmemorativo del Cente-nario, Temas selectos de la Geología Mexicana, Tomo LVII, Re-vista BSGM, 227–283, 2005.
Gosar, A.: Site effects and soil-structure resonance study in the Ko-barid basin (NW Slovenia) using microtremors, Nat. Hazards Earth Syst. Sci., 10, 761–772, doi:10.5194/nhess-10-761-2010, 2010.
Haddon, R. A. W.: Earthquake Source Spectra, Bull. Seism. Soc. Am., 86, 1300–1313, 1996.
Humphrey, J. R. and Anderson, J. G.: Shear-wave attenuation and site response in Guerrero, Mexico, Bull. Seism. Soc. Am., 82, 1622–1645, 1992.
Jödicke, H., Jording, A., Ferrari, L., Arzate, J., Mezger, K., and Rüpke, L.: Fluid release from the subducted Cocos plate and par-tial melting of the crust deduced from magnetotelluric studies in Southern Mexico: Implications for the generation of volcanism and subduction dynamics, J. Geophys. Res., 111, 1–22, 2006. Joyner, W. B. and Boore, D. M.: Peak horizontal acceleration and
velocity from strong-motion records including records from the 1979 imperialvalley, California, earthquake, Bull. Seism. Soc. Am., 71, 2011–2038, 1981.
Kawase, H. and Aki, K.: A study on the response of a soft basin for incident S, P, rayleigth waves with special reference to the long duration observed in Mexico City, Bull. Seism. Soc. Am., 79, 1361–1382, 1989.
Konno, K. and Ohmachi, T.: Ground-motion characteristics esti-mated from spectral ratio between horizontal and vertical com-ponents of microtremor, Bull. Seism. Soc. Am., 88, 228–241, 1998.
Lermo, J.: Observaciones de Microtremores y su aplicación en Inge-niería Sísmica. Tesis de Maestría, Facultad de Ciencias, UNAM, Mexico City, 1992.
Lermo, J. and Chávez-García, F. J.: Site effect evaluation using Spectral ratios with only one station, Bull. Seism. Soc. Am., 83, 1574–1594, 1993.
Lermo, J. and Chávez-García, F. J.: Are microtremors useful in site response evaluation?, Bull. Seism. Soc. Am., 84, 1350–1364, 1994a.
Lermo, J. and Chávez-García, F. J.: Site effect evaluation at Mex-ico City: dominant period and relative amplification from strong motion and microtremor records, Soil Dyn. Earthquake Eng., 13, 413–423,1994b.
Lozano, L., Herreaiz, M., and Singh, S. K.: Site effect study in cen-tral Mexico usingH /V and SSR techniques: Independence of seismic site effects on source characteristics, Soil Dyn. Earth-quake Eng., 29, 504–516, 2009.
2001Mw7.7 Bhuj earthquake sequence (2001–2006), Gujarat, India, Pure Appl. Geophys., 166, 451–469, 2009.
Montalvo, J. C., Reinoso E., and Sánchez-Sesma, F. J.: Diferencias en el movimiento sísmico observado en la zona de lomas, Ciudad de México, Memorias del primer simposio de riesgos geológi-cos y ambientales en la ciudad de México, Ciudad Universitaria, México, 2000.
Nath, S.K. and Thingbaijam, K. K. S.: Seismic hazard assessment – a holistic microzonation approach, Nat. Hazards Earth Syst. Sci., 9, 1445–1459, doi:10.5194/nhess-9-1445-2009, 2009.
Ordaz, M. and Montoya, C.: DEGTRA A4 Ver. 5.4.0, Instituto de Ingeniería, Universidad Nacional Autónoma de México, Mexico City, 2000.
Ordaz, M. and Singh, S. K.: Source spectra and spectral attenuation of seismic waves from mexican earthquakes, and evidence of am-plification in the hill zone of Mexico City, Bull. Seism. Soc. Am., 82, 24–43, 1992.
Ordaz, M., Jara, J. M., and Singh, S. K.: Riesgo sísmico y espectros de diseño en el Estado de Guerrero, Mem. VIII Congr. Nac. Ing. Sísmica, Acapulco, México, 16–19 Noviembre, D40–D56, 1989. Parolai, S. and Richwalski, S. M.: The Importance of Converted Waves in ComparingH /V and RSM Site Response Estimates, Bull. Seism. Soc. Am., 94, 304–313, 2004.
Quintanar, L., Rodríguez-González, M., and Campos-Enríquez, O.: A Shallow Crustal Earthquake Doublet from the Trans-Mexican Volcanic Belt (Central Mexico), Bull. Seism. Soc. Am., 94, 845– 855, 2004.
Reinoso, E. and Ordaz, M.: Spectral ratios for Mexico City from free-field recordings, Earthquake Spectra, 15, 273–95, 1999. Robin, C.: Relations volcanologie-magmatologie-géodynamique:
application au passage entre volcanismes alcalin et andésitique dans le sud mexicain, Thése de doctorat, Université de Clermont-Ferrand II, Clermont-Clermont-Ferrand, 1981.
Sánchez-Sesma, F. J., Pérez-Rocha, L. E., Rodríguez-Zúñiga, J. L., and Flores-Cruz, F.: Efectos de sitio en la ciudad de México a 10 años de los sismos de 1985, La Ingeniería Civil a 10 años de los sismos de 1985, Mexico DF, Simposio Internacional, Septiem-bre 1995, 56–70, 1995.
SESAME WP05: Site effects assessment using ambient excitations. Optimum deployment strategy for array measurements. Euro-pean Commission - Research General Directorate Project No. EVG1 CT 2000-00026 SESAME. SESAME European research project WP05- Deliverable D07.05, Geopsy was developed by Laboratoire de Géophysique Interne et Tectonophysique (LGIT) Grenoble, France and University of Potsdam, Germany, 2002. Shapiro, N. M., Campillo, M., Paul, A., Singh, S. K., Jongmans, D.,
and Sánchez-Sesma, F. J.: Surface-wave propagation across the Mexican Volcanic Belt and the origin of the long- period seismic-wave amplification in the Valley of Mexico, Geophys. J. Int., 128, 151–166, 1997.
Singh, S. K. and Suárez, G.: Overview of the seismicity of Mex-ico with emphasis on the September 1985 Michoacan earth-quake, in: Cassaro, M. A. and Martínez Romero, E., The Mex-ico Earthquakes—1985: Factors Involved and Lessons Learned, Proc. Int. Conf. Am. Civil Eng. Soc. Am. Assoc. Civ. Eng, Wash-ington, DC, 7–18, 1987.
Singh, S. K., Mena, E., and Castro, R.: Some aspects of the 19 September 1985 Michoacan earthquake and ground motion am-plification in and near Mexico City from strong motion data, Bull. Seism. Soc. Am., 78, 451–477, 1988a.
Singh, S. K., Lermo, J., Domínguez, T., Ordaz, M., Espinosa, J. M., Mena, E., and Quass, R.: A study of amplification of seismic waves in the valley of Mexico with respect to a hill zone site, Earthquake Spectra, 4, 653–673, 1988b.
Singh, S. K., Quaas, R., Ordaz, M., Mooser, F., Almora, D., Torres, M., and Vázquez, R.: Is there truly a “hard” rock site in the Valley of Mexico?, Geophys Res. Lett., 22, 481–484, 1995.
Singh, S. K., Pacheco, J. F., García, D., and Iglesias A.: An Estimate of shear-wave Q of the mantle wedge in Mexico, Bull. Seism. Soc. Am., 96, 176–187, 2006.
Singh, S. K., Iglesias, A., García, D., Pacheco, J. F., and Ordaz, M.: Q of Lg waves in the Central Mexican Volcanic Belt, Bull. Seism. Soc. Am., 97, 1259–1266, 2007.
Suárez, G.: El sismo de Jalapa del 3 de Enero de 1920, Revista So-ciedad Mexicana de Ingeniería Sísmica (SMIS), 42, 3–15, 1992. Suárez, G., García-Acosta, V., and Gaulon, R.: Active crustal defor-mation in the Jalisco block, Mexico: evidence for a great histor-ical earthquake in the 16th century, Tectonophysics, 234, 117– 127, 1994.
Suter, M., Carrillo, M., López, M., and Farrar, E.: The Aljibes halfgraben-active extension in the transition zone between the Trans-Mexican volcanic belt and the southern basin and range, Mexico, Geol. Soc. Amer. Bull., 107, 627–641, 1995.
Suter, M., Carrillo-Martínez, M., and Quintero-Legorreta, O.: Macroseismic study of shallow earthquake in the central and eastern parts of Trans-Mexican Volcanic Belt, Mexico, Bull. Seism. Soc. Am., 86, 1952–1963, 1996.
Suter, M., López-Martínez, M., Quintero-Legorreta, O., and Carrillo-Martínez, M.: Quaternary intra-arc extension in the cen-tral Trans-Mexican volcanic belt, Geol. Soc. Amer. Bull., 113, 693–703, 2001.
Tucker, B. E.,. King, J. L., Hatzfeld, D., and Nersesov I. L.: Obser-vations of hard-rock sites, Bull. Seism. Soc. Am., 74, 121–136, 1984.