and Paraffin-Embedded Tissues Using Affymetrix
Cytoscan HD Chip
Yan P. Yu1, Amantha Michalopoulos1, Ying Ding2, George Tseng2, Jian-Hua Luo1*
1Department of Pathology, University of Pittsburgh School of Medicine, Pittsburgh, Pennsylvania, United States of America,2Department of Statistics, University of Pittsburgh School of Medicine, Pittsburgh, Pennsylvania, United States of America
Abstract
Detection of human genome copy number variation (CNV) is one of the most important analyses in diagnosing human malignancies. Genome CNV detection in formalin-fixed and paraffin-embedded (FFPE) tissues remains challenging due to suboptimal DNA quality and failure to use appropriate baseline controls for such tissues. Here, we report a modified method in analyzing CNV in FFPE tissues using microarray with Affymetrix Cytoscan HD chips. Gel purification was applied to select DNA with good quality and data of fresh frozen and FFPE tissues from healthy individuals were included as baseline controls in our data analysis. Our analysis showed a 91% overlap between CNV detection by microarray with FFPE tissues and chromosomal abnormality detection by karyotyping with fresh tissues on 8 cases of lymphoma samples. The CNV overlap between matched frozen and FFPE tissues reached 93.8%. When the analyses were restricted to regions containing genes, 87.1% concordance between FFPE and fresh frozen tissues was found. The analysis was further validated by Fluorescence In Situ Hybridization on these samples using probes specific for BRAF and CITED2. The results suggested that the modified method using Affymetrix Cytoscan HD chip gave rise to a significant improvement over most of the previous methods in terms of accuracy in detecting CNV in FFPE tissues. This FFPE microarray methodology may hold promise for broad application of CNV analysis on clinical samples.
Citation:Yu YP, Michalopoulos A, Ding Y, Tseng G, Luo J-H (2014) High Fidelity Copy Number Analysis of Formalin-Fixed and Paraffin-Embedded Tissues Using Affymetrix Cytoscan HD Chip. PLoS ONE 9(4): e92820. doi:10.1371/journal.pone.0092820
Editor:Renato Franco, Istituto dei tumori Fondazione Pascale, Italy
ReceivedDecember 4, 2013;AcceptedFebruary 26, 2014;PublishedApril 3, 2014
Copyright:ß2014 Yu et al. This is an open-access article distributed under the terms of the Creative Commons Attribution License, which permits unrestricted use, distribution, and reproduction in any medium, provided the original author and source are credited.
Funding:This work was funded by the National Cancer Institute, Amercain Cancer Society and University of Pittsburgh Cancer Institute. The funders had no role in study design, data collection and analysis, decision to publish, or preparation of the manuscript.
Competing Interests:The authors have declared that no competing interests exist.
* E-mail: [email protected]
Introduction
Genome abnormalities are the hallmark of human malignancies [1]. These include chromosome deletion, amplification, translo-cation, inversion and isochromosome formation. Analysis of genome abnormality is critical in making diagnosis of human malignancies, congenital birth defects and a variety of inheritable diseases. Array comparative genome hybridization (aCGH) or Affymetrix SNP array has been frequently applied to clinical samples to examine loss of heterozygosity and to detect amplification or deletion of genome fragments in the chromo-somes [2–8]. The current methodologies using aCGH or Affymetrix SNP6.0 require high quality genome DNA from fresh frozen tissues. However, most of the samples for pathological evaluation are formalin-fixed and paraffin-embedded (FFPE) tissue blocks. Suboptimal and high background results are obtained when tissues from FFPE tissue blocks are analyzed due to the fragmenting nature of genome DNA in FFPE tissues. The low quality of genome copy number analysis from FFPE tissues practically precludes the application of whole genome copy number variation (CNV) analyses in clinical setting. Thus, a new method that can reproducibly generate high quality CNV analysis from FFPE tissues is needed to make high throughput genome CNV analysis applicable to clinical setting.
Lymphoma is one of the human malignancies that are frequently associated with large number of structural genome abnormalities. The classification and treatment of lymphomas are based on their genotypes in the tumor cells. Thus, lymphoma is an ideal human malignancy to investigate whether FFPE tissue is suitable for CNV analysis using Affymetrix Cytoscan HD chip. In this report, we describe a method that is adapted to the genomic DNA extracted from FFPE tissues to prepare the DNA cocktail for Affymetrix Cytoscan HD analysis. To validate this method, frozen genome DNA samples from matched lymphoma cases were also analyzed on Affymetrix Cytoscan HD chips. The results showed close overlaps in CNV profiles between FFPE and matched frozen tissues.
Materials and Methods
Tissue samples
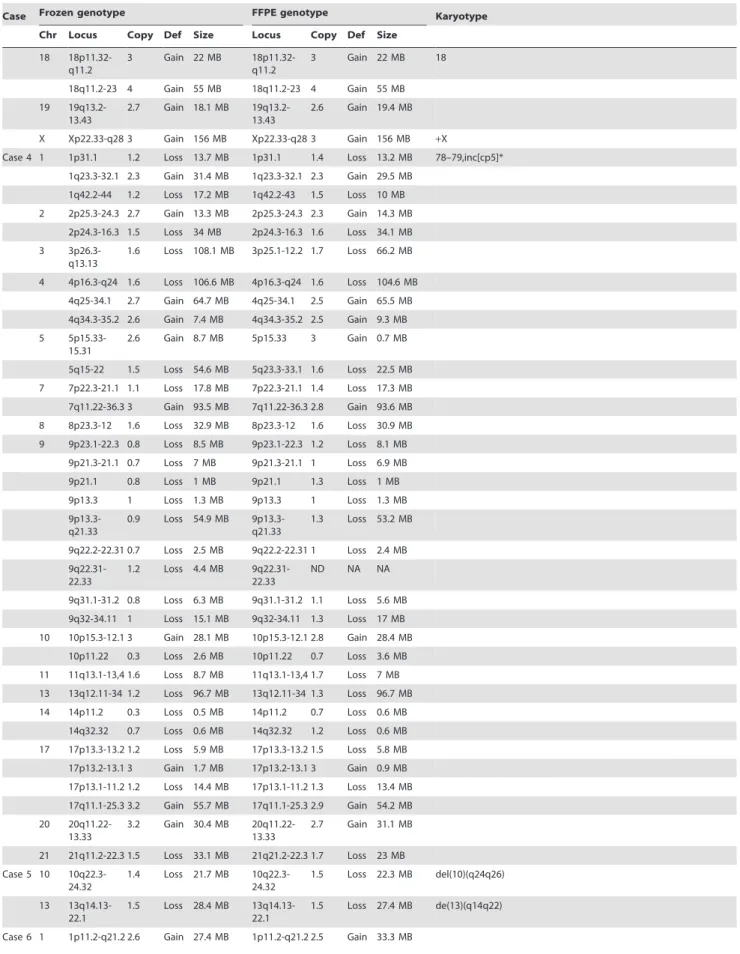
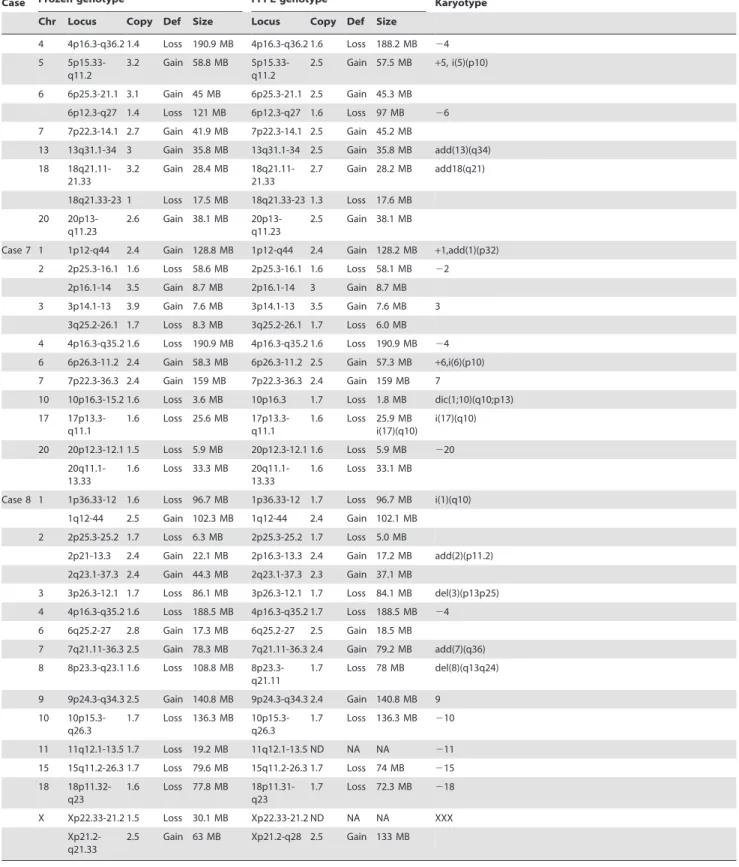
Table 1.Genotyping concordance between FFPE and Frozen tissues.
Case Frozen genotype FFPE genotype Karyotype
Chr Locus Copy Def Size Locus Copy Def Size
Case 1 2 2p16.1 1 Loss 0.7 MB 2p16.1 1 Loss 0.5 MB 22
2q33.2-34 2.3 Gain 7.2 MB 2q33.2-34 2.3 Gain 7.2 MB
2q35-37.3 3 Gain 24 MB 2q35 2.4 Gain 24 MB 5 5q13.2-14.3 1.3 Loss 18.4 MB 5q13.2-14.3 1.4 Loss 17 MB 25
5q21.1-22.1 1.4 Loss 12 MB 5q21.1-22.1 1.5 Loss 10.5 MB
5q33.3-35.1 1.3 Loss 12.4 MB 5q33.3-35.1 1.45 Loss 11.8 MB
7 7p14.3-14.1 1.3 Loss 6.5 MB 7p14.3-14.1 1.5 Loss 6.7 MB der(7)t(7;?)(p11.2;?)
7q11.22-22.1 4 Gain 27.8 MB 7q11.22-22.1 4 Gain 24.4 MB add(7)(q22) [8]
7q22.1-36.3 3 Gain 38.3 MB 7q22.1-36.3 3 Gain 33.5 MB der(7;16)(p10;q10) 8 8p23.3-11.21 1.3 Loss 42.6 MB 8p23.3-11.22 1.4 Loss 39.6 MB 28 [17]
10q23.1-25.1 1.3 Loss 21.7 MB 10q23.1-25.1 1.5 Loss 21.3 MB
11 11p15.3-15.1 1.5 Loss 10.1 MB 11p15.4-14.3 1.5 Loss 14.2 MB
11p14.2-11.2 2.5 Gain 22 MB 11p14.2-11.12
2.4 Gain 23.6 MB
13 13q33.3-34 1.3 Loss 6.6 MB 13q33.3-34 1.3 Loss 6.7 MB add(13)(q34) [15]
16 16p11.2-11.1 4 Gain 0.8 MB 16p11.2-11.1 3 Gain 1.2 MB 16p11.1-q21 1.3 Loss 30.4 MB
16p11.1-q22.1
1.5 Loss 33 MB 216
16q23.1 4 Gain 2.7 MB 16q23.1 4 Gain 2.6 MB 16q23.1-23.2 1.2 Loss 3.7 MB 16q23.1-23.2 1.2 Loss 3.7 MB
16q23.2-23.3 4 Gain 1.2 MB 16q23.2-23.3 4 Gain 1.2 MB
16q23.3-24.1 1.1 Loss 2.5 MB 16q23.3-24.1 1.1 Loss 2.5 MB 16q24.1 4 Gain 2.0 MB 16q24.1 4 Gain 2.0 MB
16q24.1-24.3 1.2 Loss 2.8 MB 16q24.1-24.3 1.2 Loss 2.8 MB
17 17p13.3-13.1 2.5 Gain 8.5 MB 17p13.3-13.1 2.5 Gain 8.7 MB 217 17p12-q11.2 3 Gain 14.5 MB 17p12-q11.2 2.7 Gain 16.7 MB
17q21.33-25.33
2.7 Gain 31.8 MB 17q21.33-25.32
2.7 Gain 32.2 MB
X Xp22.33-q28 2 NP 154.3 MB Xp22.33-q28 3 Gain 154.3 MB +X [6] Case 2 1
1p36.33-36.21
1.4 Loss 16.7 MB 1p36.33-36.13
1.5 Loss 18.2 MB
1q21.2-q44 2.7 Gain 102 MB 1q21.2-q44 2.6 Gain 102 MB der(1)(qter.1q21::p36.3.qter) 2 2p25.3-11.2 2.8 Gain 89.1 MB 2p25.3-11.2 2.6 Gain 88.9 MB
6 6q21-27 1.2 Loss 58.9 MB 6q21-27 1.4 Loss 58.7 MB
17 17p13.3-11.2 1.3 Loss 16.9 MB 17p13.3-11.2 1.5 Loss 19.2 MB del(17)(p11.2)
17p11.2-q25.3
2.8 Gain 59.7 MB 17p11.2-q25.3
2.7 Gain 60.3 MB i(17)(q10)
18 18p11.32-q21.33
2.9 Gain 60.5 MB 18p11.32-q21.33
2.8 Gain 60.1 MB +der(18)(t(14;18)(q32;q21) [4]
22 22q11.22 1 Loss 0.9 MB 22q11.22 1 Loss 1.0 MB
X Xp22.33-q28 3 Gain 156 MB Xp22.33-q28 3 Gain 156 MB +X Case 3 1 1q24.3-42.11 2.9 Gain 55.1 MB 1q24.3-42.11 2.7 Gain 52 MB +1, der (1)
5 5p15.33-q35.3
2.6 Gain 180.6 MB 5p15.33-q35.3
2.6 Gain 180.6 MB 5
8 8p23.3-21.3 1.4 Loss 22.8 MB 8p23.3-21.3 1.4 Loss 22.3 MB del(8)(p21p23)
9 9p24.1-23 2.5 Gain 4.7 MB 9p24.2-23 2.4 Gain 7.1 MB add(9)(p22)
10 10p15.3 1.4 Loss 0.8 MB 10p15.3 1.5 Loss 0.8 MB dic(1;10)(10qter.10p15::1p13.1q25::1q21.1q32::1q25.1qter)
10p15.1-11.21
2.5 Gain 31.6 MB 10p15.1-11.21
2.5 Gain 31 MB
Table 1.Cont.
Case Frozen genotype FFPE genotype Karyotype
Chr Locus Copy Def Size Locus Copy Def Size
18 18p11.32-q11.2
3 Gain 22 MB 18p11.32-q11.2
3 Gain 22 MB 18
18q11.2-23 4 Gain 55 MB 18q11.2-23 4 Gain 55 MB 19
19q13.2-13.43
2.7 Gain 18.1 MB 19q13.2-13.43
2.6 Gain 19.4 MB
X Xp22.33-q28 3 Gain 156 MB Xp22.33-q28 3 Gain 156 MB +X
Case 4 1 1p31.1 1.2 Loss 13.7 MB 1p31.1 1.4 Loss 13.2 MB 78–79,inc[cp5]* 1q23.3-32.1 2.3 Gain 31.4 MB 1q23.3-32.1 2.3 Gain 29.5 MB
1q42.2-44 1.2 Loss 17.2 MB 1q42.2-43 1.5 Loss 10 MB
2 2p25.3-24.3 2.7 Gain 13.3 MB 2p25.3-24.3 2.3 Gain 14.3 MB 2p24.3-16.3 1.5 Loss 34 MB 2p24.3-16.3 1.6 Loss 34.1 MB
3 3p26.3-q13.13
1.6 Loss 108.1 MB 3p25.1-12.2 1.7 Loss 66.2 MB
4 4p16.3-q24 1.6 Loss 106.6 MB 4p16.3-q24 1.6 Loss 104.6 MB
4q25-34.1 2.7 Gain 64.7 MB 4q25-34.1 2.5 Gain 65.5 MB
4q34.3-35.2 2.6 Gain 7.4 MB 4q34.3-35.2 2.5 Gain 9.3 MB 5
5p15.33-15.31
2.6 Gain 8.7 MB 5p15.33 3 Gain 0.7 MB
5q15-22 1.5 Loss 54.6 MB 5q23.3-33.1 1.6 Loss 22.5 MB 7 7p22.3-21.1 1.1 Loss 17.8 MB 7p22.3-21.1 1.4 Loss 17.3 MB
7q11.22-36.3 3 Gain 93.5 MB 7q11.22-36.3 2.8 Gain 93.6 MB
8 8p23.3-12 1.6 Loss 32.9 MB 8p23.3-12 1.6 Loss 30.9 MB 9 9p23.1-22.3 0.8 Loss 8.5 MB 9p23.1-22.3 1.2 Loss 8.1 MB
9p21.3-21.1 0.7 Loss 7 MB 9p21.3-21.1 1 Loss 6.9 MB
9p21.1 0.8 Loss 1 MB 9p21.1 1.3 Loss 1 MB
9p13.3 1 Loss 1.3 MB 9p13.3 1 Loss 1.3 MB
9p13.3-q21.33
0.9 Loss 54.9 MB 9p13.3-q21.33
1.3 Loss 53.2 MB
9q22.2-22.31 0.7 Loss 2.5 MB 9q22.2-22.31 1 Loss 2.4 MB
9q22.31-22.33
1.2 Loss 4.4 MB 9q22.31-22.33
ND NA NA
9q31.1-31.2 0.8 Loss 6.3 MB 9q31.1-31.2 1.1 Loss 5.6 MB 9q32-34.11 1 Loss 15.1 MB 9q32-34.11 1.3 Loss 17 MB
10 10p15.3-12.1 3 Gain 28.1 MB 10p15.3-12.1 2.8 Gain 28.4 MB
10p11.22 0.3 Loss 2.6 MB 10p11.22 0.7 Loss 3.6 MB 11 11q13.1-13,4 1.6 Loss 8.7 MB 11q13.1-13,4 1.7 Loss 7 MB
13 13q12.11-34 1.2 Loss 96.7 MB 13q12.11-34 1.3 Loss 96.7 MB
14 14p11.2 0.3 Loss 0.5 MB 14p11.2 0.7 Loss 0.6 MB 14q32.32 0.7 Loss 0.6 MB 14q32.32 1.2 Loss 0.6 MB
17 17p13.3-13.2 1.2 Loss 5.9 MB 17p13.3-13.2 1.5 Loss 5.8 MB
17p13.2-13.1 3 Gain 1.7 MB 17p13.2-13.1 3 Gain 0.9 MB 17p13.1-11.2 1.2 Loss 14.4 MB 17p13.1-11.2 1.3 Loss 13.4 MB
17q11.1-25.3 3.2 Gain 55.7 MB 17q11.1-25.3 2.9 Gain 54.2 MB
20 20q11.22-13.33
3.2 Gain 30.4 MB 20q11.22-13.33
2.7 Gain 31.1 MB
21 21q11.2-22.3 1.5 Loss 33.1 MB 21q21.2-22.3 1.7 Loss 23 MB
Case 5 10 10q22.3-24.32
1.4 Loss 21.7 MB 10q22.3-24.32
1.5 Loss 22.3 MB del(10)(q24q26)
13 13q14.13-22.1
1.5 Loss 28.4 MB 13q14.13-22.1
1.5 Loss 27.4 MB de(13)(q14q22)
Table 1.Cont.
Case Frozen genotype FFPE genotype Karyotype
Chr Locus Copy Def Size Locus Copy Def Size
4 4p16.3-q36.2 1.4 Loss 190.9 MB 4p16.3-q36.2 1.6 Loss 188.2 MB 24
5 5p15.33-q11.2
3.2 Gain 58.8 MB 5p15.33-q11.2
2.5 Gain 57.5 MB +5, i(5)(p10)
6 6p25.3-21.1 3.1 Gain 45 MB 6p25.3-21.1 2.5 Gain 45.3 MB
6p12.3-q27 1.4 Loss 121 MB 6p12.3-q27 1.6 Loss 97 MB 26
7 7p22.3-14.1 2.7 Gain 41.9 MB 7p22.3-14.1 2.5 Gain 45.2 MB
13 13q31.1-34 3 Gain 35.8 MB 13q31.1-34 2.5 Gain 35.8 MB add(13)(q34)
18 18q21.11-21.33
3.2 Gain 28.4 MB 18q21.11-21.33
2.7 Gain 28.2 MB add18(q21)
18q21.33-23 1 Loss 17.5 MB 18q21.33-23 1.3 Loss 17.6 MB 20
20p13-q11.23
2.6 Gain 38.1 MB 20p13-q11.23
2.5 Gain 38.1 MB
Case 7 1 1p12-q44 2.4 Gain 128.8 MB 1p12-q44 2.4 Gain 128.2 MB +1,add(1)(p32) 2 2p25.3-16.1 1.6 Loss 58.6 MB 2p25.3-16.1 1.6 Loss 58.1 MB 22
2p16.1-14 3.5 Gain 8.7 MB 2p16.1-14 3 Gain 8.7 MB
3 3p14.1-13 3.9 Gain 7.6 MB 3p14.1-13 3.5 Gain 7.6 MB 3 3q25.2-26.1 1.7 Loss 8.3 MB 3q25.2-26.1 1.7 Loss 6.0 MB
4 4p16.3-q35.2 1.6 Loss 190.9 MB 4p16.3-q35.2 1.6 Loss 190.9 MB 24
6 6p26.3-11.2 2.4 Gain 58.3 MB 6p26.3-11.2 2.5 Gain 57.3 MB +6,i(6)(p10) 7 7p22.3-36.3 2.4 Gain 159 MB 7p22.3-36.3 2.4 Gain 159 MB 7
10 10p16.3-15.2 1.6 Loss 3.6 MB 10p16.3 1.7 Loss 1.8 MB dic(1;10)(q10;p13)
17 17p13.3-q11.1
1.6 Loss 25.6 MB 17p13.3-q11.1
1.6 Loss 25.9 MB i(17)(q10)
i(17)(q10)
20 20p12.3-12.1 1.5 Loss 5.9 MB 20p12.3-12.1 1.6 Loss 5.9 MB 220
20q11.1-13.33
1.6 Loss 33.3 MB 20q11.1-13.33
1.6 Loss 33.1 MB
Case 8 1 1p36.33-12 1.6 Loss 96.7 MB 1p36.33-12 1.7 Loss 96.7 MB i(1)(q10)
1q12-44 2.5 Gain 102.3 MB 1q12-44 2.4 Gain 102.1 MB
2 2p25.3-25.2 1.7 Loss 6.3 MB 2p25.3-25.2 1.7 Loss 5.0 MB
2p21-13.3 2.4 Gain 22.1 MB 2p16.3-13.3 2.4 Gain 17.2 MB add(2)(p11.2)
2q23.1-37.3 2.4 Gain 44.3 MB 2q23.1-37.3 2.3 Gain 37.1 MB
3 3p26.3-12.1 1.7 Loss 86.1 MB 3p26.3-12.1 1.7 Loss 84.1 MB del(3)(p13p25) 4 4p16.3-q35.2 1.6 Loss 188.5 MB 4p16.3-q35.2 1.7 Loss 188.5 MB 24
6 6q25.2-27 2.8 Gain 17.3 MB 6q25.2-27 2.5 Gain 18.5 MB
7 7q21.11-36.3 2.5 Gain 78.3 MB 7q21.11-36.3 2.4 Gain 79.2 MB add(7)(q36) 8 8p23.3-q23.1 1.6 Loss 108.8 MB
8p23.3-q21.11
1.7 Loss 78 MB del(8)(q13q24)
9 9p24.3-q34.3 2.5 Gain 140.8 MB 9p24.3-q34.3 2.4 Gain 140.8 MB 9 10
10p15.3-q26.3
1.7 Loss 136.3 MB 10p15.3-q26.3
1.7 Loss 136.3 MB 210
11 11q12.1-13.5 1.7 Loss 19.2 MB 11q12.1-13.5 ND NA NA 211 15 15q11.2-26.3 1.7 Loss 79.6 MB 15q11.2-26.3 1.7 Loss 74 MB 215
18 18p11.32-q23
1.6 Loss 77.8 MB 18p11.31-q23
1.7 Loss 72.3 MB 218
X Xp22.33-21.2 1.5 Loss 30.1 MB Xp22.33-21.2 ND NA NA XXX
Xp21.2-q21.33
2.5 Gain 63 MB Xp21.2-q28 2.5 Gain 133 MB
NP-normal ploidy; ND-Not detected; NA-Not applicable; Def-copy number variation definition; *-No analysis was reported due to low number of cells survived.
informed-consent. The matched FFPE tissues from the same patients were also frozen sectioned onto slides, fixed and dehydrated with 100% ethanol and similarly micro-dissected to obtain tumor cells. Karyotyping analyses were performed on all these cases to detect chromosome abnormalities.
Affymetrix CytoScan HD chip analysis of copy number variation of tumor cells
For macrodissected frozen tissues, DNA was extracted using QIAamp blood and tissue kit (Qiagen, Valencia, CA). Five hundred nanograms of genome DNA were digested with Nsp1 for 2 hours at 37uC. The digested DNA was purified and ligated with primer/adaptors at 16uC for 12–16 hours. Amplicons were generated by performing PCR using primers provided by the manufacturer (Affymetrix, CA) on the ligation products using the following program: 94uC for 3 min, then 35 cycles of 94uC 30 second, 60uC for 45 sec and 65uC for 1 minute. This was followed by extension at 68uC for 7 min. The PCR products were then purified and digested with DNAseI for 35 min at 37uC to fragment the amplified DNA. The fragmented DNA was then labeled with biotinylated nucleotides through terminal deoxynu-cleotide transferase for 4 hours at 37uC. Two hundred fifty micrograms of fragmented DNA were hybridized with a pre-equilibrated Affymetrix chip Cytoscan HD chip at 50uC for
canHD chips followed the manuals provided by Affymetrix, Inc. Cel files were generated from AGCC software from Affymetrix, Inc. (Santa Clara, CA). For FFPE tissues, micro-dissected tumor cells were treated with xylene for 12 hours. DNA was then extracted using QiaAmp FFPE DNA extraction kit. Gel purifica-tion of DNA sizes ranging from 200 to 1000 bp was performed. Two hundred fifty nanograms of purified DNA was then digested with NSP1, and similarly processed as frozen tissues.
Statistical analysis
Sixteen cel files were analyzed with Genotyping console for quality control analysis. Samples with QC call above 80% were admitted into the analysis. To analyze CNV, cel files were imported into Chromosome Analysis Suite 1.2 (Affymetrix, Inc) to generate copy number from raw intensity. For frozen tissues, Cytoscan HD files from fresh frozen tissues of 380 healthy individuals provided by Affymetrix were used as a baseline. For FFPE tissues, Cytoscan HD files from FFPE tissue of 100 healthy individuals from Affymetrix were used. Deletions or amplifications of genomes were analyzed by first limiting to the regions with p-value less than 0.05/total number of regions detected, i.e. family-wise error rate (FWER) is controlled using Bonferroni’s correction [9]. The selected regions were filtered by limiting to the regions with at least 25 markers and 500 kb. For genome fragment gain Figure 1. Histograms of matched FFPE and Fresh frozen samples on selected chromosomes.Top panel: FFPE and frozen histograms of chromosome 16 of Case 1; Mid panel: FFPE and frozen histograms of chromosome 17 of Case 2; Lower panel: FFPE and frozen histograms of chromosome 9 of Case 4. Red bar denotes deletion. Blue bar denotes amplification.
.1.5 for sex chromosomes of male was required, while for genome fragment loss determination, a mean of ,1.7 for autosomal chromosomes or,0.5 of sex chromosomes of male was required. Loss of heterozygosity was not analyzed due to lack of matched normal tissues.
Fluorescence In-situ Hybridization (FISH)
Tissue slides (5 microns) were placed in 26SSC at 37uC for
30 min. Slides were then removed and dehydrated in 70% and 85% ethanol for 2 min each at room temperature, and air dried. The probes for CITED2 and BRAF FISH analysis were obtained from BACPAC Resource Center, Oakland, CA. The DNA from the selected clone was extracted using Nucleobond Ax kit (Macherey-Nagel, Easton, PA). The probe was prepared by combining 7ml of biotin-labeled genomic sequence containing CITED2 or BRAF (150 Kb)/50% formamide with 1ml of direct-labeled CEP7 spectrum green for BRAF or CEP6 for CITED2 (Vysis, Downers Grove, IL). The probe was denatured for 5 min at 75uC. Sections of formalin-fixed tissues were denatured in 70% formamide for 3 min, and dehydrated in 70%, 85%, and 100% ethanol for 2 min each at room temperature. The denatured probe was placed on the slide, cover-slipped, sealed with rubber cement, placed in a humidified chamber and hybridized overnight at 37uC. Coverslips were removed and the slides were washed in 26SSC/0.3% NP-40 at 72uC for 2 min. Slides were then held in
phosphate buffered saline (PBS) at room temperature in the dark for 2 min. The biotin label was visualized by conjugation with Avidin-spectrum orange (Zymed, San Francisco, CA), cover-slipping and incubating in a moist chamber in the dark at 37uC for 20 min. Slides were washed 3 times for 2 min each in fresh PBS. Slides were then air-dried in the dark and counterstained with DAPI. Analysis was performed using a Nikon Optiphot-2 and Quips Genetic Workstation equipped with Chroma Technology 83000 filter set with single band exitors for Texas Red/
Rhodamine, FITC and DAPI (uv 360 nm). Only individual and well delineated cells with two hybridization signals were scored. Overlapping cells were excluded from the analysis. Fifty to 100 cells per sample were scored to obtain an average of signals.
Karyotyping analysis
Cytogenetic analysis was performed on cell cultures of lymphoma samples. The cell cultures were stimulated with phytohemagglutinin (PHA) for 72 hours, and harvested and treated briefly with a hypotonic solution. The cells were then fixed with Carnoy fixative. GTG-banding was carried out using standard protocols [10].
Results
Affymetrix Cytoscan HD contains 2.6 million markers covering all RefSeq genes and 750K SNPs of human genome, and has
.99% genotype accuracy. It has been widely applied to ascertain genome abnormalities of a variety of human diseases. However, it is rarely applied to FFPE tissues. To evaluate the usage of Cytoscan HD on clinical FFPE samples, eight cases of lymphoma FFPE tissues were micro-dissected and analyzed through Affyme-trix Cytoscan HD chips. The frozen counterparts of these cases were similarly analyzed. Karyotype analyses were performed on all these cases for validation purpose. As shown in Table 1, karyotype abnormalities in 24 of 51 loci had complete matches with frozen tissue copy number analyses. Twenty-two loci from Karyotype analyses had significant overlapped regions detected by frozen tissue CNV analysis. Overall, this represents 90.2% (46/51) concordance between Karyotype and Cytoscan HD analyses. Five loci of Karyotype analyses, however, did not concord with CNV analysis from both frozen and FFPE tissues analyses. These differences may result from heterogeneity of the tumor samples that some genome abnormalities appear in only a fraction of tumor cells.
Most of the clinical samples are in the form of formalin-fixed and paraffin-embedded tissue blocks. The dependence of array analysis on fresh frozen tissues significantly limits its application in clinical setting. To investigate whether FFPE tissues are suitable for cytoscan HD analysis, DNA from the matched FFPE tissue samples was extracted. Similar Affymetrix Cytoscan HD analyses were performed. Cel files of FFPE tissues from 100 normal individuals were used as baseline to calculate the copy number of genome fragments of these FFPE samples. CNV was determined by p,0.05 with at least 25 markers and a minimal length of 500 Kb. As shown in Tables 1–2 and figure 1, the concordant
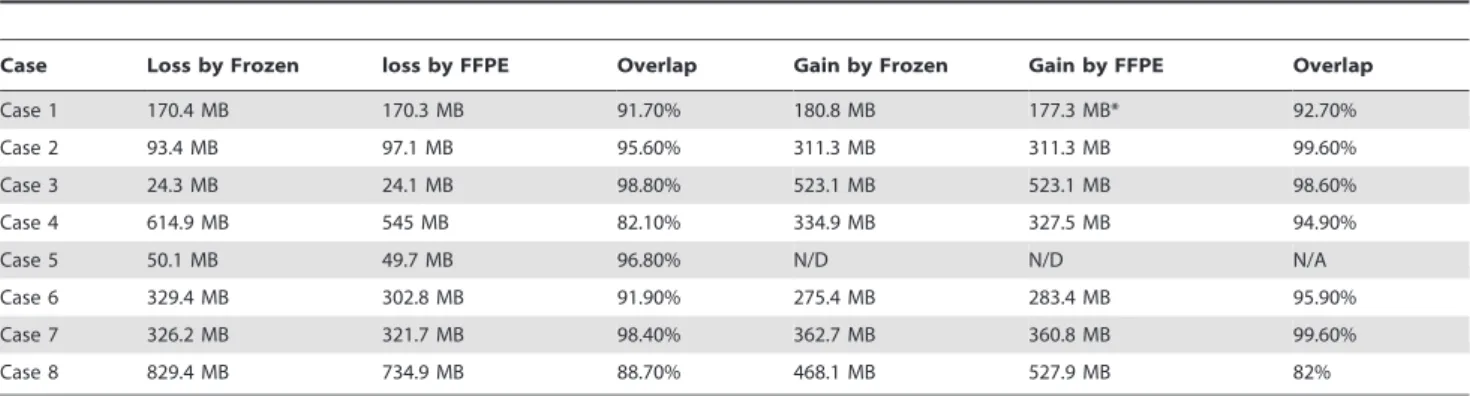
Table 2.CNV Overlaps between Frozen tissues and matched formalin-fixed paraffin-embedded tissues.
Case Loss by Frozen loss by FFPE Overlap Gain by Frozen Gain by FFPE Overlap
Case 1 170.4 MB 170.3 MB 91.70% 180.8 MB 177.3 MB* 92.70%
Case 2 93.4 MB 97.1 MB 95.60% 311.3 MB 311.3 MB 99.60%
Case 3 24.3 MB 24.1 MB 98.80% 523.1 MB 523.1 MB 98.60%
Case 4 614.9 MB 545 MB 82.10% 334.9 MB 327.5 MB 94.90%
Case 5 50.1 MB 49.7 MB 96.80% N/D N/D N/A
Case 6 329.4 MB 302.8 MB 91.90% 275.4 MB 283.4 MB 95.90%
Case 7 326.2 MB 321.7 MB 98.40% 362.7 MB 360.8 MB 99.60%
Case 8 829.4 MB 734.9 MB 88.70% 468.1 MB 527.9 MB 82%
N/D-Not detected; N/A-Not applicable. *Excluding X chromosome.
doi:10.1371/journal.pone.0092820.t002
Table 3.Correlation of CNV callings between FFPE and matched fresh frozen tissues by segment number.
CNV fresh gain fresh loss
FFPE loss 68 18
FFPE gain 13 352
rates based on CNV length between arrays from the matched FFPE and frozen tissues ranged from 82% to over 99%. Seven of these FFPE blocks are over 1 year old and one is 3 years. The average concordant rate for 1 year old samples is 94.1%, while the rate for the 3 year old sample is 92%. This suggests that the quality of the assays is stable, and is probably not adversely affected by the age of the fixed tissues for at least 1–3 years. When CNV calling was limited to regions that cover at least one gene, we found that 482 genome segments were either deleted or amplified in at least one of the 16 samples. Among these segments, 68 of 86 segments that were determined as deletion in FFPE samples matched the same callings from fresh frozen tissue counterparts, while 352 of 365 segments that were determined as amplification matched those from the fresh tissues (Table 3). The results confirmed a strong correlation between FFPE and fresh frozen tissues (87.1%, Pearson correlation coefficient = 0.72, p,2.2610216
). Interesting-ly, when CNV results of FFPE were matched with Karyotype studies, the results were extremely similar to those between frozen CNV and Karyotype. There is no statistically significant difference in terms of accuracy. In fact, a slight improvement (25/51 complete match versus 24/51 frozen) was seen due to detection of X chromosome gain in a case that was missed in frozen tissue.
To validate the CNV analysis at individual gene level, FISH assays were performed on all 8 cases of lymphoma using probes specific for BRAF and CITED2. Four samples of lymphoma were found to have gain of BRAF gene by CNV analyses in both frozen and FFPE tissues. Each of these 4 cases was found to have similar amplification of BRAF in the FISH assays, while the other 4 CNV neutral samples were found to have copy number near diploid condition in FISH. The concordant rate between the CNV calls Figure 2. FISH validation of copy number variation detected by Cytoscan HD analysis.(A) Representative images of FISH analysis using probes specific for BRAF (7q34, red) and centromere of chromosome 7 (green). Left, normal diploid control, right-case 4 lymphoma (BRAF amplified). (B) Representative images of FISH analysis using probes specific for CITED2 (6q23.3, red) and centromere of chromosome 6 (green). Left, normal diploid control, right-case 2 lymphoma (CITED2 deleted).
doi:10.1371/journal.pone.0092820.g002
Table 4.Correlation of CNV callings and FISH on BRAF and CITED2.
Genes Cases CN by frozen tissue CN by FFPE CN by FISH
BRAF 1 3 3 2.8*
2 Unchanged Unchanged 2.1
3 Unchanged Unchanged 1.9
4 3 3 2.9*
5 Unchanged Unchanged 2.2
6 Unchanged Unchanged 1.9
7 3 2.5 2.7*
8 3 3 3.1*
CITED2 1 Unchanged Unchanged 2.1
2 1 1 1.3*
3 Unchanged Unchanged 1.9
4 Unchanged Unchanged 2
5 Unchanged Unchanged 2.2
6 1.4 Unchanged 1.6*
7 Unchanged Unchanged 1.8
8 Unchanged Unchanged 2
matched samples reaches 100% (8/8, Table 4 and figure 2). CITED2, a transcription modulator essential for glycolytic metabolism for adult hematopoietic stem cells and potential tumor suppressor [11,12], was found deleted in 2 cases of lymphoma by CNV analysis in frozen tissues. On the other hand, CNV analysis in the matched FFPE tissues suggests loss of CITED2 in only one sample. FISH assays using a probe specific for CITED2 found loss of one copy of CITED2 gene in both cases where deletions were also indicated by Cytoscan HD chip analyses of frozen tissues (Table 4 and figure 2). However, 55% (117/212) of the counted cells in one of the cases (case 6) in the FISH assay do not contain deletion of CITED2. The large dilution by the diploid cells in this sample may result in a negative result in FFPE CNV analysis.
Despite the high level statistical CNV concordance between FFPE and frozen tissues, a moderately higher level of fluctuation was readily detected in FFPE array analysis (figure 1). The average of copy number for genome deletion for FFPE tissues is 1.44. This magnitude of deletion is significantly less than that from frozen tissues (1.29, p = 6.7610211). As a result, CNV analysis from FFPE tissues could be less sensitive. Despite this mild drawback, excellent CNV concordance between FFPE and frozen samples was evident in most of the CNV regions, particularly those CNV loci with large DNA fragment abnormalities (figure 1).
Discussion
The current methodologies to detect chromosome abnormalities include Karyotyping using Giemsa staining of chromosomes, high throughput array analysis of single nucleotide polymorphism and DNA copy number, and whole genome sequencing. The first two are the most commonly used methods to determine the copy number of genome fragments, while the last one might be highly precise but expensive. Array genome copy number analysis offers a high resolution alternative to Karyotyping assay. However, its clinical application is limited due to the requirement of high quality DNA. Most clinical specimens, however, are stored in the form of formalin-fixed and paraffin-embedded tissue blocks. The DNA from FFPE is highly fragmented and cross-linked. This produces a significant challenge in using FFPE tissues for high resolution genotyping analysis. Our method using FFPE tissues to analyze chromosomes shows an average of concordance of 93.8% between FFPE and fresh frozen tissues. It suggests that FFPE Cytoscan HD analysis is readily applicable to clinical setting.
Studies using FFPE tissues to analyze copy number variation had been peviously attempted on Affymetrix 10K and SNP6.0 chips, GenomePlex aCGH, Illumina beadArray and Agilent 244K chips (Table 5) [13–19]. However, many of these studies lack direct validation using other methodologies. In one study, high noise level on CNV analysis was found in FFPE samples when using Affymetrix 6.0 chip. Only 53% concordant rate was found between the matched frozen and FFPE samples [15]. In another study, only selected concordance analyses were performed on selected regions of FISH and Agilent 244K chips using FFPE tissues [14]. The study concluded complementary roles of between aCGH and FISH analyses. Both analyses were performed on FFPE tissues. Recently, a FFPE OncoScan service was developed by Affymetrix Inc to use Molecular Inversion Probe technology to detect CNV of oncogenic hot spots [20,21]. The signal-to-noise ratios were reduced even using FFPE tissues more than 5 years old. However, these studies lacked direct validation comparison between FFPE and matched frozen tissues. Thus, the fidelity of CNV callings was not determined. Another study using optimi-zation of universal linkage system labeling to analyze 3 cases FFPE and matched frozen tissues. They found a good correlation in 2 cases (Pearson correlations 0.54–0.58), but found poor correlation in the other case [22]. To our knowledge, this is the first report that shows high concordance in CNV analysis between FFPE and frozen tissues using Affymetrix Cytoscan HD chip. The CNV results from FFPE not only matched well with those from frozen tissues, but were also largely validated by cytogenetic karyotyping and FISH analyses. The Cytoscan HD FFPE analysis holds promise for being widely used in solid tumor and hematological diseases diagnosis. It may be also useful in differential diagnoses of hereditary diseases.
Acknowledgments
We thank Song-Yang Zheng and Kathleen Cieply for technical support in the study. Sarah Gibson provided pathology support in identifying lymphoma regions. We also thank Steven Swedlow and George Michalopoulos for frank and constructive comments on the manuscript.
Author Contributions
Conceived and designed the experiments: JHL. Performed the experi-ments: YPY AM YD GT. Analyzed the data: YPY YD GT. Contributed reagents/materials/analysis tools: YD GT. Wrote the paper: JHL.
Table 5.Comparison of methods analyzing CNV using FFPE tissue.
Thompson et al Little et al Tuefferd et al Lips et al Oosting et al Soroush et al Yu et al
Platform Affymetrix GenomePlex Affymetrix Illumina Illumina/Affymetrix Agilent/Affymetrix Affymetrix
Array Type 10K aCGH SNP 6.0 BeadArray BeadArray/10K aCGH/SNP6.0 CytoscanHD
Number of Loci
10000 5623 1.85 million 5861 5861/10000 40161/1.85 million 2.6 million
CNV FFPE vs. Frozen
NE NE 53% NA NE NA 93.80%
CNV FFPE vs. karyotype
NE NE NE NA NE NA 91%
FISH validation rate
NE NE NE NA NE NA 93.80%
References
1. Barigozzi C, Cusmano L (1947) Chromosome numbers in cancer cells. Nature 159: 505.
2. Ren B, Yu G, Tseng GC, Cieply K, Gavel T, et al. (2006) MCM7 amplification and overexpression are associated with prostate cancer progression. Oncogene 25: 1090–1098.
3. Yu G, Tseng GC, Yu YP, Gavel T, Nelson J, et al. (2006) CSR1 suppresses tumor growth and metastasis of prostate cancer. American Journal of Pathology 168: 597–607.
4. Luo JH, Ren B, Keryanov S, Tseng GC, Rao UN, et al. (2006) Transcriptomic and genomic analysis of human hepatocellular carcinomas and hepatoblastomas. Hepatology (Baltimore, Md 44: 1012–1024.
5. Yu YP, Luo JH (2007) Pathological factors evaluating prostate cancer. Histology and histopathology 22: 1291–1300.
6. Liu W, Laitinen S, Khan S, Vihinen M, Kowalski J, et al. (2009) Copy number analysis indicates monoclonal origin of lethal metastatic prostate cancer. Nature medicine 15: 559–565.
7. Yu YP, Song C, Tseng G, Ren BG, Laframboise W, et al. (2012) Genome abnormalities precede prostate cancer and predict clinical relapse. The American journal of pathology 180: 2240–2248.
8. Nalesnik MA, Tseng G, Ding Y, Xiang GS, Zheng ZL, et al. (2012) Gene deletions and amplifications in human hepatocellular carcinomas: correlation with hepatocyte growth regulation. The American journal of pathology 180: 1495–1508.
9. Strassburger K, Bretz F (2008) Compatible simultaneous lower confidence bounds for the Holm procedure and other Bonferroni-based closed tests. Statistics in medicine 27: 4914–4927.
10. Hu J, Surti U (1991) Subgroups of uterine leiomyomas based on cytogenetic analysis. Human pathology 22: 1009–1016.
11. Du J, Li Q, Tang F, Puchowitz MA, Fujioka H, et al. Cited2 Is Required for the Maintenance of Glycolytic Metabolism in Adult Hematopoietic Stem Cells. Stem cells and development.
12. Cheung KF, Zhao J, Hao Y, Li X, Lowe AW, et al. (2013) CITED2 is a novel direct effector of peroxisome proliferator-activated receptor gamma in suppressing hepatocellular carcinoma cell growth. Cancer 119: 1217–1226.
13. Thompson ER, Herbert SC, Forrest SM, Campbell IG (2005) Whole genome SNP arrays using DNA derived from formalin-fixed, paraffin-embedded ovarian tumor tissue. Human mutation 26: 384–389.
14. Wang L, Rao M, Fang Y, Hameed M, Viale A, et al. (2013) A Genome-Wide High-Resolution Array-CGH Analysis of Cutaneous Melanoma and Compar-ison of aCGH to FISH in Diagnostic Evaluation. J Mol Diagn.
15. Tuefferd M, De Bondt A, Van Den Wyngaert I, Talloen W, Verbeke T, et al. (2008) Genome-wide copy number alterations detection in fresh frozen and matched FFPE samples using SNP 6.0 arrays. Genes, chromosomes & cancer 47: 957–964.
16. Little SE, Vuononvirta R, Reis-Filho JS, Natrajan R, Iravani M, et al. (2006) Array CGH using whole genome amplification of fresh-frozen and formalin-fixed, paraffin-embedded tumor DNA. Genomics 87: 298–306.
17. Nasri S, Anjomshoaa A, Song S, Guilford P, McNoe L, et al. (2010) Oligonucleotide array outperforms SNP array on formalin-fixed paraffin-embedded clinical samples. Cancer genetics and cytogenetics 198: 1–6. 18. Oosting J, Lips EH, van Eijk R, Eilers PH, Szuhai K, et al. (2007)
High-resolution copy number analysis of paraffin-embedded archival tissue using SNP BeadArrays. Genome research 17: 368–376.
19. Lips EH, Dierssen JW, van Eijk R, Oosting J, Eilers PH, et al. (2005) Reliable high-throughput genotyping and loss-of-heterozygosity detection in formalin-fixed, paraffin-embedded tumors using single nucleotide polymorphism arrays. Cancer research 65: 10188–10191.
20. Krijgsman O, Israeli D, Haan JC, van Essen HF, Smeets SJ, et al. (2012) CGH arrays compared for DNA isolated from formalin-fixed, paraffin-embedded material. Genes, chromosomes & cancer 51: 344–352.
21. Wang Y, Cottman M, Schiffman JD (2012) Molecular inversion probes: a novel microarray technology and its application in cancer research. Cancer genetics 205: 341–355.