An Optimization Model for the Selection of
Bus-Only Lanes in a City
Qun Chen*
School of Traffic and Transportation Engineering, Central South University, Changsha, China
Abstract
The planning of urban bus-only lane networks is an important measure to improve bus ser-vice and bus priority. To determine the effective arrangement of bus-only lanes, a bi-level programming model for urban bus lane layout is developed in this study that considers accessibility and budget constraints. The goal of the upper-level model is to minimize the total travel time, and the lower-level model is a capacity-constrained traffic assignment model that describes the passenger flow assignment on bus lines, in which the priority sequence of the transfer times is reflected in the passengers’route-choice behaviors. Using the proposed bi-level programming model, optimal bus lines are selected from a set of can-didate bus lines; thus, the corresponding bus lane network on which the selected bus lines run is determined. The solution method using a genetic algorithm in the bi-level program-ming model is developed, and two numerical examples are investigated to demonstrate the efficacy of the proposed model.
Introduction
With the development of economy and society and the concurrent expansion of populations and city geographies, traffic congestion has become a difficult problem to manage in cities. In recent years, sustainable transportation has become a popular research topic, and the rapid development of public transportation is an important approach because high-capacity public transportation can carry more people within the same road area and release less pollution than if private cars were used. Urban public transportation modes typically include subways, buses, and public bicycles. The enhancement of existing bus operation systems lies in the design of bus-only lanes and signal priority and in the development of clean-energy buses[1–3].The objective of this study is to determine the layout of bus-only lanes. Urban bus lanes are separate lanes that are identified by special traffic signs and road markings or other isolation facilities and are exclusively for bus use throughout the day or during special periods of the day. To date, many countries have built bus lanes in cities, including the BRT system of Curitiba in Bra-zil. The planning of bus lanes is important for bus priority and can dramatically improve the attraction of buses, increase the ratio of bus trips taken by the public and therefore reduce traf-fic congestion[4]. Some studies have investigated bus lane capacities[5,6], service levels[7,8]
and effect evaluations[9–12]. However, to improve the efficiency of bus lanes, a method or
OPEN ACCESS
Citation:Chen Q (2015) An Optimization Model for the Selection of Bus-Only Lanes in a City. PLoS ONE 10(7): e0133951. doi:10.1371/journal.pone.0133951
Editor:Xiaosong Hu, University of California Berkeley, UNITED STATES
Received:January 30, 2015
Accepted:July 4, 2015
Published:July 27, 2015
Copyright:© 2015 Qun Chen. This is an open access article distributed under the terms of the
Creative Commons Attribution License, which permits unrestricted use, distribution, and reproduction in any medium, provided the original author and source are credited.
Data Availability Statement:All relevant data are within the paper.
Funding:The authors received no specific funding for this work.
model for bus lane layout should be developed. Recently, bus lane network design has been increasingly considered during the planning of bus lanes[13,14]. However, there are still dif-ferences between the models and applications because the models do not reflect the transfer choice behaviors of passengers or the accessibility of all travel demands.
The selection of bus-only lanes can be considered to be a type of network design problem (NDP) that is concerned with the modification of a transportation network configuration by adding new links or improving existing ones to maximize certain social welfare objectives (e.g., total travel time over the network) within a limited budget[15]. NDPs are generally formulated as a mathematical problem with equilibrium constraints (MPEC) and a determinate user-equi-librium assignment model (UE)[16–20]or a stochastic user-equilibrium assignment model
(SUE)[21–23]was usually applied to describe the route choice behavior of network users. However, in bus transportation systems, the route choice behavior of network users is related to the transfer times between bus lines; thus, a different traffic assignment method must be used, and different solution schemes should be pursued. Some studies have proposed models to optimize the layout of transit routes[24–28]but did not consider the optimization of bus lane networks or that passengers’route choice behaviors can be influenced by transfer times. In this study, we develop a model to optimize bus-only lane networks under certain budget con-straints while considering the priority sequence of transfer times in the passengers’route choice behaviors.
The remainder of this paper is organized as follows. Section 2 formulates the model used to optimize the layout of urban bus-only lanes. Section 3 develops a solution algorithm for the model. In Section 4, two numerical examples are used to demonstrate the efficacy of the pro-posed model. The final section concludes the paper.
Model Formulation
In the design of bus-only lane networks, the urban population, land-use scale and properties, urban morphology and topographic conditions should be considered; a survey and prediction of passenger flows are also necessary. To construct an appropriate model, some assumptions and preparative work must be performed:
1. Traffic zoning based on the analyses of land-use properties and topographic conditions (i.e., a zone radius of approximately 1–2 km) should be performed, and the public transit passen-ger flow distribution between zones should be known.
2. Because the locations of stops are unknown before the layout of bus lane networks is com-pleted, this paper only optimizes the lines’arrangement and does not consider stop loca-tions to simplify the analysis; similarly, the restriction of stop capacities is ignored.
3. Although stops are not considered, passenger transfer between bus lines occurs at stop loca-tions; thus, it is assumed that all stops within a traffic zone are collected at one point, and the distance between the stops becomes the distance between the zones’centroids. This assumption is necessary before lines can be planned because the stop locations are unknown, and stops are not considered until the lines’arrangement is completed.
4. The average transfer time between bus lines can be estimated based on surveys and forecasts.
Upper-level Model
An analysis of the goals of the upper-level model is described below. The first goal of this model is to minimize the total travel time:
min X m
X
n
odðm;nÞlnm ð1Þ
The second goal of this model is to minimize the total length of the bus lanes because con-structing bus-only lanes is costly, requires significant amounts of land, and affects other users of the road:
min X 8i;j2R
lijZij ð2Þ
The third goal of this model is to minimize the total operation and management costs of the bus systems using the bus lanes:
min X k
mkgk ð3Þ
In formulas (1), (2) and (3),od(m,n) is thenthportion of an OD (i.e., origin-destination) pairmof public transit passenger flows and is described byod(m) =X
n
odðm;nÞ;lnmis the
travel time ofod(m,n) along its path, including the in-vehicle time, walk time, waiting time and transfer time;iandjare the zone codes;Ris the set of traffic zones;ηijis a Boolean variable
that equals 1 when there is a bus lane connecting zoneiwith zonejand 0 otherwise;lijis the length of the bus lane connecting zoneiwith zonej;γkis a Boolean variable that equals 1 when
thekthcandidate bus line is selected and 0 otherwise; andμkis the operation and management
cost of thekthcandidate bus line.
The above formulas (1), (2) and (3) denote a multi-objective program in which the optimal solution is difficult to determine. However, we can use a budget constraint to replace formulae (2) and (3):
X
8i;j2R
lijyijZijþ
X
k
mkgkbudget ð4Þ
whereθijis the unit price oflij.
In addition, accessibility constraints can guarantee that passengers from any zone can arrive at any other zone through the bus line network:
X
8i;j2R
sij6¼ 1 ð5Þ
wheresijrefers to the travel time of the shortest path with regard to time between zonesiandj. If it is assumed that the required transfer times on any valid path between any two zones is at most twice as long,sijis the shortest travel time within two times of transfer between any two zones.
Lower-level Model
flow assignment on the paths, it is easy to understand the following concept for paths on a given priority level. (1) For travelers, particularly commuters, the required average travel time along each possible path is known before their trips because the bus routes are generally fixed. (2) Under the conditions that the number of buses and departure frequencies are fixed, the travel time of each route generally has no direct connection with the number of passengers on the route; thus, traffic impedance can be represented by a relatively constant value if passenger comfort is ignored. Additionally, for paths on a given priority level, the order of travelers’ selec-tion should be as follows. The shortest path with regard to time or the path having the mini-mum traffic impedance while considering the travel time, fees and transfer times should be the passenger’s first choice. In addition, due to the limitations of route capacities, some passengers will be left at bus stops if no additional capacity is available. The capacity of one route is related to the number of seats on the bus, the departure frequency and the load factor. Capacity limita-tions typically make passengers unable to select crowded routes; those passengers must then select paths with a lower priority level that may require transfers.
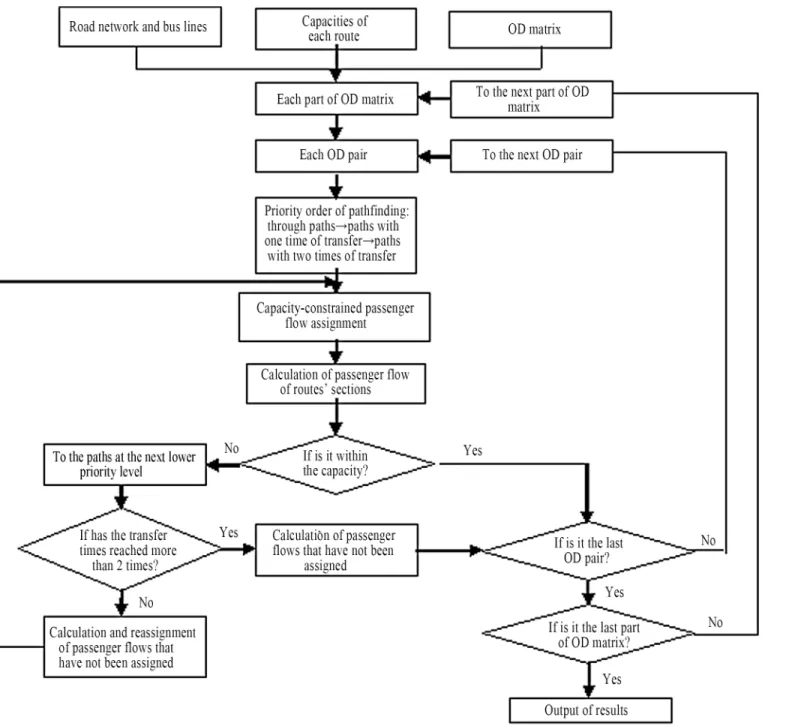
From the above analysis, the capacity-constrained traffic assignment method can be applied. Therefore, the order of travelers’path selection should be as follows: through paths!paths with one transfer!paths with two transfers. Additionally, for paths on the same priority level, the shortest path with regard to time is selected first; the other longer paths or paths at a lower priority level are not selected until the capacity of one route is reached. When the capac-ity-constrained traffic assignment model is applied, the OD matrix of public transit passenger flow should be divided into several parts, and all parts should be assigned to the network.Fig 1
shows the logic flow diagram of the capacity-constrained traffic assignment.
Analyses of the public traffic impedance and path-finding methods are introduced as follows.
(1) Public traffic impedance
The public traffic impedance is an index that comprehensively considers travel time, fees and passenger comfort. Wang [29] introduced an expression of the public traffic impedance that considers the travel time and the ticket price that vary with the distance; however, because many cities have applied single-entrance ticket systems and the fee paid for riding on buses is comparatively small compared to peoples’income, this study primarily considers travel time and ignores fees:
T¼D=Vþ ðtwþti=2þothÞ=60 ð6Þ
whereTis the total travel time (hour),Dis the distance (km),Vis the average speed of the buses (km/h),twis the sum of the time to walk to and from bus stops (min),tiis the departure interval (min),ωis the transfer times andthis the time to complete a transfer (min). When pas-senger comfort is ignored, public traffic impedance can be relatively constant.
(2) Path-finding methods
The steps used to find paths are described as follows:
①Take bus lineL1passing through the start pointI;
②Determine if lineL1passes through the end pointJ; if not, then return to step①; if yes, then go to the next step;
③Record the path from pointItoJusing bus lineL1;
The steps used to find paths with one transfer are described as follows:
①Take bus lineL1passing through the start pointI;
②Take bus lineL2passing through the end pointJ;
③Determine if bus lineL2intersects bus lineL1; if not, return to steps②and then①; if yes, then go to the next step;
④Record the paths fromItoJusing bus linesL1andL2; Fig 1. Logic flow diagram of the capacity-constrained traffic assignment.
⑤If there are other lines passing through the end pointJ, then return to step②; if there are other lines passing through the start pointI, then return to step①; if not, end.
The steps used to find paths with two transfers are described as follows:
①Take bus lineL1passing through the start pointI;
②Take bus lineL2intersecting with bus lineL1;
③Take bus lineL3intersecting with bus lineL2;
④Determine if bus lineL3passes through the end pointJ; if not, then return to steps③, then
②and then①; if yes, then go to the next step;
⑤Record the paths fromItoJusing bus linesL1,L2andL3;
⑥If there are other lines that intersect bus lineL2, then return to step③; if there are other
lines that intersect bus lineL1, then return to step②; if there are other lines that pass through the start pointI, then return to step①; if not, end.
After all paths have been found, and the buses’speed and transfer times have been calcu-lated, the travel time can then be calculated.
Solution Algorithm
The upper-level model is a 0–1 programming problem with constraints; thus, a genetic algo-rithm’s 0–1 coding is suitable for solving this problem.
Applying 0–1 coding, and assuming that there areYcandidate lines in total, the chromo-some can be expressed as follows:
½0;1;1;0;. . .;0;0;1
where the number 1 denotes that this route is selected, and the number 0 denotes that this route is not selected.
Steps for solving the model using the genetic algorithm are described as follows:
Step1. Initialization. Set the population size, the chromosome length, the number of iterations, the crossover rate, and the mutation rate.
Step2. Apply 0–1 coding to randomly produce the initial population, and setgen= 1.
Step3. Pass the solutions denoted by the chromosomes of the population to the lower-level model, and find the paths for each OD pair through the capacity-constrained traffic assign-ments. Then, return to the upper-level model, and calculate the fitness of each individual and the excess of the constraint restrictions; for feasible solutions, the excess is 0. Ifgen=
MaxGen(i.e., the maximum number of iterations has been reached), output the optimal individual; otherwise, go tostep4.
Step4. Use the roulette method based on ranking to select the next generation’s population.
Step5. In terms of the crossover ratePc, perform a single-point crossover operation.
Numerical Examples
Example 1
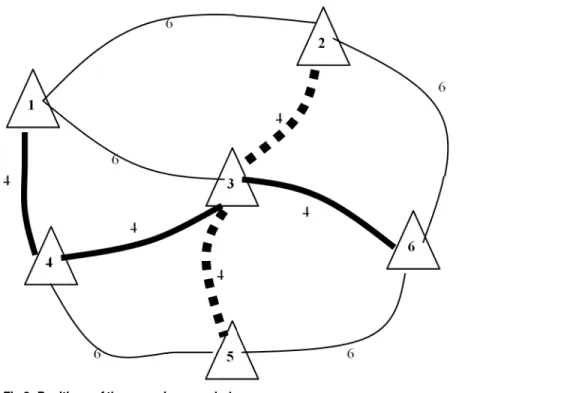
In this example, bus lanes are built to connect 6 primary zones.Fig 2shows the positions of the zones and the in-vehicle time of each side (unit: min). The transfer time between any two lines is set equal to 2 min, and the lengths of the sides are as follows: 1–4 is 2 km; 4–5 is 3 km; 5–6 is 3 km; 6–2 is 3 km; 1–2 is 3 km; 1–3 is 3 km; 2–3 is 2 km; 3–6 is 2 km; 3–4 is 2 km; and 3–5 is 2 km. The candidate bus lines are:①1–3–6;②1–4–3–6;③4–5–6–2;④1–4–5–6; and⑤
2–3–5.
It is assumed that the total length of the bus lines cannot exceed 10 km, and the capacity in one direction of each line is 2000 persons per day.Table 1shows the OD pairs.
The chromosome length is equal to 5 (i.e., the number of candidate lines), the size of the population is equal to 150, the crossover rate is set equal to 0.7 and the mutation rate is set equal to 0.05. Using Matlab 7.0 software, the optimal solution can be obtained after 15 Fig 2. Positions of the zones in example 1.
doi:10.1371/journal.pone.0133951.g002
Table 1. OD pairs (unit: persons per day) in example 1.
D 1 2 3 4 5 6
O
1 0 100 200 600 50 200
2 100 0 500 100 400 150
3 200 100 0 400 400 400
4 600 100 400 0 100 400
5 50 400 400 100 0 100
6 200 150 400 400 100 0
iterations, and the bus lines denoted by the optimal solution are②1–4–3–6 and⑤2–3–5. The total travel time of the passengers is equal to 26200 min. The flow rates in one direction are shown inTable 2; two directions have the same flow rates. The transfer flow rates at node 3 between the two lines are both equal to 600 persons per day.
Thus, the bus lanes to be built include lanes 1–4, 4–3, 3–6, 2–3, and 3–5.
Example 2
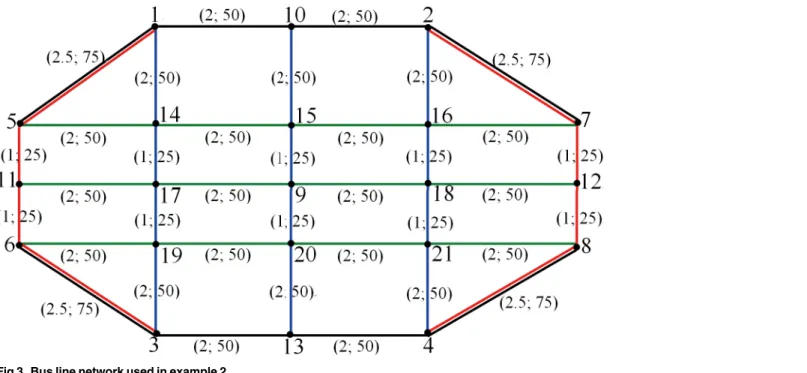
There are 10 candidate bus lines in total shown inFig 3: bus line①(5-1-10-2-7), whose capac-ity in one direction is 200 persons per hour; bus line②(6-3-13-4-8), whose capacity in one direction is 200 persons per hour; bus line③(1-5-11-6-3), whose capacity in one direction is 200 persons per hour; bus line④(2-7-12-8-4), whose capacity in one direction is 200 persons
per hour; bus line⑤(5-14-15-16-7), whose capacity in one direction is 400 persons per hour; bus line⑥(11-17-9-18-12), whose capacity in one direction is 400 persons per hour; bus line
⑦(6-19-20-21-8), whose capacity in one direction is 400 persons per hour; bus line⑧ (1-14-17-19-3), whose capacity in one direction is 300 persons per hour; bus line⑨(10-15-9-20-13),
whose capacity in one direction is 300 persons per hour; and bus line⑩(2-16-18-21-4), whose capacity in one direction is 300 persons per hour.
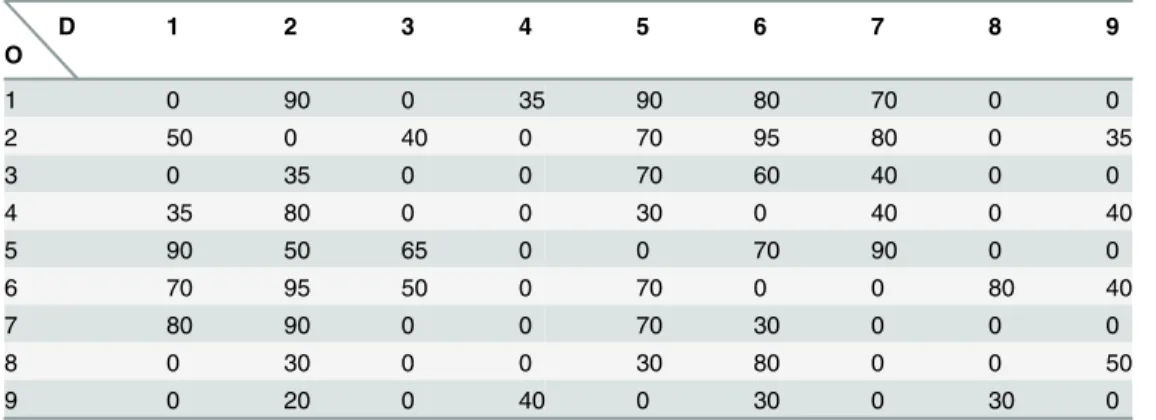
The bus travel time (unit: min) and the construction cost (unit: million dollars) of each side inFig 3are presented in parentheses. The operation and management costs of each bus line is 100 million dollars, and the total budget for this project is set equal to 1,800 million dollars. The transfer time between any two bus lines is set equal to 5 min. The origin-destination (OD) traffic distribution is shown inTable 3.
Table 2. Flow rates in one direction (unit: persons per day).
Link 1–4 4–3 3–6 2–3 3–5
Flow 1150 1550 1250 1250 1050
doi:10.1371/journal.pone.0133951.t002
Fig 3. Bus line network used in example 2.
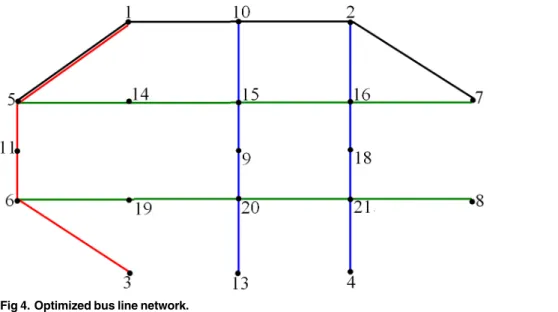
The length of the chromosome is equal to 10 (i.e., 10 candidate lines), the size of population is equal to 100, the crossover rate is set equal to 0.7 and the mutation rate is set equal to 0.1. The loaded ratios of the OD traffic distribution in the capacity-constrained traffic assignments are 0.2, 0.2, 0.15, 0.1, 0.1, 0.05, 0.05, 0.05, 0.05 and 0.05 in sequence. Using Matlab 7.0 software, the optimal solution can be obtained after 15 iterations, and the bus lines denoted by the opti-mal solution are:①,③,⑤,⑦,⑨and⑩. The total travel time of passengers is equal to 26 810 min. The flows of each bus line are shown inTable 4, and the transfer flows between the two lines are shown inTable 5. The optimized bus line network is shown inFig 4; thus, the bus lanes to be built include lanes 1–5, 1–10, 10–2, 2–7, 5–14, 14–15, 15–16, 16–7, 6–19, 19–20, 20–21, 21–8, 5–11, 11–6, 3–6, 10–15, 15–9, 9–20, 20–13, 2–16, 16–18, 18–21, and 21–4.
Conclusions
The rapid development of public transportation can alleviate serious traffic congestion in cities, provide comfortable and convenient transportation service for more people than private vehi-cles and achieve sustainable development in urban transportation. Bus-only lanes can allow buses to operate in special lanes without disturbances from other forms of traffic, allowing buses to run faster and making public transportation more attractive to passengers. A bi-level optimization model used to determine the layout of bus-only lanes is proposed in this study. The goal of the upper-level model is to minimize the total travel time of passengers while con-sidering accessibility and budget constraints; the goal of the lower-level model is to develop a capacity-constrained traffic assignment model that describes passenger flow assignments on bus lines. Using this bi-level model, optimal bus lines are selected from a set of candidate bus lines; thus, the corresponding bus lanes are identified. Two numerical examples are used to demonstrate the effectiveness and feasibility of the proposed model.
The primary contributions of this study are as follows. (1) The transfer choice behaviors of passengers are considered in the proposed model. In passengers’route choice behaviors, a pri-ority sequence of transfer times is considered first, and fewer transfer times are considered to be preferred. Then, for paths with the same transfer times, the path with the shortest time is selected, and the other longer paths or paths with more transfer times are not selected until the capacity of one route is reached. In addition, path-finding methods including finding through paths, paths including one transfer and paths including two transfers are analyzed. (2) A bi-level model is proposed to optimize the layout of bus-only lanes within a given area; the upper-level model evaluates each scheme of the layout of bus-only lanes, and the lower-upper-level model calculates the passenger flow assignments on each bus route under the scheme provided by the Table 3. OD pairs (unit: persons per hour) in example 2.
D 1 2 3 4 5 6 7 8 9
O
1 0 90 0 35 90 80 70 0 0
2 50 0 40 0 70 95 80 0 35
3 0 35 0 0 70 60 40 0 0
4 35 80 0 0 30 0 40 0 40
5 90 50 65 0 0 70 90 0 0
6 70 95 50 0 70 0 0 80 40
7 80 90 0 0 70 30 0 0 0
8 0 30 0 0 30 80 0 0 50
9 0 20 0 40 0 30 0 30 0
Table 4. Flow rates of each bus line.
Bus line①: 5-1-10-2-7 Bus line③: 1-5-11-6-3
Link Flow rate (persons per hour) Link Flow rate (persons per hour)
5!1 209 5!1 191
1!5 211 1!5 208
1!10 206 5!11 209
10!1 203 11!5 225
10!2 217 11!6 209
2!10 222 6!11 225
2!7 198 6!3 155
7!2 206 3!6 205
Bus line⑤: 5-14-15-16-7 Bus line⑦: 6-19-20-21-8
Link Flow rate (persons per hour) Link Flow rate (persons per hour)
5!14 319 6!19 291
14!5 330 19!6 297
14!15 319 19!20 291
15!14 330 20!19 297
15!16 231 20!21 226
16!15 251 21!20 260
16!7 201 21!8 110
7!16 145 8!21 190
Bus line⑨: 10-15-9-20-13 Bus line⑩: 2-16-18-21-4
Link Flow rate (persons per hour) Link Flow rate (persons per hour)
10!15 19 2!16 149
15!10 11 16!2 268
15!9 145 16!18 95
9!15 128 18!16 291
9!20 210 18!21 95
20!9 238 21!18 291
20!13 0 21!4 75
13!20 0 4!21 225
As shown inTable 4, theflow rates of some links are marginally larger than their capacities because the OD traffic distribution is proportionally loaded onto the network in the traffic assignment, which may cause in-vehicle congestion among passengers.
doi:10.1371/journal.pone.0133951.t004
Table 5. Transfer flow rates between pairs of lines.
Node 1 Node 2 Node 5 Node 6 Node 7
Direction Flow rate Direction Flow rate Direction Flow rate Direction Flow rate Direction Flow rate
①!③ 0 ①!⑩ 19 ①!③ 74 ③!⑦ 65 ①!⑤ 0
③!① 71 ⑩!① 19 ③!① 0 ⑦!③ 63 ⑤!① 0
①!⑤ 0
⑤!① 47 ③!⑤ 145 ⑤!③ 75
Node 10 Node 15 Node 16 Node 20 Node 21
Direction Flow rate Direction Flow rate Direction Flow rate Direction Flow rate Direction Flow rate
①!⑨ 19 ⑤!⑨ 126 ⑤!⑩ 96 ⑦!⑨ 238 ⑦!⑩ 146
⑨!① 11 ⑨!⑤ 117 ⑩!⑤ 173 ⑨!⑦ 210 ⑩!⑦ 100
upper-level model. The results of the traffic assignments are then returned to the upper-level model to evaluate each scheme of the layout of bus-only lanes. (3) The accessibility of all travel demands can be guaranteed through accessibility constraints in the proposed model, which ensure that passengers from any zone can arrive at any other zones using the bus line network.
However, some issues should be addressed in the future. For example, this study did not consider bus stop capacities, passenger comfort or riding fees. These issues must be further investigated in the future.
Author Contributions
Conceived and designed the experiments: QC. Performed the experiments: QC. Analyzed the data: QC. Contributed reagents/materials/analysis tools: QC. Wrote the paper: QC.
References
1. Hu XS, Murgovski N, Johannesson LM, Egardt B. Comparison of three electrochemical energy buffers applied to a hybrid bus powertrain with simultaneous optimal sizing and energy management. IEEE Trans Intell Transp Syst. 2014; 15: 1193–1205.
2. Hu XS, Murgovski N, Johannesson LM, Egardt B. Optimal dimensioning and power management of a fuel cell/battery hybrid bus via convex programming. IEEE-ASME Trans Mechatronics. 2015; 20: 457– 468.
3. Hu XS, Johannesson L, Murgovski N, Egardt B. Longevity-conscious dimensioning and power man-agement of the hybrid energy storage system in a fuel cell hybrid electric bus. Appl Energy. 2015; 137: 913–924.
4. Surprenant-Legault J, El-Geneidy AM. Introduction of reserved bus lane impact on bus running time and on-time performance. Transp Res Rec. 2011; 2218: 10–18.
5. Chiabaut N, Xie X, Leclercq L. Road capacity and travel times with bus lanes and intermittent priority activation analytical investigations. Transp Res Rec. 2012; 2315: 182–190.
6. Herbert SL, Kevin RSJ. Bus lane capacity revisited. Transportation Research Board Annual Meeting, 1998.
7. Tse LY, Hung WT, Sumalee A. Bus lane safety implications: a case study in Hong Kong. Transportme-trica A, Transp Sci. 2014; 10: 140–159.
8. Vijay KM, Harry ES, Andy S. New Jersey Route 495 exclusive bus lane safety study. Traffic Congest Traffic Saf. 1999; 3: 319~325.
9. Li S, Ju Y. Evaluation of bus-exclusive lanes. IEEE Trans Intell Transp Syst. 2009; 10: 236–245.
Fig 4. Optimized bus line network.
10. Sakamoto K, Abhayantha C, Kubota H. Effectiveness of bus priority lane as countermeasure for con-gestion. Transp Res Rec. 2007; 2034: 103–111.
11. Patankar VM, Kumar R, Tiwari G. Impacts of bus rapid transit lanes on traffic and commuter mobility. ASCE-J Urban Plan Dev. 2007; 133: 99–106.
12. Zhu L, Yu L, Chen XM. Simulated analysis of exclusive bus lanes on expressways: case study in Bei-jing, China. J Public Transp. 2012; 15: 111–128.
13. Khoo HL, Teoh LE, Meng Q. A bi-objective optimization approach for exclusive bus lane selection and scheduling design. Eng Optimiz. 2014; 46: 987–1007.
14. Yao J, Shi F, Zhou Z. Combinatorial optimization of exclusive bus lanes and bus frequencies in multi-modal transportation network. ASCE- J Transp Eng. 2012; 138: 1422–1429.
15. Yang H, Bell MGH. Models and algorithms for road network design: a review and some new develop-ments. Transp Rev. 1998; 18: 257–278.
16. Gao Z, Wu J, Sun H. Solution algorithm for the bi-level discrete network design problem. Transp Res., Part B. 2005; 39: 479–495.
17. Luathep P, Sumalee A, Lam WHK, Li Z, Lo HK. Global optimization method for mixed transportation network design problem: A mixed-integer linear programming approach. Transp Res., Part B. 2011; 45: 808–827.
18. Wang DZW, Lo HK. Global optimum of the linearized network design problem with equilibrium flows. Transp Res., Part B. 2010; 44: 482–492.
19. Wang DZW, Liu HX, Szeto WY. A novel discrete network design problem formulation and its global opti-mization solution algorithm. Transp Res., Part E. 2015; 79: 213–230.
20. Wang S, Meng Q, Yang H. Global optimization methods for the discrete network design problem. Transp Res., Part B. 2013; 50: 42–60.
21. Davis GA. Exact local solution of the continuous network design problem via stochastic user equilibrium assignment. Transp Res., Part B. 1994; 28: 61–75.
22. Uchida K., Sumalee A., Watling D. P., and Connors P.. A study on network design problems for multi-modal networks by probit-based stochastic user equilibrium. Netw Spat Econ. 2007; 7: 213–240.
23. Liu H, Wang DZW. Global optimization method for network design problem with stochastic user equilib-rium. Transport. Res., Part B. 2015; 72: 20–39.
24. Fan W, Machemehl R. Using a simulated annealing algorithm to solve the transit route network design problem. ASCE- J Transp Eng. 2006; 132: 122–132.
25. Mauttone A, Urquhart ME. A route set construction algorithm for the transit network design problem. Comput Oper Res. 2009; 36: 2440–2449.
26. Bagloee AS, Ceder A. Transit-network design methodology for actual-size road networks. Transp Res., Part B. 2011; 45: 1787–1804.
27. Nayeem MA, Rahman MK, Rahman MS. Transit network design by genetic algorithm with elitism. Transp Res., Part C. 2014; 46: 30–45.
28. Yao B, Hu P, Lu X, Gao J, Zhang M. Transit network design based on travel time reliability. Transp Res., Part C. 2014; 43: 233–248.