MEASURE THE CLIMATE, MODEL THE CITY
Effrosyni Boufidou and Tom J.F. Commandeur and Simeon B. Nedkov and Sisi Zlatanova
MsC Geomatics Delft University of Technology Kluyverweg 1, 2629 HS Delft, The Netherlands
[email protected], [email protected], [email protected], [email protected] http://weblog.tudelft.nl/media/blogs/105293/GSP 2010 final report.pdf
Commission IV/WG8
KEY WORDS:Databases, urban, three-dimensional, measurement, monitoring, GPS/INS, reconstruction
ABSTRACT:
Modern large cities are characterized by a high building concentration, little aeration and lack of green spaces. Such characteristics create an urban climate which is different from the climate outside of cities. An example of an urban climate effect is the so-called Urban Heat Island: cities tend to be warmer than the surrounding rural areas. The higher temperature results in an increase in energy consumption since people, especially in summer, use artificial means to cool themselves. Although means of mitigating the UHI effect exist, they are difficult to justify, as knowledge about urban climate is limited, and analysis tools are lacking. This paper presents the work carried during the 2010 MSc Geomatics Synthesis Project. A 3D spatial relational database has been implemented which is meant to act as starting point in the development of a 3D climate-enabled geographical information system. To this end, the database stores 3D geometries representing the built environment and its thematic properties. The database is also able to store measurements of climate parameters, in this case temperature, obtained through mobile sensors. Spatial analyses and queries are supported, allowing users to calculate areas, distances, buffers, add and remove geometries and thematic attributes. The database design is based on theCityGML information model which has been extended to allow the storage of climate parameters relevant to urban climate research.
1 INTRODUCTION
An ever increasing number of people is living in urban areas. The impact cities have on their surroundings grows in tandem with their size. Knowledge about how cities interact with the world around them is needed. Urban climate research, defined by Oke (2005) as the field ”concerned with the interactions between the atmosphere and human settlements”, is therefore becoming more important. Urban climate is a complex phenomenon spanning many disciplines such as meteorology, climatology, geography, engineering, social planning, etc. Bringing these fields together at each research stage is a challenging task due to the wide range of used data types and needed analysis operations. The use of a Geographical Information System (GIS) comes to mind as it allows the storage, manipulation, analysis and visualization of a wide range of (geographical) data types. However, traditional GI systems are not geared towards climate research and, more importantly, are not able to handle complex three-dimensional (3D) urban landscapes.
This paper showcases the successful implementation of one of the four GIS blocks, namely storage. A 3D database has been implemented which stores the geometries of urban objects and their thematic attributes. A mobile sensing system has been built to demonstrate the database’s fitness for climate research. The work has been carried out as part of the Synthesis Project of TU Delft’s MSc Geomatics, which was dedicated to the university-wide Climate City Campus (CCC) project. The CCC’s goal is to turn the university campus in a test bed for urban climate re-search. The first section of this paper identifies important urban climate components, namely the notion of scale and energy trans-ferred through object surfaces, and how these are to be observed and stored in a database. The second section highlights the fol-lowed methodology. The last section shows some of the database functionalities. The paper is concluded with conclusions and fu-ture work.
2 URBAN CLIMATE RESEARCH
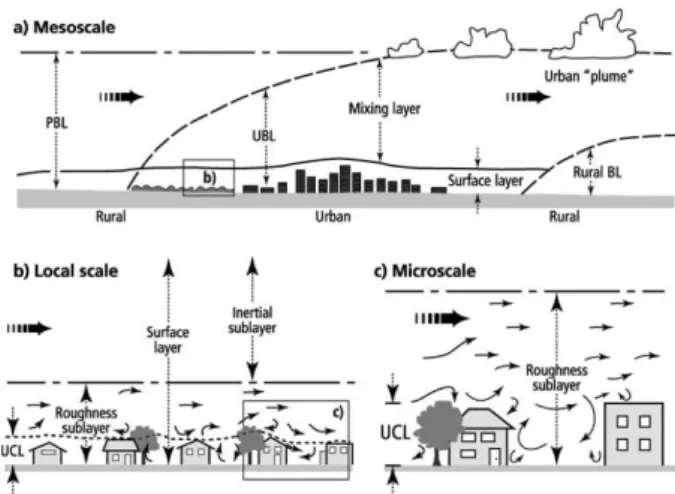
Climate research consists of eight stages: conceptualization, the-ory, observation, mathematical modelling, validation, application and evaluation (Oke, 2005). Scale is of great importance in all of these stages, as the phenomena defining climate, although of the same nature, manifest themselves in distinct ways throughout the different scales (Arnfield, 2003). Figure 1 shows the various cli-mate scales. These scales are not interchangeable; measurements, analysis and research performed in one scale cannot be used to draw conclusions about a different scale (Oke, 2005). The choice of scale depends on the size of the area under investigation.
Figure 1: The vertical subdivision of the atmosphere along with the relevant urban climate scales, after Oke (2007)
together and providing the infrastructure (i.e. sensor networks, data storage, communication, facilities) required in their climate projects. The CCC’s main focus is the city; the focus of the pre-sented work is therefore on the microscale urban climate (Piringer et al., 2002). The microscale urban climate is defined by the in-teraction between city elements such as buildings, roads, green spaces, etc. and climatic parameters (Oke, 2007). In the horizon-tal direction, microscale urban climate is typically investigated to an area of several hundreds of meters. In the vertical direction, the atmosphere division is more complicated. The urban micro-climate treats phenomena occurring in the Roughness Sub-layer (RS) of the Surface Layer and the Urban Canopy Layer (UCL). The RS actually includes the UCL which consists of individual street canyons and other roughness elements, i.e. buildings, trees, etc. (see Figure 1).
The temperature inversions and the wind speed pattern, being im-portant elements of the Urban Heat Island (UHI) effect, are only some of the phenomena observed across the UCL (Oke, 2007).
Focusing on the urban microclimate, Arnfield (2003) argues on the importance of describing how the urban ”surface” interacts with the adjacent atmospheric layer and what the result is, in terms of radiation exchange and ventilation. The urban surface includes all the components of the city elements such as the walls and roofs of buildings, the irrigated or non-irrigated green spaces, the paved or asphalt roads as well as the presence and structure of trees. All these components have various thermal, aerodynamic and moisture properties which result in diverse energy budgets and therefore in diverse surface characteristics e.g. surface tem-perature or aeration, depending on the location. Such a variation in the surface properties, leads to interaction and energy exchange between the surfaces as well as to thermal radiation transfer to the environment (Blankenstein and Kuttler, 2004). One of the effects of these interactions is the so-called Urban Heat Island i.e. the difference between urban and rural air temperatures, most promi-nently present at dusk when urban area temperatures are several degrees higher than rural areas’ ones.
2.1 Urban Climate Monitoring
The urban microclimate is formed by energy transfers between urban surfaces and the environment as described above. Under-standing urban climate begins by underUnder-standing how these energy transfers manifest themselves. One needs, therefore, to closely investigate the surface properties and the climatic conditions in the RS and the UCL and study how these relate to one another.
In this study, the surface properties have been termedstatic cli-mate parameters as these have a low variability. Staticclimate parameters are fixed to physical objects and represent surface properties such as color, reflectivity, emissivity, etc. The param-eters characterizing the RS and UCL atmospheric conditions are here termeddynamicclimate parameters i.e. continuous variables which have a spatio-temporal dimension e.g. temperature, wind speed, air humidity, etc. Staticclimate parameters can be ob-served, whiledynamicclimate parameters have to be measured with sensors.
According to Davies et al. (2008), Rahola et al. (2009), Akbari et al. (2001), Solecki et al. (2005), Stewart and Oke (2009), sev-eral static climate parameters have been identified as important to urban climate research.
• Surface properties (color, reflectivity, heat conductivity, heat
capacity, etc.) give measure to the amount of reflected and absorbed sun radiation.
• Buildings and their location, orientation and geometry
de-fine their interaction with wind and sun radiation absorption and reflectance.
• Building facade properties; the type of facade determines
the buildings heat exchange with the environment. For in-stance, facades made from glass generally leak more energy than other types of materials.
• Vegetation; grass, bushes, parks, etc. cool their immediate
surroundings through transpiration.
• Trees cool their direct environment by transpiration. Their
shadows prevent heat absorption by urban materials, while their canopies block air currents.
• Waterbodies cool their direct environment through
evapora-tion.
• Roofs may have favourable properties (in terms of material
and orientation) with regard to sun radiation absorption and reflectance.
• Terrain plays a major role in urban climate; its geometry has
direct influence on wind patterns, while its type (i.e. grass, water, asphalt, etc.) has a large influence on the amount of heat being absorbed and reflected, and the amount of water being evaporated.
Likewise, several important dynamic climate parameters have been identified.
• Air temperature.
• Object temperature.
• Air currents’ strength and direction; air temperature and air
pollution concentration are influenced by the air currents.
• Precipitation; precipitation measurements account for the
amount of water reaching the ground which is strongly cor-related to the functions and needs of the vegetation i.e. evap-oration, transpiration, photosynthesis.
• Energy consumption; monitoring energy consumption
re-flects peoples’ habits and thermal comfort levels. There is a correlation to the built environment material.
• Air humidity influences comfort and evapotranspiration
lev-els.
• Air pollution; CO2 and NOx concentration monitoring for definition of health and comfort in the urban environment.
Static climate parameters form an important part of computerized climate simulations as they capture the shape, location and sur-face properties of city objects. Static parameters act as input for heat and wind simulations. Although generating geometry and inputting it in a simulation is accounted for, still lacking is the ability to easily add, remove, move, adjust it and change its sur-face properties.
Most of the functionalities are present in the so-called Geograph-ical Information Systems (GIS). However, traditional GIS pack-ages are not suited for climate research as they are not able to store static and dynamic climate parameters next to each other. While urban climate is 3D, traditional GI systems are mainly 2D.
Building a climate-enabled 3D GIS is a challenging task. TU Delft has initiated the CCC project with the aim to create a physi-cal as well as digital environment for facilitating climate research projects. First steps towards such a 3D climate-enabled GIS have been made during the execution of the presented project by im-plementing a 3D database that is able to store geometrical rep-resentations of urban areas as well asstaticanddynamicclimate parameters. Sincedynamicclimate parameters change over time and space, it is desirable to be able to measure them continuously and upload the measurements to the database. A proof-of-concept for this functionality has been implemented by equipping sensors with a positioning technology and providing means to store the measurements in the database.
3 METHODOLOGY
A large portion of the decisions made during the implementation phase, has been based on talks with TU Delft climate researchers about their needs in terms of the database functionality. Among them, the most important have been, that the stored data must be easy to modify and alter (i.e. move/remove/add geometries) and that the database must be easy to extend, to be able to support future climate research projects.
Based on the researcher’s requirements and the climate research presented in the previous section, it has been decided to store the following static climate parameters in the database: build-ings, trees, waterbodies, vegetation, terrain and landcover infor-mation. A single dynamic parameter, namely air temperature, has been chosen to be measured and stored. Consequently, choices have been made about the geometry representation model, type of database and database schema.
3.1 Storing and Managing Static Climate Parameters
The CityGML based 3DCityDB (http://www.3dcitydb.org/) has been used to store data. CityGML has been chosen as the in-formation storage model as it has several properties which are deemed important for climate research. First, CityGML allows the storage of thematic data alongside geometry. For each geom-etry it is possible to store its surface parameters. This is how the staticclimate parameters have been stored. Second, CityGML geometries can have one of four levels-of-detail (LOD). As such, CityGML is fit for multi-scale climate research. Third, CityGML is defined in UML which makes it easy to extend and be applied to different types of climate research (Groger et al., 2008).
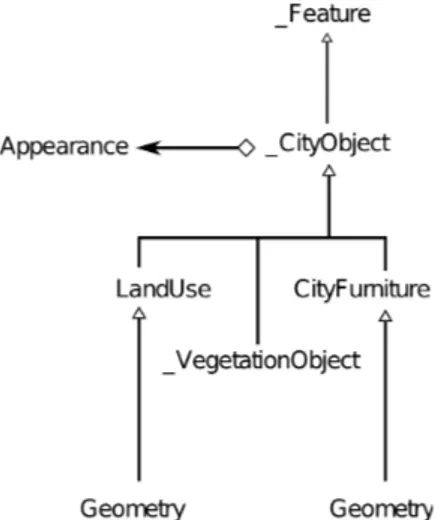
CityGML is an object-oriented 3D information storage model. Objects are stored as classes and/or aggregations of classes i.e. a city is an aggregation of buildings, trees, surfaces and generic ob-jects. Each building in turn is an aggregation of windows, doors, walls, etc. The semantic and thematic object properties are stored in the same manner. Figure 2 illustrates a heavily simplified ver-sion of the CityGML models and how they relate to one another.
Each CityGML object is of type Feature. Each Featureis an ag-gregation of an Addressand a CityObjectfeature. A CityObject is an abstract class storing the appearance, geometry and type of an urban object. TheAppearance modulestores the observable properties of an object and its surfaces such as texture, colour, shininess, transparency, smoothness, etc. Object geometry is stored
in theGeometry module. Geometries are modelled as aggrega-tions of geometry primitives such as points, lines, faces, etc. or as implicit geometries (as so-called ’blobs’ which are able to store external data formats such as 3D StudioMax and Collada). Fi-nally, thematic information about an object i.e. its type, is stored as a feature defined in theThematic module. Native CityGML thematic features are LandUse, VegetationObject, CityFurniture,
Building, etc.
3DCityDB is a database schema for PostGIS and Oracle Spatial. The CityGML UML schema has been translated to a relational database schema by Kolbe et al. (2009) and the relationships between CityGML classes have been modelled as relationships between tables.
3.2 Spatial Database Storage and Functionality
The 3D database stores sensed measurements, geometries and thematic properties. Following is an overview of the stored ob-jects and how these have been sensed and/or reconstructed.
Climate parameters In Section 2.1 two types of climate pa-rameters that influence urban microclimate, have been defined. Static climate parameters are generally observed by remote sens-ing techniques such as laser scannsens-ing (buildsens-ing and tree geome-tries), photogrammetry (building geometry), satellite and aerial images (texture properties), maps (locations of objects), construc-tion plans (building surface characteristics) and by observaconstruc-tion with the naked eye. Static parameters that have a geometry (e.g. buildings, trees, terrain) are stored in the CityObjectclass. Static parameters which belong to geometries are stored in the Appear-ance class asX3DMaterial attributes. The following material properties have been defined in CityGML: shininess, transparency, ambient intensity, special color, diffuse color, emissive color and smoothness. This list can be easily extended to include other static climate parameters by extending the UML diagram and cre-ating new table columns in the database.
Dynamic climate parameters are measured by sensors as will be described in Section 3.3. They are stored as point objects in the database. CityGML does not have a native measurements class. There is, however, a classGenericCityObjectwhich is designed to store city objects that are not explicitly modelled by native CityGML thematic classes. EachGenericCityObjectclass has a
geometry and a set of attributes. Dynamicclimate parameters have been stored in theGenericCityObjectclass.
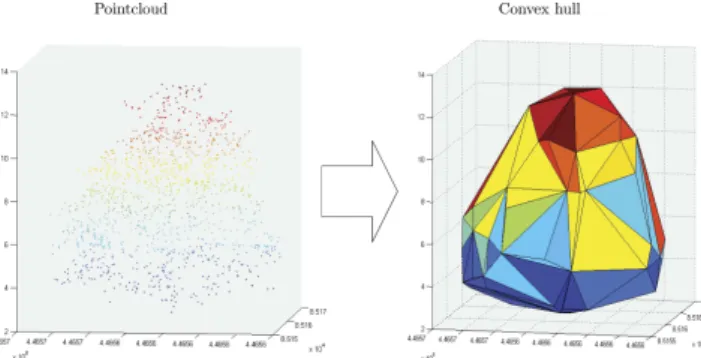
Trees Tree characteristics have been obtained through laser point cloud analyses. It is in theory possible to use laser-scan data to derive tree characteristics such as tree height and stem thickness as discussed by Maltamo et al. (2004), Holmgren (2004), and Maltamo (2004). Optimally, one would like to extract the tree’s branch structure, generate a geometry for it and store it in the database. However, this proved too involved. Instead, trees have been modelled using 3D convex hulls. Figure 3 shows the result.
Figure 3: The shape of the reconstructed trees is represented by their convex hulls
Another important tree parameter for climate research is the canopy density (Solecki et al., 2005). Knowledge of the canopy density is needed to estimate the so-called air blockage effect and to anal-yse the effect of canopy shadows. An attempt has been made to develop a method for the extraction of a canopy density measure, but this proved too challenging for this project.
Trees are stored in CityGML’s nativeSolitaryVegetationObject class. EachSolitaryVegetationObjecthas a geometry, a height, a trunk diameter, a species and several other properties. Among these properties, the Normalized Difference Vegetation Index (NDVI), being a measure for wind blockage, has been considered impor-tant urban climate indicator: a lower NDVI value translates into a lack of leaves, which in turn may be interpreted as a decrease in the blockage effect (Myneni et al., 2002). An extension to the CityGML schema has been made to accommodate NDVI.
Buildings and terrain The extrusion model created by Ledoux and Meijers (2010) has been used to store buildings in the database. The model is available in native CityGML and has been imported in the database using the 3DCityDB’s data importer/exporter (Kolbe et al., 2009).
Terrain geometry has been reconstructed from point cloud data using a Delaunay triangulation, whereas land cover data have been obtained from the Dutch large-scale base map (GBKN) and the vectorized topographic dataset TOP10NL. Terrain geometry has been stored in the database as aSurface Geometrywhereas land use information as aLandUseModel. Surface properties fi-nally, have been stored in theAppearance modelof each surface.
3.3 Dynamic Climate Parameters
Measuring is an important part of any research. Following is a outline of the implementation of a proof-of-concept for measur-ing air temperature usmeasur-ing a mobile sensmeasur-ing platform e.g. bicycle, in areas where GPS signals are weak or obstructed using a Wi-Fi positioning technique.
Measuring As discussed in section 2.1, dynamic climate pa-rameters are important to urban climate research. Being able to measure and store dynamic climate parameters is important for validating climate prediction models. Air temperature is consid-ered a simple but representative example of a highly variable dy-namic climate parameter in terms of location, i.e. its value varies greatly in sunny versus shadowy locations and close to vege-tated areas, and time. Measuring air temperature has been im-plemented as a proof-of-concept using the open-source Arduino electronics platform. The Arduino has been equipped with a tem-perature sensor and has been connected through a laptop com-puter to a positioning device. The positioning technique is further discussed in the following paragraph.
An area of several hundreds of meters has been covered with the temperature sensor. The measurements have been stored in the database using the following format:X-coordinate, Y-coordinate, Height, Accuracy of position, Sensor value, Date, Time. No sen-sor standard has been used since the TU Delft is developing its own infrastructure for communication and storage of environ-mental measurements.
Continuous sensor tracking in urban environments Object tracking and therefore sensor tracking is challenging in urban en-vironments. Global Navigation Satellite Systems (GNSS) suf-fer from propagation losses in urban environments. Other tech-nologies have to be used as a replacement or enhancement of the GNSS signals such that tracking in urban areas (in open spaces as well as in densely built environments) is still possible.
For the replacement or enhancement of Global Positioning Sys-tems (GPS), which is nowadays the only GNSS with global cov-erage, the following positioning systems and combinations have been reviewed: Assisted-GPS, High Sensitivity GPS (HSGPS), Global System for Mobile communications (GSM), Ultra-Wideband (UWB) and Wireless Fidelity (Wi-Fi). The chosen combination, based on technique, accuracy and availability, has been a com-bination of HSGPS and Wi-Fi. This comcom-bination provides wide area coverage through GPS positioning (with the HSGPS tech-nology performing better in densely built environments ), as well as coverage of certain HSGPS blind-spots, i.e. locations in which the acquired position is not usable due to lack of signal availabil-ity, through a densely populated Wi-Fi network.
Figure 4: Algorithm for the combination of GPS and Wi-Fi posi-tioning
Points (APs) without any settings’ changes and network distur-bance. Both technologies HSGPS and the Wi-Fi network have been available at the university. The commercial hardware and software packageEkahauhas been used for fingerprinting.
The two positioning systems operate separately from one another. The two outputs have to be combined in order to get a single and continuous position estimate. A basic algorithm has been cre-ated to achieve this which is based on Wayn’s et al. (2009) work. The algorithm picks the most accurate position estimate based on the reported accuracy of the HSGPS and Wi-Fi positioning tech-niques. The accuracy values are based on the HSGPS device ac-curacy, the HSGPS horizontal dilution of precision (HDOP), and theEkahauposition quality measure (see Figure 4). The position estimates are transformed into the Dutch RD-new coordinate sys-tem (Schreutelkamp and van Hees, 2001) prior to storing them, together with the measured sensor value, in the database.
4 DATABASE FUNCTIONALITY
Since 3DCityDB is deployed on top of a spatial database, the available amount and complexity of analyses available depends wholly on the database. In this project, 3DCityDB has been de-ployed on an Oracle 11g instance. All operations and analyses have been performed using SQL. Following is a list of the avail-able database operations and their relation to climate research.
The most simple queries are related to scene statistics e.g. total area of roofs, walls, vegetation, etc., distances between objects, total number of buildings, total number of flat roofs. These statis-tics can be used to calculate large scale metrics of the scene under investigation such as pavement versus vegetation ratio, city ven-tilation coefficient based on the distance between buildings, etc.
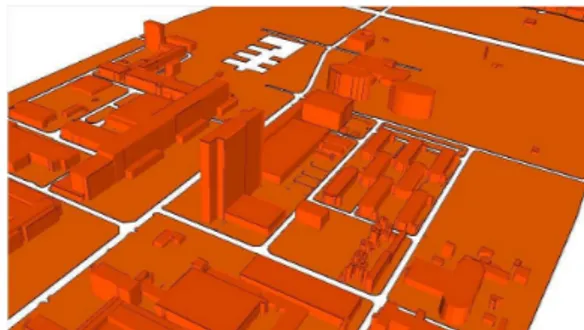
A simple yet powerful function is the removal of certain geome-tries as it allows for the analysis of the effect of an object on its surroundings in terms of wind or heat exchange. Figure 5 displays the campus buildings only, while 6 displays everything except the roads.
Figure 5: TU Delft campus objects. Only the buildings have been selected.
Another simple yet powerful function is the manipulation of sur-face properties. Allowing users to quickly change the type of land cover would allow for the analysis of the effect of a grassy park versus a paved one in terms of heat exchange and wind related metrics, e.g. drag.
Another use case is the investigation of the suitability of a roof to be turned into a green roof. This operation consists of finding all the flat roofs which have an area larger than a certain value.
Data export: the geometry can be exported to different formats. However, the semantic properties can only be transported using CityGML.
Figure 6: TU Delft campus objects. Buildings and terrain have been selected whereas the roads have been removed.
4.1 Mobile Sensing
Even though in several cases, e.g. very close to buildings, Wi-Fi did not manage to solve for the HSGPS blind-spots, in general, the idea of HSGPS and Wi-Fi combination for continuous tioning has been proven realisable. The HSGPS and Wi-Fi posi-tioning combination provided continuous measurement tracking in the TU Delft campus with relatively good results in terms of accuracy. The 95% position error for HSGPS has been 6 meters, being acceptable for urban climate research applications whereas the average Wi-Fi positioning error has been 11 meters with a 90% error of 33 meters, representing a low accuracy for this ap-plication and being a result of the design of the network, mainly for data transfer and not for positioning.
The main issues concerning the positioning technique, have actu-ally been related to device synchronisation. HSGPS, Wi-Fi and the sensor, all had different data polling times, and thus the imple-mented software for device compatibility has often been losing synchronization.
5 CONCLUSIONS
Urban climate research is a an important subset of climate re-search as cities have started to have an ever increasing influence on global climate. Urban climate researchers need climate infor-mation systems which help facilitate their knowledge on acquisi-tion activities. Presently, such informaacquisi-tion systems do not exist or are not specifically designed for climate research.
At the base of any information system lies a data storage mech-anism. This paper discusses the design and implementation of such a storage mechanism in the form of a geospatial relational database made fit for climate research. A mobile sensing plat-form has been implemented to facilitate measurements collection and storage. Temperature measurements have been tracked con-tinuously in the TU Delft campus, with a combination of GPS and Wi-Fi fingerprinting technologies.
The database has been based on CityGML and stores geometrical representations of urban objects such as buildings, trees, land-cover, etc., and measurements made with a mobile measuring platform. CityGML has been deemed fit for climate research as it is able to store semantic and thematic information along with ge-ometry. Climate related queries such as ’select all roofs’, ’select white walls’, ’select all grasslands’, etc. has become possible. Furthermore, CityGML is an expendable model; users can ex-tend it with custom classes so that it fits their needs. However, this extendibility comes at a cost: the extensions are not readable by standard data importers/exporters and viewers and the defined extensions are only accessible through code.
high level-of-detail roofs and facades remains a difficult task. Creating realistic trees is more difficult still. Currently trees are represented by convex hulls. Although this representation allows for some basic analysis, it is far from ideal.
In general, the sensor positioning technique has been proven use-ful. The Wi-Fi position accuracy strongly depends on the spatial distribution and geometry of the access points. Positioning accu-racy is low when the access points are situated in a line. Increas-ing the accuracy requires repositionIncreas-ing of the access points such that they surround the Wi-Fi receiver. However, repositioning of the access points is often not possible.
6 FUTURE WORK
The implemented database does not only store data, it is also capable of performing analyses. Currently however, these anal-yses have to be performed at the database level, using built-in DBMS functions and programming language. An interface is needed which gives easy access to the analysis functionality of the database. This interface needs to be tailored for the needs of different types of climate researchers. An interesting route to investigate is the implementation of a QGIS plug-in.
The majority of geometries currently stored in the database is rather simple: buildings are represented as extrusions, while trees are represented by convex hulls. Detailed geometries allow for more detailed and realistic analyses and simulations. Effort should be made to introduce detailed geometries in the database.
Objects are currently not checked for validity. A 3D object is deemed valid when its faces enclose a volume without gaps and/or overlapping. A geometry validation procedure must be intro-duced prior to storing the geometry in the database.
The database is, at its current state, not constrained. It is therefore possible to input overlapping geometries. A set of database con-straints needs to be developed and implemented which prevent geometry from overlapping.
A stable positioning system has to be established that is able to cover open air locations as well as locations that usually suffer from propagation losses, e.g. near buildings. The HSGPS and Wi-Fi combination could still be used provided that the existing TU Delft Wi-Fi network will have more and highly scattered ac-cess points. New acac-cess points should be located at existing GPS blind spots. Blind spots can be acquired using line-of-sight cal-culations as proposed by Verbree and Zlatanova (2007). It is rec-ommended to test other commercial or open-source software and compare it to the usedEkahausystem.
Using a combination of sensors and positioning technologies in-troduces synchronization problems. The method adopted dur-ing this project did not brdur-ing the expected results as some syn-chronization tasks had to be manually carried out. A survey for available hardware synchronization mechanisms needs to be per-formed.
7 ACKNOWLEDGEMENTS
The content of this paper is part of the Synthesis Project of the 2nd year Geomatics Master students of the TU Delft (GSP, 2010). Therefore, we would like to thank our colleagues for giving us the permission to use their work: B. Altena, M. Koudijs, E. Tsom-panopoulos, M. Valk, A. Vazifehdoust, Y. Wang, H. Wong, D. Xu and Y. Yuan. Furthermore, we would like to thank our su-pervisors, Dr. B. Gorte and Ir. E. Verbree, for their continuous interest and contributions.
REFERENCES
Akbari, H., Pomerantz, M. and Taha, H., 2001. Cool surfaces and shade trees to reduce energy use and improve air quality in urban areas. Solar Energy 70(3), pp. 295–310.
Arnfield, A. J., 2003. Two decades of urban climate research: a review of turbulence, exchanges of energy and water, and the urban heat island. International Journal of Climatology 23(1), pp. 1–26.
Blankenstein, S. and Kuttler, W., 2004. Impact of street geometry on downward longwave radiation and air temperature in an urban environment. Meteorologische Zeitschrift 13, pp. 373–379.
Davies, M., Steadman, P. and Oreszczyn, T., 2008. Strategies for the modification of the urban climate and the consequent im-pact on building energy use. Energy Policy 36(12), pp. 4548 – 4551. Foresight Sustainable Energy Management and the Built Environment Project.
Groger, G., Kolbe, T. H., Czerwinski, A. and Nagel, C., 2008. OpenGIS City Geography Modelling Language (CityGML) En-coding Standard.
GSP, 2010. Measure the climate, model the city.
http://weblog.tudelft.nl/media/blogs/105293/ GSP 2010 final report.pdf. Delft University of Technology, The Netherlands.
Holmgren, J., 2004. Prediction of tree height, basal area and stem volume in forest stands using airborne laser scanning. Scandina-vian Journal of Forest Research 19(6), pp. 543–553.
Kolbe, T. H., Koning, G., Nagel, C. and Stadler, A., 2009. 3D-Geo-Database for CityGML.
Ledoux, H. and Meijers, M., 2009. Extruding building footprints to create topologically consistent 3D city models. Urban and Re-gional Data Management pp. 239–266.
Maltamo, M., 2004. Estimation of timber volume and stem den-sity based on scanning laser altimetry and expected tree size distribution functions. Remote Sensing of Environment 90(3), pp. 319–330.
Maltamo, M., Mustonen, K., Hyyppa, J., Pitkanen, J. and Yu, X., 2004. The accuracy of estimating individual tree variables with airborne laser scanning in a boreal nature reserve. Canadian Journal of Forest Research pp. 1791–1801.
Myneni, R., Hall, F., Sellers, P. and Marshak, A., 2002. The inter-pretation of spectral vegetation indexes. Geoscience and Remote Sensing, IEEE Transactions on 33(2), pp. 481–486.
Oke, T., 2005. Towards better scientific communication in urban climate. Theoretical and Applied Climatology 84, pp. 179–190.
Oke, T. R., 2007. Sitting and Exposure of Meteorological Instru-ments at Urban Sites. In: C. Borrego and A.-L. Norman (eds), Air Pollution Modeling and Its Application XVII, Springer US, pp. 615–631.
Piringer, M., Grimmond, C. S. B., Joffre, S. M., Mestayer, P., Middleton, D. R., Rotach, M. W., Baklanov, A., De Ridder, K., Ferreira, J., Guilloteau, E., Karppinen, A., Martilli, A., Masson, V. and Tombrou, M., 2002. Investigating the Surface Energy Bal-ance in Urban Areas: Recent AdvBal-ances and Future Needs. Water, Air, and Soil Pollution: Focus 2, pp. 1–16.
Schreutelkamp, H. and van Hees, L. S., 2001. Benader-ingsformules voor de transformatie tussen RD- en WGS84-kaartcoordinaten. Stichting De Koepel.
Solecki, W., Rosenzweig, C., Parshall, L., Pope, G., Clark, M., Cox, J. and Wiencke, M., 2005. Mitigation of the heat island effect in urban New Jersey. Environmental Hazards 6, pp. 39–49.
Stewart, I. and Oke, T., 2009. Classifying urban climate field sites by Local Climate Zones: The case of Nagano, Japan. In: The 7th International Conference on Urban Climate, Yokohama, Japan.
Verbree, E. and Zlatanova, S., 2007. Positioning LBS to the third dimension. In: Location based services and telechartography, pp. 107–118.