• Nenhum resultado encontrado

Brazilian equity mutual funds: a general outlook based on performance

N/A
N/A
Protected

Academic year: 2017

Share "Brazilian equity mutual funds: a general outlook based on performance"

Copied!
105
0
0

Texto

(1)

ESCOLA DE ECONOMIA DE SÃO PAULO

ANDRÉ GUERRA PAIVA DE ALMEIDA

BRAZILIAN EQUITY MUTUAL FUNDS

A general outlook based on performance

SÃO PAULO

(2)

BRAZILIAN EQUITY MUTUAL FUNDS

A general outlook based on performance

Dissertação apresentada à Escola de

Economia de São Paulo da Fundação

Getúlio Vargas, como requisito para

obtenção do título de Mestre em Economia.

Campo de conhecimento: Investimentos

Orientador:

Prof.

Dr.

João

Filipe

Bernardes

Volkmann

de

Mendonça

Mergulhão

SÃO PAULO

(3)

Almeida, André Guerra Paiva de.

Brazilian equity mutual funds: A general outlook based on performance / André

Guerra Paiva de Almeida. - 2015.

104 f.

Orientador: João Filipe Volkmann de Mendonça Mergulhão

Dissertação (mestrado) - Escola de Economia de São Paulo.

1. Fundos mútuos de ações. 2. Investimentos - Administração. 3. Capital de risco.

I. Mergulhão, João Filipe Volkmann de Mendonça. II. Dissertação (mestrado) -

Escola de Economia de São Paulo. III. Título.

(4)

BRAZILIAN EQUITY MUTUAL FUNDS

A general outlook based on performance

Dissertação apresentada à Escola de

Economia de São Paulo da Fundação

Getúlio Vargas, como requisito para

obtenção do título de Mestre em Economia.

Campo de conhecimento: Investimentos

Orientador:

Prof.

Dr.

João

Filipe

Bernardes

Volkmann

de

Mendonça

Mergulhão

Data de aprovação:

__/__/____

Banca examinadora:

___________________________

Prof. Dr. João Filipe Bernardes Volkmann

de Mendonça Mergulhão

FGV-EESP

___________________________

Prof. Dr. Ricardo Rochman

FGV-EESP

___________________________

Prof. Dr. Ricardo Buscariolli Pereira

UFABC

SÃO PAULO

(5)

This dissertation required me to put into work all the skills I have learned so far since my

under graduation. That is why it was so demanding. Thus, it required me to ask for help in

countless times. I would like to thank all the people who provided me with support in so many

ways.

I thank my family, who has always supported me in my education and life goals.

To Marina, for her patience, support and love throughout the course. I do not think I would

ever have made it without her.

To my dearest friends, who believed in me since we met and had patience when I could not

hang out. I am sorry for the absence.

To my classmates, who I grew up with, learned, studied and struggled during the classes,

exams and exercise lists, but always with courage and great sense of humor.

To Prof. Dr. João Filipe Bernardes Volkmann de Mendonça Mergulhão, for the patience and

the advice of having

“curiosity

for the data”.

To my workmates, who gave me courage and strength to carry on. Thank you for the

learnings and challenges that we face every day and for the opportunity to do something I

love.

(6)

O principal objetivo desta dissertação é analisar os retornos dos fundos brasileiros de ações.

Concluímos que gestão ativa não é efetiva para o índice Ibovespa, uma vez que fundos

ativos não superam a performance dos fundos referenciados em Ibovespa. Porém, para o

índice IBrX, gestão ativa supera a estratégia passiva. Observamos que fundos de

Sustentabilidade não superam o mercado, e que fundos de pensão mostram uma

performance ruim, o que poderia indicar uma forte imposição regulatória sobre os portfolios

destes tipos de fundos. O tamanho de um fundo mostra correlação positiva com as medias

dos retornos e com os alphas. O tempo de vida de um fundo é positivamente correlacionado

com retornos e alphas, o que poderia estar relacionado com uma maior tomada de risco por

parte de gestores mais novos na busca de maiores retornos esperados e de,

consequentemente, maiores entradas de recursos. Fundos mais novos tendem a ter

performance menor provavelmente porque, ao tomar mais risco, eles não performam como

o esperado. Ainda, observamos que a tendência decrescente da evolução do alpha ao longo

do tempo é um sinal dos retornos de escala decrescentes da indústria de fundos, o que

implica que os gestores têm maiores dificuldades de superar o mercado. Ranqueamentos de

Top 10 mostram que os fundos aparecem mais de uma vez nos Top 10, o que mostra

persistência nos na performance dos fundos. Finalmente, em relação aos ranqueamentos

por decis, a frequência de aparições muda entre as medidas de performance. Há medidas

que, quando comparadas com outra, fortemente mudam os membros dos maiores e

menores decis e quartis.

(7)

This dissertation main goal is to overview the Brazilian equity mutual funds returns. We find

that active management is not effective for Ibovespa index, since Ibovespa active funds do

not outperform the Ibovespa referenced funds. However, for IBrX index, active management

do outperform the passive strategy. We found that Sustainable funds returns do not

outperform the market, Endowment funds show poor performance, which could indicate

strong regulation imposition over endowment funds portfolios. The size of a fund shows

positive correlation to mean average returns and alphas. A fund’s lifetime is positively

correlated to returns and to alphas, which could be related to more risk-taking by younger

managers in order to pursue higher expected returns and, consequently, bigger inflows.

Younger funds tend to have lower performance probably because, in taking more risks, they

do not perform as expected. In addition, we find that the decreasing trend of the alpha

evolution along the time is a sign of the industry decreasing returns of scale, which entails

that managers have more difficulties to beat the market portfolio. Top 10s rankings show that

funds appear more than once on the top 10s, which shows persistence of

funds’

performance. Finally, concerning the deciles and quartiles rankings, the frequency of

appearances changes among performance measures. There are measures which, when

compared to others, strongly change the top and bottom for the decile and quartile members.

(8)

1 INTRODUCTION

...8

2 INVESTMENT MUTUAL FUNDS THEORETICAL FUNDAMENTALS

... 12

2.1 Mutual funds behavior and performance

... 12

2.2 Performance measures

... 14

3 METHODOLOGY AND ANALYSIS

... 18

3.1 Source, data selection and extraction

... 18

3.2 Sampling

... 19

3.3 Performance measures selected

... 21

3.4 Exploratory data analysis

... 23

3.5 Groups analysis

... 26

3.5.1 Class groups analysis

... 27

3.5.2 NAV size groups analysis

... 29

3.5.3 Lifetime groups analysis

... 31

3.6 Performance analysis

... 32

3.7 Performance rankings by equity mutual fund

... 35

4 CONCLUSION

... 43

REFERENCES

... 45

APPENDIX A: FUNDS ANALYSIS

... 52

APPENDIX B: ANBIMA CLASSIFICATION

... 54

APPENDIX C: SIZE

... 64

APPENDIX D: LIFETIME

... 73

APPENDIX E: PERFORMANCE

... 80

APPENDIX F: PERFORMANCE RANKINGS FOR ALL FUNDS

... 92

(9)

1 INTRODUCTION

An administrator, a manager, a custodian, a controller and an auditor conduct an investment

fund operation. Each one of those acts in order to ensure the performance and the legal

compatibility of its operations, charges, information, etc. The administrator is the one who

ensures and controls the asset and the issuer concentration limits, the fee charges, the

distribution, the information disclosure, the tax and all other related paperwork concerning

regulators, government, shareholders and other stakeholders. The manager is the one who

takes care of the asset allocation, selecting the best opportunities for the fund, buying, selling

and prospecting strategies and seeking the best returns possible for the shareholders. In

other words, he is the one who structures the

fund’s

portfolio.

The custodian is the one who registers, keeps and provides the assets data for the proper

fund functioning. Those data may be buying date, quantity, buying price, market price,

maturity, asset class, issuer, and many others. The controller guarantees the fund

accountancy, receivables and payables, and, finally, the auditor ensures a third-party opinion

about the financial statements and all the other regulatory aspects of the fund. Each one of

those agents charges a fee, which in turn is a fraction of the fund´s net asset value.

The net asset value (NAV) under management by mutual funds in Brazil is around R$ 2.4

trillion by the end of 2013. Brazil is one of the biggest investment fund industry in the world

because of its rapid growth, development and safety. Some challenges that this industry

faces in the country are

the lack of tax isonomy, the investor’s education, internationalization

and funds as a saving method for families (ANBIMA, 2014).

The

Comissão de Valores Mobiliários

(CVM), the Brazilian regulator for investment funds,

institutes seven different types of mutual funds. The short-term fund is the one whose

portfolio has an average maturity of 252 days. The fixed income fund needs at least 80% of

its NAV invested in fixed income securities. The referenced fund is a fixed income fund that

demands an exposure of, at least, 95% of the portfolio in a fixed-income index, such as the

certificado de depósito bancário

(CDI) rate, or the Brazilian basic interest rate, SELIC,

among others. The equity fund invests at least 2/3 of its NAV in equity type securities. The

currency fund is the one that demands at least 95% in currency exposure. External debt fund

invests in public external debt bonds. Finally, the multimarket fund invests any proportion of

its NAV in different kinds of assets, entailing different kinds of risk exposure. Those

(10)

investors are looking for (table 1). In this sense, for example, CVM does not allow a fixed

income to buy stocks or to expose in currency volatility (CVM, 2004).

It will change, though. CVM will launch a new regulation that will reorganize the fund

classification to only four main classes: equity, fixed income, multimarket and currency

classes. However, it will be allowed for sub-classes. Fixed income will have four sub-classes:

short-term, external debt, referenced (prior, classes by themselves) and simple. Equity will

have two, the BDR Level 1 and the Access Market. BDR Level 1 already exists and intends

to allow the equity funds to invest more than 10% in BDR Level 1, securities that represent

stocks of foreign companies that attend to only some requirements of regulation in order to

have their shares negotiated in Brazilian markets. Because they attend to only some

requirements, BDR Level 1 is a foreign asset (CVM, 2004, 2014).

The

Associação Brasileira das Entidades dos Mercados Financeiro e de Capitais

(

Anbima

),

is a self-regulatory organization constituted to represent the Brazilian market agents, aiming

to strengthen the represented segments, support the evolution of a capital market able to

finance the economic and social growth and influence the global market (ANBIMA, 2015).

Funds are obligated to disclosure its operations to

Anbima

and to fit its classifications as well.

These classifications regard the fund investment objective, in a way that the fund will not use

a different strategy from what it meant to use. For example,

Anbima

watches closely if an

equity fund that intends to pursue a passive strategy in a specific stock index is leveraging in

order to get bigger returns than the index or if it is buying stocks that do not belong to the

index.

The

Anbima

’s classification breaks down in two main levels: the first one is the

Anbima

Category, which is similar to

CVM’s classification, and the second one in the

Anbima

Type,

which identifies the fund main strategy. Therefore, a fund can be a Multimarket category and

a Multimanager type, implying that it must have a CVM category of Multimarket and has as

its objective to compound a portfolio made of shares from other managers funds (table 2).

CVM classification

Brief characteristics

Short-term

Portfolio's average maturity is 252 days

Fixed Income

80% of NAV in fixed income securities

Referenced

95% of NAV in a index

Equity

2/3 in equity type securities

Currency

95% of NAV in a currency exposition

External debt

Allocation in external Brazilian debt

Multimarket

Different types of risk expositions

TABLE 1: CVM classifications and characteristics

(11)

Anbima

’s classification will change. It will have three levels, and suc

h third level aims to

disclose even more the strategy adopted by the funds. This new classification, however,

reduces the number of categories. It also reflects the new classifications proposed by the

new CVM regulation.

There are also funds that follow through specific strategies, and therefore are regulated by

specific instructions.

Fundos de investimento imobiliário

(FII) are proxies to the real estate

investment trust (REIT), or a kind of fund whose only objective is to achieve returns through

real estate investments (CVM, 2008).

Fundos de investimento em direitos creditórios

(FIDC)

are credit specific funds, whose objective is to invest in structured credit operations, similarly,

but not restricted, to debt funds, being able to hold receivables and other kinds of

asset-backed securities (id., 2001).

Fundos de investimento em participações

(FIP) are the private

equity funds, which are able to act through seed money, venture capital or even leveraged

buyout strategies (ibid, 2003). Despite this flexibility, the Brazilian regulation predicts that an

FIP is destined exclusively to seed money operations, which are the

fundos de investimento

em empresas emergentes

(FIEE) (ibid., 1994). Finally, there are

fundos de índice

, or the

ANBIMA Cathegory

ANBIMA Type

Risks

Short-Term

Short-Term

DI/SELIC

Referenced

Referenced DI

DI/SELIC + Credit

Fixed Income

Domestic Interest Rates + Credit + Domestic Price Rates + Leverage

Fixed Income Free Credit

Domestic Interest Rates + Credit + Domestic Price Rates + Leverage

Fixed Income Indexes

Domestic Interest Rates + Credit + Domestic Price Rates + Leverage

Long And Short - Neutral

Long And Short - Directional

Multimarket Macro

Multimarket Trading

Multimarket Multistrategy

Multimarket Multimanager

Multimarket Interest And Currencies

Multimarket Specific Strategy

Balanced

Protected Capital

Global Investment

Global Investment

External Debt Bonds and Currencies

Stock IBOVESPA Indexed

Reference Index

Stock IBOVESPA Active

Reference Index + Leverage

Stock IBr-X Indexed

Reference Index

Stock IBr-X Active

Reference Index + Leverage

Sectorial Equities

FMP-FGTS Equities

Small Caps

Dividend Yields

Sustainability/Governance Equities

Free Stock

Equity + Leverage

Stock Closed-End

Equity

Currencies

Currencies

Currencies

TABLE 2: Anbima cathegories, types and risks

SOURCE: ANBIMA, 2013

Stocks

Equity

Fixed Income

Multimarket

Equity + Leverage

Asset Classes + Leverage

(12)

Brazilian ETFs, which almost totally represents equity-indexed funds, notably

papéis Índice

Brasil Bovespa

(PIBB) and the Ibovespa itself (ibid. 2002).

(13)

2 INVESTMENT MUTUAL FUNDS THEORETICAL FUNDAMENTALS

2.1 Mutual funds behavior and performance

On this section and on the next, we present the literature used for this dissertation.

Chevalier and Ellison (1997) observed that managers do change their portfolios in order to

avoid outflow of funds. The authors developed a model that predicts a fund’s inflow

as a

function of its excess returns. If a manager performs poorly, he will seek more riskiness in

order to try to perform better than the market at the end of the current year and, thus, receive

more inflows. They also found that younger managers would try to avoid unsystematic risk,

since they are more sensitive to termination-performance relationship (Id., 1998). Hu et al

(2011) show how the relation between risk choices and prior performance link to

compensation structure and concerns about employment and career. Berk and Binsbergen

(2015) found a relationship between the manager’s current compensation and his future

performance

The manager’s ability depends on what strategy he focuses

, and the strategy he chooses

depends on the economic momentum. During economic booms, stock picking strategies are

more frequent, while market-timing strategies are used more often during recessions

(KACPERCZYK et al, 2014). Pollet and Wilson (2008) found that funds diversify more in

response to growth and that diversification relates to better performance. In addition, they

found evidence that the fund family can influence a fund’s portfolio strategy.

Pástor, Stambaugh and Taylor (2015) show that literature has advanced in two hypotheses

regarding returns to scale. The first one concerns the fund level decreasing returns of scale.

Berk and Green (2004) show that active managers do not outperform passive benchmarks

because of competition and decreasing returns to scale. They also show that there is a lack

of persistence on returns, but that past performance strongly explains the flow of funds.

Diseconomies of scale (CHEN et al, 2004), transaction costs, active trading strategies

(CHAN et al, 2009) and portfolio illiquidity (YAN, 2008) are considered to be some of the

factors for a negative relation between size and returns. Reuter and Zitzewitz (2010),

(14)

industry increases in size, the managers skills to outperform it decreases (PÁSTOR;

STAMBAUGH, 2010).

The relation between returns and lifetime has divergent conclusions. There is evidence for

decreasing returns during a hedge fund’s existence: the more a hedge fund survives, the

less it performs (JONES, 2007; FRUMKIN; VANDEGRIFT, 2009; AGGARWAL; JORION,

2010). Gregoriou (2002), however, found evidence that long-lived hedge funds do have

higher returns. This positive relation is also found in Brazilian mutual equity funds (BESSA;

FUNCHAL, 2012).

Grinblatt and Titman (1992) find evidence that the differences in performance among funds

persist and that those are consistent with the ability of managers to earn abnormal returns.

Carhart (1997) also finds persistence, but he related it to common factors in stock returns

and investment expenses.

Eling and Schuhmacher (2007) found that different performance measures do not change

rankings of funds. Despite the fact that their work focused in hedge funds, Eling (2008) found

unchanging rankings for different measures for other types of funds. There are others,

however, who show different results. Zakamouline (2010) argued that the selection of

measures does matter for hedge funds performance rankings, while Ornelas et al (2012)

defended that it also matters for US fixed-income, equity and asset allocation mutual funds.

Wermers (2000), Rochman and Eid Jr. (2006) and Castro and Minardi (2009) found that

active managed funds in the Brazilian market outperform the passive ones. In contrast,

Kacperczyk, Sialm and Zheng (2005), Glode (2011) and Casaccia et al (2011) do not find

evidence of superior performance compared to a market benchmark.

Sustainable funds also appear in literature. Pinto, Lemme and Leal (2014) argued that

sustainability equity funds in Brazil perform better than a market portfolio, while Gil-Bazo,

Ruiz-Verdú and Santos (2010) found that this outperformance comes from funds which

managers are specialized in this segment.

Brazilian endowment funds, which receive inflows from the

Entidades Abertas de

Previdência Complementar

(EAPC), have a poor performance because, according to Baima

(1998), this kind of fund must follow a strong legislation regarding portfolio allocation.

(15)

2.2 Performance measures

The Sharpe ratio measures the trade-off between return and risk. It represents how much

excess return an investment has, compared to the risk-free investment, per unit of risk.

Assuming that

S

𝑖

is the Sharpe ratio for the investment i,

𝑖

is the investment i returns,

𝑓

is

the risk-free rate and

𝜎𝑖

is the standard deviation of the investment i, we define Sharpe ratio

as:

𝑖

= (

𝑖

𝑓)/𝜎𝑖

( 1 )

If an investment or security has a low Sharpe ratio, it means that its excess return is too low

to compensate its level of risk. Similarly, the one with a high Sharpe has its return highly

compensating its risk (SHARPE, 1966).

As exposed before, the Jensen

’s Alpha is the difference between the expected return,

calculated by the CAPM, and the actual returns. For mutual funds, its mean is around zero

(JENSEN, 1968). Assuming

as the Jensen’s alpha

for the investment i,

𝛽

𝑖

as the beta of

the investment i to the market portfolio M and as the market portfolio returns, we express

the equation as:

𝑖

= r

i

− [r

f

+

i

r

M

− r

f

]

( 2 )

The information ratio is the reason between the arithmetic average of excess returns from a

reference benchmark and the standard deviation of such excesses, most known as the

Tracking Error index. It goes far beyond the Sharpe ration since it uses a reference index for

measuring a security return performance, instead of considering the risk-free rate as a

benchmark. The information ratio for the investment i, which is defined as

𝐼

𝑖

, follows as:

I𝑖

=

TE

Δ

( 3 )

Supposing that the difference between the investment i and the benchmark return is

(16)

then the term

Δ

𝑖

is the arithmetic average of excess returns of the investment i, the

information ratio would be expressed as:

Δ𝑖

=

1

∑ Δ𝑡

𝑇

𝑡=

( 4 )

The term

𝑖

refers to the Tracking Error of the investment i, or the standard deviation of the

excess returns:

𝑖

= √

1

∑ Δ

𝑡

− Δ ²

𝑇

𝑡=

= 𝜎

Δ

( 5 )

This index measures returns relatively to a risk that could be diversified away. Then, an

active manager could add value simply by allocating more or less in individual securities

relative to the benchmark index. The bigger the index, then better the performance of an

asset or fund relative to its benchmark (GOODWIN, 1998).

A set of performance measures accounts for the market and the assets volatilities. The M² or

MM

measure equals the assets volatilities to the market’s, and adjust their returns by the

new level. Then, this adjusted return is compared to the market return (MODIGLIANI;

MODIGLIANI, 1997). Assuming that

²𝑖

is the measure of the investment i, and that

𝜎

is

the market standard deviation, we represent M² as:

𝑖

=

𝜎

𝜎

𝑖

(

𝑖

𝑓

) −

𝑓

( 6 )

(17)

Sortino, Omega and Upside Potential measures intend to separate the upside volatility, or

“good volatility”, and the downside volatility, or “bad volatility”. It i

s useful to specify a

threshold, a minimum acceptable return (MAR), in order to define a minimum loss.

The Sortino ratio is a variant of the Sharpe ratio. It compensates the main flaw of the prior,

which is the non-accounting of the higher and lower volatility moments. Sortino does so by

establishing the MAR level and dividing the difference between the actual return and the

MAR by the standard deviations of the downside returns (SORTINO; VAN DER MEER;

PLATINGA, 1999

1

, apud DARBYSHIRE; HAMPTON, 2014). Considering that

𝑖,𝑡

is the return

for the investment i in the period t and that

T

is the last period observation, the next equation

represents Sortino ratio for the investment i:

𝑖

𝑖

=

𝑖

− 𝐴

1 ∑

𝑇

𝑡=

𝑖,𝑡

− 𝐴

𝑟

𝑖

<

𝑅

( 7 )

The Omega ratio incorporates the full distribution of returns for determining the return of a

security against a threshold level and, consequently, incorporating all the first four moments.

It also inherently describes the risk-reward properties of the return distribution. The ratio was

intended to be an answer to two main over-simplifications given to performance measures:

1

SORTINO, F., VAN DER MEER, R., PLANTINGA, A. The Dutch triangle: a framework to measure upside potential

relative to downside risk. Journal of portfolio management, p. 50-58, 1999.

GH2

FIGURE1: M² and GH2 curvature comparison

(18)

the first is that mean and variance fully describe the distribution of returns; the second,

risk-reward characteristics of a portfolio may be described without reference to any return level

aside the mean return (KEATING; SHADWICK, 2002).

Ω𝑖

=

∫ (1 − 𝑥 ) 𝑥

𝑥 𝑥

( 8 )

We suppose that is the upside limit, the downside limite and the loss threshold for a

given investment return distribution, defined by a cumulative distribution function (CDF)

𝑥

.

The Omega ratio for the investment i, thus, reflects that the higher its value, the better for an

investor, in a way already adjusted for all the statistical moments of the respective

distribution (id., 2002).

The Upside Potential metric would be a hybrid metric, incorporating as the numerator the

Omega ratio numerator and as denominator the Sortino ratio denominator. It would be:

𝑖

𝑖

=

∫ (1 − 𝑥 ) 𝑥

1 ∑

𝑇

𝑡=

𝑖,𝑡

− 𝐴

𝑟

𝑖

<

𝑅

( 9 )

Since the numerator could be interpreted as the potential of success, this hybrid metric

should be called as the Upside Potential ratio (SORTINO; VAN DER MEER; PLANTINGA,

1999

2

, apud DARBYSHIRE; HAMPTON, 2014).

(19)

3 METHODOLOGY AND ANALYSIS

3.1 Source, data selection and extraction

We extracted weekly share prices and weekly NAV from 2.684 Brazilian equity mutual funds,

between Jan/2000 and Oct/2014, resulting in 774 weeks of prices and NAV, or 773 weeks of

returns. Among the extracted funds, there are funds still operating and funds already closed

from several

Anbima

equity classifications. In addition, there are funds that, although stated

in the base as active, have no present information or present partial data only. The

datasource is Economatica.

We disregarded funds of funds, since these have the objective to invest in other funds, thus

adding anything to the work. In addition, we disregarded equity funds from the

Anbima

class

Dividends. Since equity funds pay their stocks dividends to investors, their NAV amortizes

periodically, thus affecting their price and return. It is difficult to treat this effect for each fund.

Since Dividend class funds aim to invest in dividend payer stocks, we disregarded them from

the sample.

The risk-free rate used was the CDI. This is considered to be the main Brazilian risk-free rate

and it is calculated by the Brazilian interbankary transactions. The market portfolio

considered was Ibovespa. The most traded stocks on the Brazilian exchange form this

market index. Its composition changes on each four months.

The equation that defines weekly returns for the i

th

fund, for the t

th

week, is as follows:

𝑖,𝑡

= log

𝑃

𝑃

𝑖,𝑡

𝑖,𝑡−

( 10 )

hence resulting in continuously compound returns series. We use the prices series since

they are already adjusted to cash inflows and outflows from the fund’s NAV, which

provides a

more coherent return series. Such flows would distort a return based on NAV variation

without adjustment. Prices are adjusted for administration fees.

(20)

last returns observations as empty observations. The annualized returns are approximated

multiplying the weekly returns by 52.

3.2 Sampling

In order to avoid possible survivorship bias, cancelled funds prices were included in the

sample. If we consider only active funds, this would result in higher return rates because

survival funds could be those with a higher performance in comparison to those funds shut

down due to low performance, resulting in higher mean averages, biasing the variances and,

consequently, leading to incorrect statistical conclusions. Some of such biased conclusions

would be that past returns influence future ones, affecting persistence measures (BROWN;

GOETZMANN; IBBOTSON; ROSS, 1992). According to Carhart et al (2002), “since the

imposition of a minimum survival period is often unavoidable, an important issue is how the

resulting bias varies with the nature of the survival rule in the popul

ation”.

However, considering all funds from the database increases the occurrence of missing data

and misrecordings. Active funds with no information available at all or with partial information

would add noise to the results. We consider some degree of survivorship bias. In fact, in the

data used, there are funds canceled just before the start of the sample.

Data treatment included three main exclusion filters: 1- ) A price basis filter; 2- ) returns

based filter; and 3-

) a ‘survivor’ approach filter (

table 4). The price basis filter removed funds

with zero or negative prices, since they would add no useful information to the survey. There

are nine funds with zero prices. Negative funds represent funds that lost their NAV in a point

that they needed to gather more resources from their investors, thus leveraged funds. They

could be included in to the study, but we identified only one fund, thus removed.

(21)

We also disregarded funds with null returns. It is a different situation than that of funds with

null prices, which we removed before. This, actually, implies the fact that there are funds with

prices available in periods other than weekly, but monthly, yearly or in other frequency.

Those cases, which are 37 funds, were removed since, in a weekly basis returns, they would

not add to the study.

Our survival filter is based on time length and size as in Kosowski et al (2006), Fama and

French (2010), Yoshinaga et al (2009), and Barras et al (2010). We removed funds with

average NAV inferior to R$ 1 million and with less than 52 available prices. Such filters lead

to the elimination of 570 funds, 514 from the funds with less than 52 prices and 37 from the

funds with less than R$ 1 million average NAV.

From the raw data of 2.684 funds, we consider 1.945 as the total funds and 1.394 as the

filtered, or ‘survivor’, funds. Thus, this work compares both sets of data, the total and the

filtered data (table 3).

Filters approach

Filters used

Criteria

Funds

removed

2.684

Null prices

Funds with no prices

9

Negative prices

Any price lower than 0

1

Nan returns

Funds with no weekly returns

37

Maximum returns

Funds which maximum weekly

returns is higher than 20%

176

Minimum returns

Funds which minimum weekly

returns is lower than 20%

516

739

1.945

Less than 52 prices

Funds with less than 52 prices

514

Less than average R$ 1

MM

Funds with average NAV lower

than R$ 1 million

37

551

1.394

TABLE 3: Summary of used filters

Funds removed in the survival analysis

Filtered funds

Third filter: 'survivor'

based

Second filter: return

based

Initial sample funds

First filter: price based

(22)

3.3 Performance measures selected

Performance metrics used were Jensen’s Alpha, Sharpe Ratio, Information Ratio, GH1,

GH2, MM, Sortino Ratio, Omega Ratio and Upside Potential. We computed these measures

for each year, considering weekly observations. As mentioned before, the risk-free rate used

is the CDI. The parameter used for the Minimum Acceptance Return for the Sortino, Omega

and Upside calculation was the mean average of the risk-free CDI, considering weekly

observations during each year.

Ibovespa is a volatile benchmark, as it reflects not only the environment of an emerging

economy but also because the sample includes the recent financial crisis. Nevertheless, the

usual negative skewness and high kurtosis are present.

Table 4 shows the descriptive statistics for benchmarks and figure 2 shows their histograms

and evolutions.

Descriptive

statistics

Mean

Variance

Standard

deviation

Maximum

(weekly)

Minimum

(weekly)

Kurtosis

Skewness

CDI

13,09%

0,00%

0,56%

0,45%

0,13%

133,79

24,32

Ibovespa

8,13%

8,07%

28,41%

16,84%

-22,33%

327,61

-28,87

TABLE 4: Annualized weekly benchmarks summaries

(23)

In order to run them, the performances accounts for a year time horizon using the weekly

returns. Therefore, all funds will have a result for each measure per year. This makes sense

since benchmarks used change over the years, so it is not reasonable calculate those

metrics for the entire period at once, but rather calculate year by year.

We made two adjustments in order to present the results. First, we discounted the

benchmark Ibovespa and the risk-free CDI by the mean average of the administration fees

charged by funds’ managers and administrators. This is an important adjustment since the

funds’ prices are already charged, thus implying in lower results if compared to the

benchmark and to the risk-free. Thus, this charge makes the results fairer. We took the last

available annual management fee for each fund, calculated the corresponding weekly rate by

compound capitalization and considering 52 weeks per year. Then, we took the mean

average of the exist

ing funds’ fees by week and discounted this mean rate by the absolute

return of the risk-free rate and the Ibovespa. We used the last data available (as of 2014)

since Economatica does not bring a complete series for administration fees.

Second, we also removed Sortino, Omega and Upside Potential higher than five. Such

results would significantly affect the analysis and mean averages, making the analysis

(24)

senseless challenging. Since those metrics are divisions, as shown before, if a fund has a

too low denominator and a big numerator it can have an extremely high number.

3.4 Exploratory data analysis

We present descriptive statistics for the funds annualized weekly returns, NAV and quantity

in table 6. Funds returns are around 1.8% annualized weekly, with an annualized weekly

standard deviation close to 18%. The average lifetime of a fund is close to 146 weeks, or

close to 3 years. Total funds considered as of the last available date (October 2014) sum

to993 funds, computing for a total NAV of R$ 101.7billion.

Results from the ‘survivor’ filters change their characteristics. Their annualized

weekly

returns rise to 4%. Their average lifetime in weeks also increases to 191 weeks, or next to 4

years. The outstanding number of funds as of October 2014 is 836 and their total NAV is R$

91.4 billion.

Kurtosis suggests that both groups present some degree of leptokurtosis, indicating that

there is a great concentration of returns in the tails. The data tends to be more concentrated

in the filtered funds than the total. Finally, both skewness are negative, which indicates that

both set of funds have concentrations to higher returns than the average (table 5). Figure 3

better shows the distribution of annualized weekly returns for all and for filtered funds.

Descriptive

statistics

Mean

Variance

Standard

deviation

Maximum

(weekly)

Minimum

(weekly)

Kurtosis Skewness

Av. lifetime

(weeks)

Qty of

funds

Qty of funds

(Oct. 2014)

NAV (R$ MM)

(Oct. 2014)

All funds

1,83%

4,23%

18,68%

19,96%

-20,00%

4,95

-0,31

146,35

1.945

993

101.733

Filtered

funds

4,19%

4,07%

18,73%

19,96%

-20,00%

5,56

-0,36

191,29

1.394

836

91.476

(25)

The distribution of the NAV in logarithmic form shows dispersion around the mean average

with a higher peak around funds with NAV of size R$ 300 billion (figure 4). Lifetime for funds

shows higher concentrations for younger funds, with peaks in funds whose lifetime is around

240 weeks and 650 weeks (figure 5).

FIGURE3: Histograms of annualized weekly returns for all and filtered funds

(26)

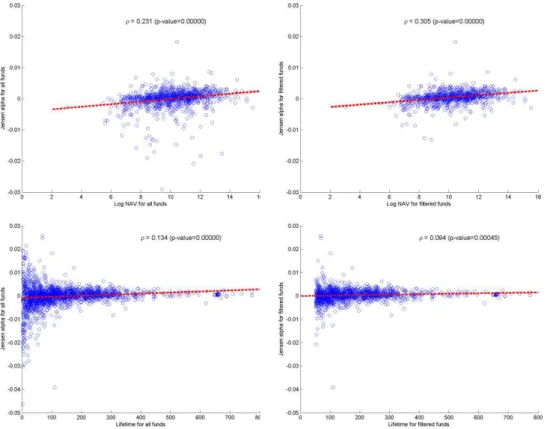
It is possible to see some correlations, especially between returns and NAV and between

returns and lifetime. We see that the size of the fund has a relation to the fund mean returns,

with a correlation of 23% for a p-value next to zero. Filtered funds enhance this correlation, to

31%, also for a p-value next to zero (figure 6). This correlation may be interpreted as

evidence of economies of scale, by which bigger funds can make better deals by lower costs

than smaller funds, as found by Latzko (1999), Dowen and Mann (2004), and Pollet and

Wilson (2008) (figure 6).

In addition, it is notable that the lifetime of the fund converges the returns to a mean point:

older funds tend to have similar returns than the youngest. This could point to a

specialization of the market, through which younger funds can have all sort of possible

positive or negative outcomes, while older ones, funds with a considerable long-term period

in the market, already know how to deal with the market and keep its return tracking. In

addition, after some time, returns seem to increase as time goes by. ‘Survival’ filters

eliminate riskier and younger funds. The correlation between annualized returns and lifetime

FIGURE5: Histograms of lifetime for all and filtered funds

(27)

is 19% for all funds and 28% for filtered funds (figure 7). This supports Gregoriou (2002) and

Bessa and Funchal (2012) findings, that older funds achieve higher returns.

3.5 Groups analysis

We separated and analyzed the funds in three main divisions. The first division concerns the

funds

Anbima

classification, following table 5. In this division, there are eleven groups of

equity funds: FMP-FGTS, Ibovespa Active, Ibovespa referenced, IBrX Active, IBrX

referenced, equities free, sectorial, small caps, sustainability, closed-end and endowment.

Dividends, as mentioned before, are disregarded.

The second division regards the funds average NAV size through the entire sample period.

The first group includes funds bigger than R$ 200 million. The second, funds between R$

200 and R$ 100 million. The third, between R$ 100 and R$ 50 million. The fourth, between

R$ 50 million and R$ 25 million. The fifth, between R$ 25 and R$ 10 million. The sixth,

between R$ 10 and R$ 5 million. The seventh, between RR$ 5 and 1 million. The eighth and

the last, lower than R$ 1 million.

The third cut is about the funds lifetime. There are funds older than 8 years old. The second

group, funds between 8 and 5 years old. The third, between 5 and 4 years old. The fourth,

between 4 and 3 years old. The fifth, between 3 and 2 years old. The sixth, between 2 and

1.5 years old. The seventh, between 1.5 and 1 year old. The eighth, funds younger than 1

(28)

year. Due to the ‘survivor’ filters, the last groups of the size and the lifetime divisions do not

exist when the analysis concerns the filtered funds.

3.5.1 Class groups analysis

Table 6 shows the

Anbima

classification for all equity funds. We observe three points in

analyzing the breakdown. First, FMP-FGTS funds were developed to receive FGTS

resources, the public endowment system. This type of equity mutual fund started in the

beginning of the 2000s. In our sample, all FGTS-FMP funds started after that, and few of

them have shut down. Investors can take their money back any time they want from these

funds, but they cannot invest more. This type of fund shows the biggest returns because it

followed a bullish period of the Brazilian stock market.

Second, we see no conclusion regarding what portfolio strategy is best: active of passive.

Ibovespa Referenced shows better returns than Ibovespa Active, which means that a

passive strategy indexed in Ibovespa is better. On the other hand, IBrX Active shows better

returns than IBrX Referenced, which would be evidence of a better performance for active

strategy on IBrX.

(29)

After the ‘survival’ filters, Sectorial, Small Caps and Sustainability funds perform better, with

positive returns. The same points for other classes, however, keep the same (table 7).

All funds

Mean

Variance

Standard

deviation

Maximum

(weekly)

Minimum

(weekly)

Kurtosis Skewness

Av. lifetime

(weeks)

Qty of

funds

Qty of funds

(Oct. 2014)

NAV (R$ MM)

(Oct. 2014)

FMP-FGTS

11,72%

11,10%

33,01%

18,84%

-17,12%

5,04

-0,05

598,80

44

42

2.142

Ibovespa

Active

0,32%

4,20%

18,70%

19,48%

-19,99%

5,77

-0,35

134,77

484

180

9.703

Ibovespa

Referenced

3,55%

4,67%

20,51%

19,35%

-15,02%

3,76

-0,02

116,20

30

12

660

IBrX Active

3,92%

3,64%

18,17%

19,96%

-20,00%

4,22

-0,40

144,20

173

90

9.742

IBrX

Referenced

1,27%

4,00%

18,14%

13,80%

-19,85%

3,68

-0,40

114,47

17

11

682

Equities Free

2,29%

3,79%

17,61%

19,67%

-19,93%

4,67

-0,29

126,39

1.029

534

52.872

Sectorial

-1,22%

8,44%

27,21%

18,83%

-19,96%

4,92

-0,07

237,82

77

49

9.522

Small Caps

-0,83%

3,69%

17,08%

12,90%

-18,61%

4,71

-0,44

134,33

40

29

1.036

Sustainability

-3,04%

3,06%

17,04%

16,59%

-19,50%

4,25

-0,31

205,25

12

10

844

Closed-End

-2,15%

2,17%

13,37%

10,72%

-19,00%

14,06

-1,30

154,08

12

10

10.770

Endowment

-3,21%

3,73%

18,75%

15,21%

-18,77%

4,02

-0,23

172,00

27

26

3.760

TABLE 6: Descriptive statistics for all funds by Anbima strategy

Filtered

funds

Mean

Variance

Standard

deviation

Maximum

(weekly)

Minimum

(weekly)

Kurtosis Skewness

Av. lifetime

(weeks)

Qty of

funds

Qty of funds

(Oct. 2014)

NAV (R$ MM)

(Oct. 2014)

FMP-FGTS

12,95%

11,11%

33,00%

18,84%

-17,12%

5,11

-0,08

626,50

42

40

2.140

Ibovespa

Active

2,81%

3,86%

18,37%

19,41%

-19,99%

6,68

-0,43

175,25

341

155

8.529

Ibovespa

Referenced

4,17%

4,49%

20,74%

19,35%

-15,02%

4,09

-0,03

147,41

22

10

504

IBrX Active

4,81%

3,85%

18,92%

19,96%

-20,00%

4,47

-0,39

182,85

129

71

5.712

IBrX

Referenced

1,03%

4,11%

18,20%

13,80%

-19,85%

3,77

-0,46

125,07

15

10

648

Equities Free

4,61%

3,54%

17,45%

19,67%

-19,93%

5,34

-0,34

168,59

716

443

48.213

Sectorial

4,93%

8,59%

28,26%

18,83%

-19,96%

4,65

-0,11

320,45

55

41

9.441

Small Caps

0,99%

2,65%

16,11%

12,90%

-18,61%

5,04

-0,49

163,23

30

25

949

Sustainability

3,56%

3,01%

16,87%

16,59%

-19,50%

4,44

-0,29

223,36

11

10

844

Closed-End

-1,25%

2,47%

14,85%

10,72%

-19,00%

16,38

-1,63

180,50

10

9

10.770

Endowment

-0,35%

3,55%

18,38%

15,21%

-18,77%

4,17

-0,22

190,65

23

22

3.725

(30)

The fact that Ibovespa referenced funds returns are higher than Ibovespa active returns

confirms Kacperczyk, Sialm and Zheng (2005), Glode (2011) and Casaccia et al (2011):

active management for a certain index does not outperform the respective benchmark.

However, IBrX active funds do outperform the IBrX passive strategy, which is an evidence for

Wermers (2000), Rochman and Eid Jr. (2006) and Castro and Minardi (2009) conclusions.

Sustainable funds returns go against Pinto, Lemme and Leal (2014) findings, or that this

class does not outperform the market. Thinking about Gil-Bazo, Ruiz-Verdú and Santos

(2010), this could mean that managers are not specialized in managing stocks from

sustainable companies.

Finally, endowment fund returns show poor performance, which is evidence to Baima (1998):

it means that the endowment fund regulation imposes greater constrictions to this kind of

fund.

3.5.2 NAV size groups analysis

(31)

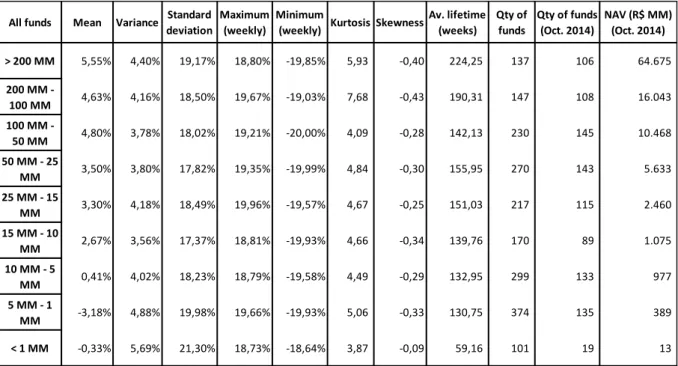
This result goes against Pástor, Stambaugh and Taylor (2015), Berk and Green (2004),

Chen et al (2004), Chan et al (2009) and Yan (2008): there is little or no evidence of

diseconomies of scale. On the other hand, it supports Latzko (1999), Dowen and Mann

(2004), Laes and Da Silva (2014) and Pollet and Wilson (2008). Thus, Brazilian equity funds

demonstrate returns of scale, trading stocks in a more efficient way due to their NAV size.

All funds

Mean

Variance

Standard

deviation

Maximum

(weekly)

Minimum

(weekly)

Kurtosis Skewness

Av. lifetime

(weeks)

Qty of

funds

Qty of funds

(Oct. 2014)

NAV (R$ MM)

(Oct. 2014)

> 200 MM

5,55%

4,40%

19,17%

18,80%

-19,85%

5,93

-0,40

224,25

137

106

64.675

200 MM -

100 MM

4,63%

4,16%

18,50%

19,67%

-19,03%

7,68

-0,43

190,31

147

108

16.043

100 MM -

50 MM

4,80%

3,78%

18,02%

19,21%

-20,00%

4,09

-0,28

142,13

230

145

10.468

50 MM - 25

MM

3,50%

3,80%

17,82%

19,35%

-19,99%

4,84

-0,30

155,95

270

143

5.633

25 MM - 15

MM

3,30%

4,18%

18,49%

19,96%

-19,57%

4,67

-0,25

151,03

217

115

2.460

15 MM - 10

MM

2,67%

3,56%

17,37%

18,81%

-19,93%

4,66

-0,34

139,76

170

89

1.075

10 MM - 5

MM

0,41%

4,02%

18,23%

18,79%

-19,58%

4,49

-0,29

132,95

299

133

977

5 MM - 1

MM

-3,18%

4,88%

19,98%

19,66%

-19,93%

5,06

-0,33

130,75

374

135

389

< 1 MM

-0,33%

5,69%

21,30%

18,73%

-18,64%

3,87

-0,09

59,16

101

19

13

TABLE 8: Descriptive statistics for all funds by NAV average size

Filtered

funds

Mean

Variance

Standard

deviation

Maximum

(weekly)

Minimum

(weekly)

Kurtosis Skewness

Av. lifetime

(weeks)

Qty of

funds

Qty of funds

(Oct. 2014)

NAV (R$ MM)

(Oct. 2014)

> 200 MM

8,39%

4,22%

19,25%

18,80%

-19,85%

6,18

-0,47

261,92

115

95

58.779

200 MM -

100 MM

7,42%

3,81%

18,17%

19,67%

-19,03%

8,54

-0,48

221,16

124

100

14.936

100 MM -

50 MM

5,78%

3,62%

17,76%

19,21%

-20,00%

4,36

-0,29

175,79

177

119

8.715

50 MM - 25

MM

5,19%

3,85%

18,19%

19,35%

-19,99%

5,29

-0,32

187,24

217

124

4.963

25 MM - 15

MM

6,14%

3,86%

18,34%

19,96%

-19,57%

5,17

-0,29

190,82

165

95

2.029

15 MM - 10

MM

3,30%

3,71%

17,90%

18,81%

-19,93%

5,08

-0,36

178,28

127

78

925

10 MM - 5

MM

3,64%

4,23%

19,00%

18,79%

-19,58%

5,00

-0,33

176,86

212

110

799

5 MM - 1

MM

-1,53%

4,79%

20,33%

19,66%

-19,89%

5,85

-0,40

178,00

257

115

330

(32)

3.5.3 Lifetime groups analysis

Lifetime analysis shows some different conclusions compared to size analysis. Firstly, older

funds have bigger returns. Then, older funds are riskier, since they have passed through

more volatile moments than younger ones.

Funds between 2 to 3 years old have the biggest NAV concentration. This group also

accounts for the highest number of funds. Table 10 shows such data for all funds, while table

11, for filtered ones.

All funds

Mean

Variance

Standard

deviation

Maximum

(weekly)

Minimum

(weekly)

Kurtosis Skewness

Av. lifetime

(weeks)

Qty of

funds

Qty of funds

(Oct. 2014)

NAV (R$ MM)

(Oct. 2014)

More than

8 years

13,77%

8,27%

27,46%

19,96%

-19,96%

11,38

-0,47

598,20

93

80

14.755

5 to 8 years

9,19%

4,53%

20,40%

19,66%

-20,00%

7,05

-0,37

312,70

207

137

12.822

4 to 5 years

3,73%

3,61%

18,10%

19,41%

-19,85%

5,02

-0,34

233,34

194

136

12.107

3 to 4 years

5,46%

3,81%

18,62%

19,02%

-19,81%

5,15

-0,35

179,22

176

89

9.219

2 to 3 years

2,07%

3,33%

17,10%

17,78%

-19,93%

5,09

-0,39

126,63

315

183

27.394

1,5 to 2

years

1,96%

3,64%

17,59%

19,47%

-18,78%

4,45

-0,28

90,66

206

96

8.477

1 to 1,5

years

-1,22%

3,89%

17,65%

19,67%

-19,89%

4,20

-0,32

64,67

245

128

7.002

Less than 1

year

-4,06%

4,71%

18,54%

19,48%

-19,93%

3,26

-0,17

25,68

509

144

9.956

TABLE 10: Descriptive statistics for all funds by average life time

Filtered

funds

Mean

Variance

Standard

deviation

Maximum

(weekly)

Minimum

(weekly)

Kurtosis Skewness

Av. lifetime

(weeks)

Qty of

funds

Qty of funds

(Oct. 2014)

NAV (R$ MM)

(Oct. 2014)

More than

8 years

13,77%

8,27%

27,46%

19,96%

-19,96%

11,38

-0,47

598,20

93

80

14.755

5 to 8 years

9,24%

4,53%

20,38%

19,66%

-20,00%

7,05

-0,38

312,65

206

136

12.821

4 to 5 years

3,75%

3,55%

17,98%

19,41%

-19,85%

5,03

-0,35

233,51

190

135

12.107

3 to 4 years

5,44%

3,77%

18,53%

19,02%

-19,81%

5,15

-0,35

179,12

173

89

9.219

2 to 3 years

2,54%

3,32%

17,08%

17,78%

-19,93%

5,09

-0,40

126,42

304

177

27.389

1,5 to 2

years

2,13%

3,65%

17,57%

19,47%

-18,78%

4,46

-0,28

90,66

196

94

8.476

1 to 1,5

years

-0,79%

3,93%

17,67%

19,67%

-19,89%

4,19

-0,32

64,93

232

125

6.709

(33)

This result goes against Jones (2007), Frumkin and Vanndegrift (2009), and Agarwal and

Jorion (2010), and confirms Gregoriou (2002) and Bessa and Funchal (2012): we can say

that long-lived funds do achieve higher returns.

When we think about Chevalier and Ellison (1998), younger managers avoid unsystematic

risk and, thus, they pursue a passive strategy. Considering Ibovespa annualized weekly

returns reached around 8%, only funds older than five years old could beat the index, since

they do not tend to follow indexes or “herding”

. However, younger funds should perform

better since they tend to “herd”

and since Ibovespa annualized mean average return is much

higher than their returns. Probably, according to Chevalier and Ellison (1997), their

managers, in order to attract more inflows, tend to gather riskier positions, resulting in few

winners and many losers.

3.6 Performance analysis

As mentioned before, performance measures selected are Jensen’s alpha, GH1, MM, GH2,

Imagem

TABLE 2: Anbima cathegories, types and risks SOURCE: ANBIMA, 2013Stocks EquityFixed IncomeMultimarket Equity + Leverage
Table 4 shows the descriptive statistics for benchmarks and figure 2 shows their histograms  and evolutions
TABLE 5: Descriptive statistics for all and filtered funds
TABLE 9: Descriptive statistics for filtered funds by NAV average size
+7

Referências

Documentos relacionados

phylogenetic species [34]. So far, the sexual phase of the ascomycete P. brasiliensis was not reported limiting our knowledge about the mechanisms that contribute to its

comparável a de um custo fixo. 3) Modelo de selecção adversa (Stiglitz (1976b) e Weiss (1980): As empresas, quando recrutam novos trabalhadores, revelam grandes dificuldades

Adicionalmente, um outro contexto, informal, situado no mesmo espaço de trabalho da equipa do CDIJ Oriental, mas no qual ocorriam os almoços descontraídos das educadoras, a

O produtor que pretende ter esta certificação tem de fazer as mudanças necessárias, que passam por investimentos na formação dos seus colaboradores, em criar meios para permitir

Este instrumento de colheita de dados, integra três domínios da saúde a saber, cuidados de saúde, promoção da saúde e prevenção da doença e ainda, quatro níveis de processamento

No que se re- fere à principal palavra ou expressão que descreve a ausên- cia do homem (pai) no trabalho de parto e nascimento, utili- zadas pelo próprio, as respostas são apenas seis

Segundo Ausubel, apud Moreira (2012), o conhecimento prévio é a variável isolada mais importante para a aprendizagem significativa de novos conhecimentos, ou seja, os

In the ocean, the variability of environmental conditions found along depth gradients exposes populations to contrasting levels of perturbation, which can be reflected in the