DOI: 10.1590/1808-057x201703590
*Paper presented at the 15th Brazilian Finance Conference, São Paulo, SP, Brazil, July 2015.
Predictive power of Brazilian equity fund performance using R
2as
a measure of selectivity*
Marcelo dos Santos Guzella
Universidade de São Paulo, Faculdade de Economia, Administração e Contabilidade, Departamento de Contabilidade e Atuária, São Paulo, SP, Brazil
Companhia de Desenvolvimento Econômico de Minas Gerais, Belo Horizonte, MG, Brazil
Carlos Heitor Campani
Universidade Federal do Rio de Janeiro, Instituto COPPEAD de Administração, Rio de Janeiro, RJ, Brazil Edhec-Risk Institute, Paris, France
Received on 04.14.2016 - Desk acceptance on 05.23.2016 - 2nd version approved on 11.25.2016
ABSTRACT
his paper aimed to investigate the impact of levels of selectivity on the performance of equity funds using a methodology applied for the irst time ever (as far as we know) in the Brazilian market. As an indicator of the activity level of a fund, we proposed the coeicient of determination (R2) of the regression of its returns over market returns. In total, 867 funds were
analyzed in the period between November 2004 and October 2014. he hypothesis tested is that more selective funds perform better to compensate for their higher operating costs. his hypothesis was conirmed in the Brazilian market. Dynamic equally-weighted portfolios of funds were simulated, according to their past R2 and alphas, with monthly rebalancing and
12-month moving windows. he portfolio of the most selective funds had a Sharpe ratio of 0.0494, on a monthly basis, while the portfolio of the least selective funds had a Sharpe ratio of -0.0314. Performance was also higher in evaluations involving excess returns, Jensen’s alpha, and accumulated returns, as well as when compared to randomly selected portfolios. Moreover, past performance (as measured by Jensen’s alpha) was also a predictor of future performance. Particularly, the portfolio composed by funds with a higher past alpha and lower past R2 presented a Sharpe ratio of 0.1483 and a Jensen’s
alpha of 0.87% (signiicant at 1%), while the one composed of funds with a lower past alpha and lower activity level presented a Sharpe ratio of -0.0673 and an alpha of -0.32% (also signiicant at 1%).
1. INTRODUCTION
An important step in deciding to invest in variable income is selecting the assets that will form part of a portfolio. In the case of investment funds, the choice could be between passive funds that accompany indices or active funds that try to compensate for a higher cost style with better returns. According to a piece from Th e Economist
(Fund management will invest for food: like books and music, the investment industry is being squeezed, 2014), total global assets under active management currently exceed 50 trillion dollars. A plausible estimate of the diff erence in average fees and costs between active and passive funds is 1% of total assets under management (Daniel, Grinblatt, Titman, & Wermers, 1997). h is means that active management generates additional costs of approximately half a trillion dollars annually and most of this can be associated with eff orts to select the assets that will form part of the portfolios. By how much do these funds systematically achieve gross earnings that exceed this amount? Can a fund’s level of activity indicate higher expected returns? If so, how can funds be selected using levels of activity in order to maximize the chances of obtaining the best returns?
Various studies have proposed simple or sophisticated methods for obtaining these answers. h is study aims to apply, for the i rst time ever in the Brazilian market (as far as we know), the methodology from Amihud and Goyenko (2013), authors who investigated the eff ectiveness of one method for selecting US equity funds based on their levels of activity or selectivity, under the hypothesis that greater activity would generate greater returns.
h e method assumes two relationships: the i rst, that funds that select their assets more present better performance, and the second, that these more selective funds show a path of returns that is less correlated with that of the market. h ese assumptions lead to measuring level of selectivity based on the coei cient of determination (R2) of the linear regression of these funds’ excess returns
compared with excess market returns. h e less market results can explain the variability of a fund’s returns, the greater the selectivity of the fund, and therefore the better its performance will be. In other words, considering that market benchmarks are only fundamentally exposed to systematic risk, the more eff ective a fund’s exposure to idiosyncratic risks, the better its average performance will be. h is therefore concerns a method that requires normally available information in order to facilitate its application.
Amihud and Goyenko (2013) analyzed the monthly
returns of 2,460 funds with equity of at least 15 million dollars, covering 1988 to 2010. h e moving window for calculating the R2 and performance was 24 months.
Performances were measured using the alpha generated based on the regressions using the four factors model, known here as Fama, French, and Carhart (FFC), explained by Carhart (1997) and developed based on the Fama and French (1993) model. As a robustness test, the Cremers, Petajisto, and Zitzewitz (2012) model was also used, known here as CPZ. First, the performances of portfolios containing funds with diff erent levels of R2 and alphas were compared. h en, using regression
models, the ability to predict a fund’s performance using its R2, calculated based on its past performance, was
verii ed. Finally, also using regression models, the main determinants of the R2 of the funds were calculated, by
investigating the explanatory power of characteristics such as time under current management, size, age, expenses, turnover, and style.
h e results from Amihud and Goyenko (2013) coni rm these relationships and allow it to be concluded that there is eff ectiveness in the methodology. h e portfolio of funds with the lowest R2 and highest performance
presented signii cantly better returns than those of the other portfolios. Moreover, the relationship between the R2 and some fund characteristics reveals that it is a
consistent measure of selectivity, with time under current management, expenses, and size being the variables that inl uence it the most.
In this context, this study proposes to apply this asset selection methodology in the Brazilian equity funds market. h e quantity, size, and diversity of this class of funds have signii cantly evolved in the country over the last decades and they represent an important investment activity. Based on the relationship with the performance of the most well-known stock market index of the Brazilian stock exchange [Bovespa index (Ibovespa)] and a proxy for the risk-free interest rate, the level of selectivity of these funds is measured and the hypothesis that more selective funds present better performance is tested.
positions and the composition of market indices, the greater the performance presented. The study from Daniel et al. (1997), in turn, concluded that the diff erence in performance was correlated with fund expenses. Kacperczyk and Seru (2007) showed that funds that invest in assets based on fundamental information that diff ers from analyst expectations perform better.
In Brazil, some papers have been developed in order to analyze the performance of funds with active management and to identify the variables with the greatest explanatory power with regards to the performance of these funds. Castro and Minardi (2009) developed a study comparing the performances of Brazilian funds classii ed as active and passive, covering 1996 to 2006. h e results indicated that active management, although it is preferred by investors, does not generally present any net or even gross income that is greater than that of passive funds, leading to the belief that the search for market inei ciencies did not bring the returns expected in the Brazilian market in the period. In other words, security prices would already rel ect all existing information up to the point at which marginal benei ts from its use would not exceed the marginal costs. With a diff erent result, Rochman and Eid (2006) produced a similar paper comparing 699 publicly-traded Brazilian
funds, covering 2001 to 2006, and the results showed that for multimarket equity funds active management would add investor value.
Malacrida, Yamamoto, Lima, and Pimentel (2007) analyzed the performance of Brazilian funds under active management in relation to the Ibovespa, with data on 66 funds covering 1999 to 2006. It was possible to determine that performances can be very diff erent between funds in the short and long terms, but that almost 40% of the funds presented a consistent performance in the period, which would indicate that active management may have been advantageous for these funds.
h is article is organized in the following way: the next section carries out a review of the literature regarding the methodology replicated for the Brazilian market, as well as the other ways of measuring levels of activity and the applicability of asset pricing models in Brazil. h en, the adopted methodology is described, as well as the criteria for and characteristics of the sample of funds used. h e next section presents and discusses the results from applying the methodology, section 5 presents some important robustness tests, and section 6 concludes the paper.
2. LITERATURE REVIEW
2.1 Predicting performance based on the R2
This study is based on the methodology created by Amihud and Goyenko (2013) for predicting fund performance based on level of selectivity. h e methodology supports the hypothesis that the greater a fund’s level of activity is, the better its performance will be. Performance is measured by the alpha of the regression of its excess returns using the FFC four factors model and also the four factor CPZ model as a robustness test. h e methodology’s originality involves measuring level of activity using the R2 of the regression of excess fund returns based on the
FFC model. According to this method, the lower the R2 of a fund is in this regression, the higher its level of
activity or selectivity.
In order to avoid using a model based on a spurious relationship, Amihud and Goyenko (2013) compared their methodology with other methods of evaluating fund selectivity that use the compositions of fund portfolios as information. One of these methodologies is represented by the characteristic selectivity indicator from Daniel et al. (1997). h is metric forms part of a performance
measure that compares each share in a fund’s portfolio with one of 125 diff erent passive benchmarks. h ese benchmarks are portfolios composed of shares with a similar size, book-to-market, and return in the previous year. h ese three measures were adopted as they are the best ex-ante predictors of return on shares, according to previous studies (Daniel et al., 1997; Fama & French, 1992; Jegadeesh & Titman, 1993). Fama and French (1992) simultaneously examined a series of variables and concluded that size and book-to-market are the ones that can explain the variations in expected transversal returns on shares. Subsequently, Jegadeesh and Titman (1993) described signii cant returns derived from the strategy of selling shares that have performed poorly in the past and buying those that have performed well. h e selectivity characteristic of a fund is, therefore, the weighted average excess return on the fund’s shares in relation to a passive portfolio composed of shares with the same characteristics.
Amihud and Goyenko (2013) regressed the selectivity indicator characteristic using the R2 and other fund
statistical models constructed by the authors included six important fund characteristics: (i) size, measured by net equity, (ii) expenses, measured by the percentage of administrative, management, and operating expenses in relation to net equity, (iii) turnover, measured by the lowest between total share sales or purchases in the last 12 months divided by average net equity in the period, (iv) age, measured by the diff erence in years between the observation date and the date on which a fund’s shares were off ered for the i rst time, (v) mandate, or time under current management, measured by the diff erence in years between the observation date and the date on which the fund management related to that observation assumed control, and i nally, (vi) the style or type of fund. Styles were organized into nine categories: (i) aggressive growth, (ii) proceeds, (iii) growth, (iv) long term growth, (v) growth and proceeds, (vi) maximum capital gains, (vii) mid-cap, (viii) small cap, and (ix) micro-cap. h e last three refer to the typical market value standard of the companies in which a fund focuses on investing, representing, respectively, mid-value, small, and very small companies.
h e results from the regression of the selectivity characteristic based on the R2 and fund characteristics
showed that the R2 can be considered as determinant of
the level of fund selectivity. h e model resulted in negative and signii cant coei cients for the R2, coni rming its ability
to measure selectivity.
Amihud and Goyenko (2013) created fund portfolios in accordance with their alphas and R2 calculated based on
the previous 24 months. h is was organized by quintiles. Each month, each portfolio was adjusted to compose the funds with the R2 and alphas that corresponded to
each quintile. A higher average alpha was expected in the portfolio with a position for buying funds with a lower R2 and higher alpha. Quintiles represented by
portfolios containing funds with a higher R2 or with a
lower alpha should present successively lower returns. Using the sample of returns for 2,460 funds covering 1988 to 2010, the quintile with funds with the lowest R2 and
highest alpha presented a statistically signii cant return of 3.8% a year, greater than the average return from the other quintiles and thus coni rming the stated hypothesis.
To examine the variables with the power to predict fund performance, their alphas were subjected to regression based on their R2 and alpha relating to the previous month.
h e model also contemplated the six fund characteristics. h e hypothesis is that the coei cient of the regression associated with the R2 is negative and signii cant; that
is, the lower a fund’s R2,based on past evolution, the
greater its performance in the subsequent period. h e
results using the FFC model indicated that the lagged R2
presents a signii cant and negative coei cient, coni rming the hypothesis. Similar results occur for the transformed logarithm of R2 and by altering the pricing model to CPZ.
At er coni rming the predictive power of a fund’s
performance based on its R2, Amihud and Goyenko
(2013) sought to identify the eff ects of its characteristics on the R2. h e aim was to identify the variables that best
explain a fund’s R2, and consequently its level of activity.
For this, a regression model was constructed with R2
as the dependent variable and these characteristics as independent variables. h e characteristics that presented a signii cant coei cient were expenses, size (measured by net equity), and time under current management. Only the size variable presented a positive coei cient. h e results indicated that funds with higher fees and costs tend to have a greater level of activity, and for this reason, a lower R2. Moreover, managers with less time
tend to avoid non-systematic risks when they select their portfolios. h e positive coei cient of the size variable allows for it to be said that smaller funds tend to risk more, accompanying the market less. h e turnover and age variables did not present signii cant coei cients. h e style of the funds also determined the R2: micro-cap,
mid-cap, and aggressive growth type funds presented a low R2 and small cap, growth and proceeds, growth, and
long term growth funds presented a high R2.
2.2 Asset Pricing Models in Brazil
As mentioned, in order to measure a fund’s level of activity, this study uses the R2 from the regression of its
excess returns based on excess Brazilian stock market returns. Moreover, we use the alpha (linear coei cient) from the same regression to measure fund performance. We chose the Capital Asset Pricing Method (CAPM) in both cases due to the fact that it is relatively simple and widely known and used, both in Brazil and abroad. h ere is no consensus with regards to the applicability of models such as Fama-French and its variants in the Brazilian market. Laes and Silva (2014), for example, indicate that results based on these models present problems of non-normality of residues, the presence of a correlation between the alphas of the funds in a sample, and the luck factor as a possible reason for better performance. h e paper consisted of applying bootstrapping techniques in a sample of 812 funds covering 2002 to 2009 and it in fact showed that in a good number of cases the luck variable is the factor determining performance.
(2010) saw that the inclusion of better moments in the CAPM, in order to capture systematic kurtosis and asymmetry eff ects, is not of great relevance for improving the applicability of the model in Brazil. Oliveira, Mussa, and Gouvea (2011) tested the explanatory power of the CAPM, 3-Factor, and 4-Factor models in the Brazilian equity fund market, using data from 2002 to 2009, and concluded that none of these models presented good explanatory power for these funds’ returns.
With a similar aim, Bellizia (2009) investigated the applicability of the CAPM for determining cost of own capital in Brazil. h e model was chosen instead of others, such as arbitrage pricing theory (APT) and Fama-French, due to it being more widespread in Brazil. Most of the criticisms related to the APT model concern the inexistence of a well dei ned methodology for identifying the factors to be considered. In the case of Fama-French, it bears mentioning that the model was constructed based on empirical evidence in the US market and lacks theoretical support.
In a comparative study, Argolo, Leal, and Almeida (2012) tested the applicability of the Fama-French model in Brazil. h e analysis covered the period from 1995 to 2007 and showed that, despite this model having a greater explanatory power than the CAPM, high averages and instability in the “high minus low” (HML) and “small minus big” (SMB) factors were found. Estimates of cost of own capital using the CAPM were more reasonable from a i nancial point of view. Moreover, the lack of a suitable number of liquid shares and a sui ciently long historic record make parametrization of the Fama-French model dii cult.
Regardless of the controversial results from the multifactor models in the Brazilian market, we opted to use the FFC model as a robustness test in section 5 in order to make our results even more consistent and comparable with the original paper for the US market.
2.3 Other Measures of Investment Fund Level of Activity
Besides the methodology from Amihud and Goyenko (2013), there are others such as “active share”, from
Cremers and Petajisto (2009), “industry concentration index”, and “return gap”, both from Kacperczyk et al. (2005).
Active share represents the sum of absolute errors between the position of each share in a portfolio of funds and the position in a related benchmark. According to Amihud and Goyenko (2013), the measure based on the R2 is more direct, uses quickly available data, and does not
require access to a fund’s portfolio composition, which is ot en an unavailable piece of data. Calculating the most suitable benchmark for comparing can also be problematic. A fund that invests passively in two benchmarks would be incorrectly identii ed with a high level of activity according to active share. Amihud and Goyenko (2013) developed statistical tests between active share and R2, resulting in an
average correlation of -0.45 between the indicators. h is shows that, even sharing the proposal of measuring level of selectivity, each indicator incorporates information on funds that is not contemplated by the other. h e authors also investigated whether including this indicator in the regression model for the funds’ alphas would result in a loss in the signii cance of the R2. h e funds’ alphas were
then regressed based on their R2, their active share, and
their characteristics. Even in this model, the coei cient of the R2 continued to be negative and signii cant, which
shows that this metric contributes to predicting fund performance in addition to the suggested predictive power of active share.
h e industry concentration index represents the sum of the squares of the deviations between the positions of diff erent industries in a portfolio of funds and in a market portfolio. h is measure basically has the same limitations discussed previously regarding active share.
Return gap is the difference between the return reported by a fund and the return of a benchmark portfolio that carries the same shares. In the same way they did with active share, Amihud and Goyenko (2013) included these last two indicators as explanatory variables in the regression for the funds’ alphas based on their R2 and their
characteristics. Even at er the inclusion, the coei cient of the R2 remained signii cant and negative, leading to the
3. RESEARCH METHODOLOGY
In this section we present the criteria adopted to replicate the methodology from Amihud and Goyenko (2013) in the Brazilian market in order to predict fund performance based on a proxy for the level of selectivity of each fund.
3.1 Selectivity Measure Specii cation
In this paper the coei cient of determination R2 was
used to measure the level of selectivity of the funds to be analyzed. h is statistical measure, well established through classical analysis by linear regression [see, for example, Rao (1973)], indicates whether the model used in the linear regression is a good representation of the variable to be explained. In other words, it shows how much of the variance in the independent term, which in this case is excess fund returns, is explained by the model, as equation 1 shows.
If this model represents a market portfolio, the R2
measures the similarity between the performance paths of a fund and of this portfolio. h e risk to which funds are exposed can be divided into systematic and non-systematic or idiosyncratic. Market portfolios, if they are sui ciently diversii ed, are only exposed to systematic risk. h erefore, from a i nancial point of view, the variance in the residues from the regression can be understood as the
idiosyncratic risk to which a fund is exposed. Amihud and Goyenko (2013) discuss this point, providing a good theoretical foundation and arguing that more selective funds have diff erent paths of returns from the market portfolio and are more exposed to idiosyncratic risk. Consequently, they conclude that the R2 can be adopted
as an inverse measure of the level of activity of funds, as shown in equation 2.
R
2=
Total variance
Variance of model
Total variance
Variance of residuals
= 1 –
Idiosyncratic risk + Systematic risk
Idiosyncratic risk
R
2= 1 –
h e market portfolio in this paper was represented by the Ibovespa and the Interbank Deposit Certii cate (CDI) was adopted as the proxy for the risk-free interest rate.
3.2 Composition of the Sample of Funds
h e ten years between November 2004 and October 2014 were considered for the analysis. h is period is understood to be sui ciently long, with periods of stability and periods of crises. Monthly time series of the returns and net equities of Brazilian funds classii ed as active were extracted from the Quantum Axis platform. h e returns are net of administration fees. For each fund, its operating style was also obtaining according to the criterion created by the Brazilian Association of Financial and Capital Market Entities (Anbima, 2015). h is extraction resulted in 1,296 Brazilian equity funds operating and with data available in November 2014, the time of extraction. h e
Quantum Axis platform dei nes active equity funds as those with assets traded on stock exchanges or contracts traded on the future index and options market. h ese funds are also considered as equity funds according to the classii cation made by the Brazilian Securities and Exchange Commission (CVM). 399 funds classii ed as masters and 30 funds with an average net equity below one million reais were excluded, increasing the liquidity level of the sample and resulting in a sample of 867 funds.
In order to increase the eff ectiveness of the measure of level of selectivity using R2 and guarantee a sample
with accessible funds for the common investor, 189 funds were excluded from the sample that require a minimum investment above 100 thousand reais and 286 funds with a restricted, reserved, or exclusive target public. h ese exclusions resulted in a set of 392 funds. Additionally and as a robustness test, a simulation without these eliminations was carried out to evaluate the consistency
1
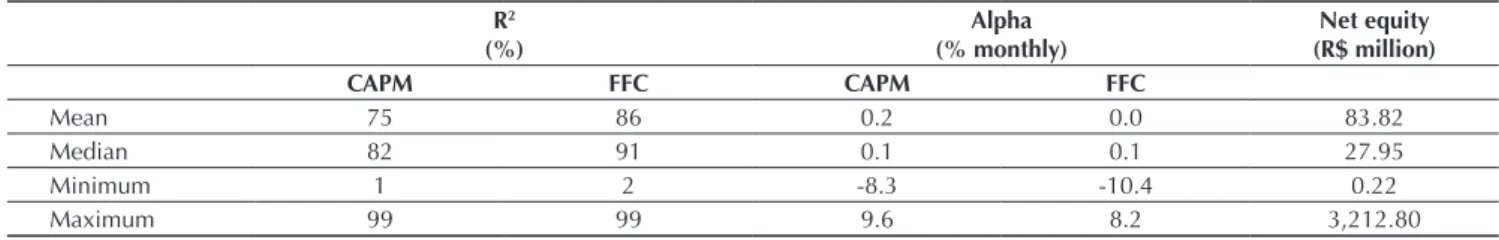
Table 1 Characteristics of the sample of funds used for the portfolio simulations
R2
(%)
Alpha (% monthly)
Net equity (R$ million)
CAPM FFC CAPM FFC
Mean 75 86 0.2 0.0 83.82
Median 82 91 0.1 0.1 27.95
Minimum 1 2 -8.3 -10.4 0.22
Maximum 99 99 9.6 8.2 3,212.80
Note: coeffi cient of determination (R2) and alpha are calculated based on regressions using the Capital Asset Pricing Method
(CAPM) or Fama, French, and Carhart (FFC) as pricing models, the Bovespa index as a proxy for market return, and the Interbank Deposit Certifi cate (CDI) as a proxy for the risk-free interest rate.
Source: Prepared by the authors.
of the model. Moreover, again for robustness purposes, another scenario was generated that excludes 157 funds with investments abroad; investments abroad could generate a low R2 without necessarily greater selectivity
in the domestic market.
3.3 Pricing Model Specii cation
Both for determining the R2 and the alpha, the
CAPM was used in the base case and the FFC model as a robustness test. h e CDI was adopted as a proxy for the risk-free interest rate and the Ibovespa as a proxy for market returns, due to them better representing alternatives for a conventional investor. For the additional three risk factors in the FFC model, we stuck rigidly to the methodology applied by Santos, Famá, and Mussa (2012).
Fund alphas and R2 were calculated monthly based on
the linear regression for their excess returns in relation to the CDI, using excess returns on the Ibovespa in relation to the CDI as an explanatory variable (and the three factors of FFC in the robustness test). h e alpha
and R2 for a particular month are thus results of the
regression that uses a moving window with observations from the previous 12 months as a sample. h is period is considered to be sui cient for verifying the correlation between fund performance and that of the Ibovespa and also makes the results more signii cant and the model more frugal. h e i rst 12 months of the sample were the initial window for calculating the R2 and alpha of the
subsequent month, leading to a total of nine years, or 108 months, for constructing the portfolios of funds. Any fund that appeared during this nine-year period is only considered for constructing the portfolios 12 months at er its inauguration, as only from here onwards can its R2 and alpha series be estimated.
Observations with an R2 below 0.5% or above 99.5%
were excluded from the sample in order to eliminate outlier strategies, estimative errors, or pure indexers. With this a total of 39,057 observations were reached. Table 1 presents mean, median, minimum, and maximum values from the sample of funds used.
3.4 Construction of Dynamic Fund Portfolios
To evaluate the inl uence of the R2 on fund performance,
hypothetical portfolios were constructed with equal weights and monthly updating of the funds that comprise the portfolio of each fund. In each month of the sample, i ve diff erent fund portfolios are constructed based on their R2. Each portfolio represents one quintile of the
sample of funds. In the 1st quintile are the funds with the
lowest recorded R2 values and in the 5th quintile are those
with the highest R2 values. h e same rule is adopted for
the intermediate quintiles into which the other funds are allocated. h e higher the quintile is in the order, the higher the R2 of the component funds. h e quintiles have the
same number of funds, approximately (this occurs because the total number of funds in each month is generally not a multiple of i ve). As the sample contains only the funds
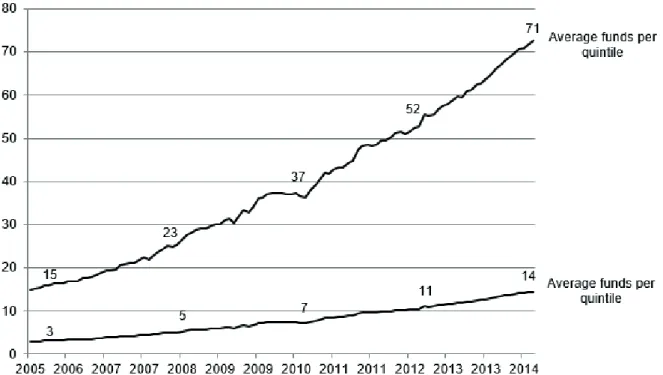
that are active at the end of the period, the quantity of funds available to compose the portfolios increases over time. Figure 1 shows the evolution in the quantity of funds that compose each quintile and subquintile.
The hypothesis to be tested is that the portfolio represented by the 1st quintile will present a better
performance than that represented by the 2nd quintile,
and so on. For a comprehensive analysis, excess average returns, the alpha, the Sharpe ratio, and cumulative returns were used as performance measures.
To control the results by the alpha recorded by a fund based on the previous 12 months, each quintile composed based on the R2 was subdivided into i ve
subportfolio is represented by the funds with the highest alpha values recorded in that quintile based on the R2,
and so on until the 5th subquintile. By combining quintiles
created based on R2 with subquintiles created based on
alpha, the model thus has 25 subportfolios. Each month, reordering and regrouping is carried out of the funds in
the subportfolios following this logic. For performance persistence, it is expected that a fund’s historic alpha also has explanatory power for portfolio performance. In other words, the best performance is expected from the subportoli o containing funds with the highest alpha values and the lowest R2 values.
Figure 1 Evolution of the average quantity of funds in each portfolio resulting from the simulation
Note: the quintiles are represented by portfolios of funds selected according to their coeffi cient of determination (R2). The
subquintiles are subdivisions of the quintiles represented by the portfolios of funds selected according to their alphas. R2 and
alpha are obtained via linear regression for excess fund returns over excess returns on the Bovespa index and using the Interbank Deposit Certifi cate as a proxy for the risk-free interest rate and 12-month moving windows.
Source: Prepared by the authors.
Finally, portfolios were also constructed with the random selections of funds. Each month, the funds were organized into i ve quintiles, but chosen randomly instead of ordered by R2. h e sample used in this simulation
is the same and the frequency of selection continues to be monthly, with equal weights. h e performance
of these portfolios will be compared with that of those organized according to fund R2. h e portfolio with the
lowest R2 funds is expected to perform better than those
with randomly selected funds. Portfolios with higher R2 funds are also expected to perform worse than those
4. RESULTS
h e simulations and analyses coni rm the hypothesis that there is an inverse relationship between R2 and
performance in the Brazilian fund market, as verii ed in the US market by Amihud and Goyenko (2013).
In Tables 2, 3, and 4, the excess average returns, alphas, and Sharpe ratios are presented, respectively, on a monthly basis for each portfolio of funds, representing their performance. h e portfolios were generated based on the ordering of the R2 and alpha of the sample of
funds, with a monthly selection frequency. Each portfolio represents one quintile of the R2 distribution and one
quintile of the alpha distribution for the funds. A portfolio of funds with the lowest R2, for example, is composed of
funds that, each month, were among the 20% with the lowest R2. h e alphas of the portfolios were estimated via
regression for all of the sample period, using CDI and Ibovespa as proxies for risk-free interest rate and market returns, respectively. h e t statistic of the alphas is also presented in each cell of Table 3.
Table 2 shows that, in the period and sample of funds analyzed, the portfolio of funds with the lowest R2 obtained an excess average net return of 0.26% per
month and the portfolio of funds with the highest R2
obtained an excess average net return of -0.19%. More selective funds presented, therefore, better performance in the excess returns evaluation. h e same situation can be found in the evaluation by alphas and by the Sharpe ratio. Table 3 indicates that the portfolio of funds with the lowest R2 presented a monthly alpha of 0.34%, and the
portfolio of funds with the highest R2 presented an alpha
of -0.09%. h e portfolio of funds with the lowest R2 and
highest past alpha generated an average alpha (statistically signii cant to 1%) of 0.87% a month, something close to 11% a year, an even more optimistic result that the 3.8% a year found in the US market by Amihud and Goyenko (2013). In accordance with Table 4, the portfolio with the most selective funds presented a Sharpe ratio of -0.0314. Based on these i ndings, it is perceived that higher levels of selectivity are rewarded with better performance.
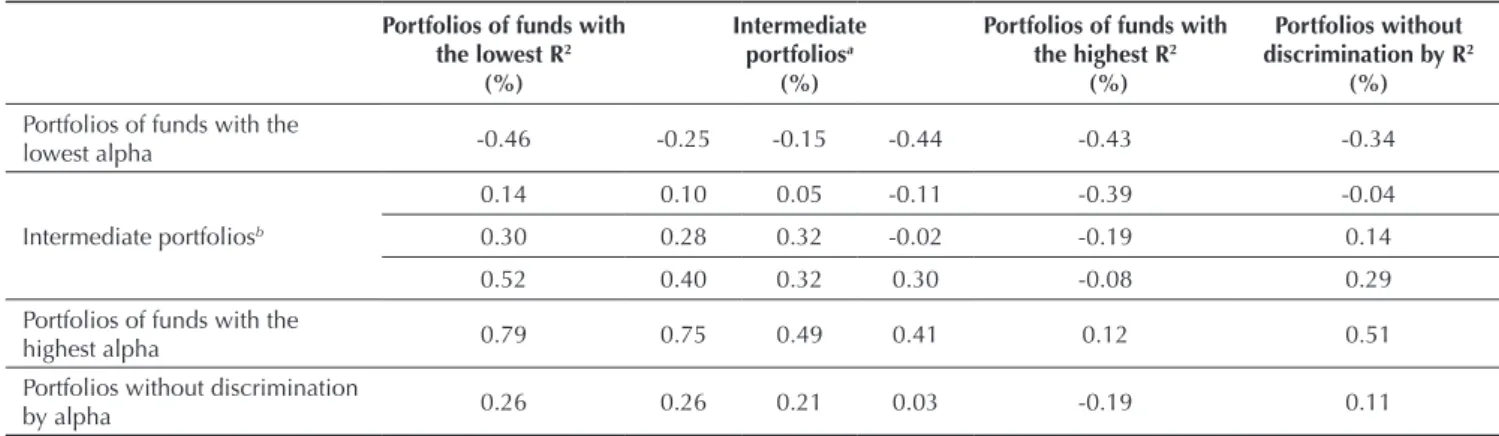
Table 2 Excess average monthly returns for each portfolio of funds.
Portfolios of funds with the lowest R2
(%)
Intermediate portfoliosa
(%)
Portfolios of funds with the highest R2
(%)
Portfolios without discrimination by R2
(%)
Portfolios of funds with the
lowest alpha -0.46 -0.25 -0.15 -0.44 -0.43 -0.34
Intermediate portfoliosb
0.14 0.10 0.05 -0.11 -0.39 -0.04
0.30 0.28 0.32 -0.02 -0.19 0.14
0.52 0.40 0.32 0.30 -0.08 0.29
Portfolios of funds with the
highest alpha 0.79 0.75 0.49 0.41 0.12 0.51
Portfolios without discrimination
by alpha 0.26 0.26 0.21 0.03 -0.19 0.11
Note: eachportfolio is composed by monthly organizing the sample of Brazilian equity funds considering assets into quintiles (columns), in accordance with their coeffi cient of determination (R2), and into subquintiles (lines), in accordance with their
alpha. The excess returns from the portfolios are also presented without organizing by alpha and without organizing by R2. Fund
alpha and R2 are obtained via regression using the Bovespa index and the Interbank Deposit Certifi cate and 12-month moving
windows.
a: the more to the right this is, the higher the R2 of the funds; b: the lower this is, the greater the alpha of the funds.
Source: Prepared by the authors.
h e same situation can be observed in the portfolios with the selection also controlled by the alpha of the funds. Out of the portfolios containing funds with the best alpha, the one containing funds with the lowest R2
presented, on a monthly basis, an average excess return of 0.79%, an alpha of 0.87%, signii cance to a degree of 1%, and a Sharpe ratio of 0.1483. As for the least selective funds, or with the highest R2, these presented an average
excess return of 0.12%, an alpha of 0.22%, and a Sharpe ratio of 0.0207. By analyzing the intermediate portfolios, it is perceived that the greater the alpha and the lower the R2 of the component funds, the lower the performance
of the basket of funds. h e results show that alpha and R2 are relevant parameters for investment choice and for
Table 4 Monthly Sharpe ratio for each portfolio of funds
Portfolios with the lowest R2 funds
Intermediate portfoliosa
Portfolios with the highest R2 funds
Portfolios without discrimination by R2
Portfolios of funds with the
lowest alpha -0.0753 -0.0398 -0.0244 -0.0722 -0.0673 -0.0573
Intermediate portfoliosb
0.0262 0.0174 0.0084 -0.0188 -0.0621 -0.0071
0.0547 0.0514 0.0551 -0.0028 -0.0302 0.0249
0.1046 0.0729 0.0594 0.0525 -0.0140 0.0541
Portfolios of funds with the
highest alpha 0.1483 0.1303 0.0816 0.0699 0.0207 0.0907
Portfolios without discrimination
by alpha 0.0494 0.0450 0.0357 0.0048 -0.0314 0.0197
Note: the Sharpe ratio is the ratio of average excess return over risk. Risk is measured by the standard deviation of these excess returns. The portfolios represent quintiles and subquintiles of funds organized monthly by their coeffi cient of determination (R2)
and alpha. The Sharpe ratios of the portfolios without organizing by alpha and without organizing by R2 are also presented.
a: the more this is to the right, the higher the R2 of the funds; b: the lower this is, the greater the alpha of the funds.
Source: Prepared by the authors.
Table 3 Monthly alphas for each portfolio of equity funds
Portfolios of funds with the lowest R2
(%)
Intermediate portfoliosa
(%)
Portfolios of funds with the highest R2
(%)
Portfolios without discrimination by R2
(%)
Portfolios of funds with the lowest alpha -0.37 (1.17) -0.15 (0.63) -0.05 (0.26) -0.34** (2.21) -0.32*** (3.27) -0.24 (1.46)
Intermediate portfoliosb
0.22 (0.87) 0.20 (0.88) 0.15 (0.77) -0.01 (0.08) -0.28*** (3.23) 0.06 (0.36) 0.39 (1.41) 0.37* (1.74) 0.41** (2.25) 0.08 (0.57) -0.08 (0.82) 0.23 (1.49) 0.60** (2.32) 0.49** (2.21) 0.40** (2.29) 0.40** (2.47) 0.02 (0.19) 0.38** (2.37) Portfolios of funds with the
highest alpha 0.87*** (3.14) 0.84*** (3.53) 0.59*** (2.64) 0.51*** (2.95) 0.22 (1.56) 0.61*** (3.24) Portfolios without discrimination
by alpha 0.34 (1.45) 0.35* (1.71) 0.30* (1.78) 0.13 (0.97) -0.09 (0.90) 0.21 (1.33) Note: the alphas represent the intercept of the linear regression for excess returns on the portfolios with excess returns on the Bovespa index. The alphas of the portfolios are also presented without organizing by alpha and without organizing by coeffi cient of determination (R2). The alphas are presented with their respective t statistics, indicating their statistical signifi cance (***: 1%;
**: 5%; *: 10%).
a: the more this is to the right, the higher the R2 of the funds; b: the lower this is, the higher the alpha of the funds.
Source: Prepared by the authors.
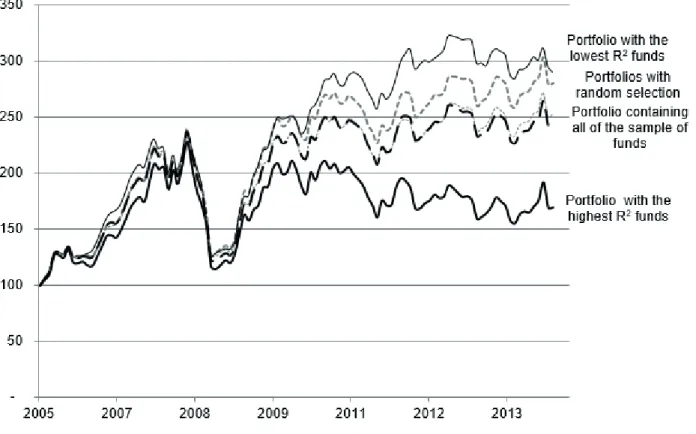
Figure 2 allows for a visual understanding of the performance of some of the portfolios constructed. It presents the evolution of monthly returns for the portfolio containing all of the funds, for that constructed of the funds with the highest R2, and that formed of the funds
with the lowest R2. Moreover, the portfolios constructed
by means of random selection are represented by those with the highest and lowest cumulative return in the simulation: 180% and 152%, respectively. h e returns are shown in the cumulative composed form based on the same 100 base, in nominal terms. h ere was no selection
of funds by alpha in the portfolios shown in the i gures. h e cumulative return for the portfolio of funds with the highest R2 was only 70% and very close to that of
the Ibovespa (81%), while that of the average for the funds in the sample was 142%. h e cumulative return for the most active funds, on the other hand, was 190%, and much higher than that for the portfolio consisting of all of the funds. h e results favor the use of the R2 as
Figure 2 Evolution of cumulative return for the portfolios
Note: the paths of return refer to the portfolios formed of funds with the highest coeffi cients of determination (R2), by the lowest
R2 funds, by randomly selected funds (dotted grey line), and by the sample with all of the funds (dotted black line). Out of the
randomly composed portfolios, those that showed the highest and lowest fi nal return values were presented, indicating the breadth of results. The values are presented using a base of 100.
Source: Prepared by the authors.
5. ROBUSTNESS TESTS
For initial robustness tests, the same investigation was carried out in two diff erent scenarios: (i) without restrictions in relation to target public, minimum investment, and investor proi le, and (ii) ignoring funds with investments abroad. It is also clearly found in these scenarios that the R2 of the funds is a powerful determinant
of performance. Portfolios containing funds with lower R2, and consequently with a higher degree of selectivity,
present higher performances than those that contain funds
with higher R2 values. h is occurs whether controlling
Table 5 Monthly Sharpe ratios for each portfolio of funds in a scenario without fi lters related to minimum investment and investor profi le
Portfolios with the lowest R2 funds
Intermediate portfoliosa
Portfolios with the highest R2 funds
Portfolios without discrimination by R2
Portfolios of funds with the
lowest alpha -0.0631 -0.0280 -0.0458 -0.0337 -0.0812 -0.0517
Intermediate portfoliosb
0.0005 0.0091 0.0245 -0.0081 -0.0511 -0.0059
0.0996 0.0720 0.0561 0.0298 -0.0293 0.0429
0.1385 0.1014 0.0605 0.0483 -0.0033 0.0688
Portfolios of funds with the
highest alpha 0.1120 0.0978 0.0900 0.0597 0.0162 0.0762
Portfolios without discrimination
by alpha 0.0537 0.0485 0.0361 0.0186 -0.0306 0.0242
Note: the Sharpe ratio is measured by the ratio between the average and standard deviation of excess return on the funds. The Sharpe ratios of the portfolios without organizing by alpha and without organizing by coeffi cient of determination (R2)are also
presented.
a: the more this is to the right, the higher the R2 of the funds; b: the lower this is, the greater the alpha of the funds.
Source: Prepared by the authors.
Table 6 Monthly Sharpe ratios for each portfolio eliminating funds that invest abroad
Portfolios with the lowest R2 funds
Intermediate portfoliosa
Portfolios with the highest R2 funds
Portfolios without discrimination by R2
Portfolios of funds with the
lowest alpha -0.0580 -0.0445 -0.0467 -0.0894 -0.0776 -0.0655
Intermediate portfoliosb
-0.0069 0.0277 0.0067 -0.0292 -0.0650 -0.0143
0.0505 0.0510 0.0290 -0.0080 -0.0380 0.0166
0.1157 0.0840 0.0618 0.0148 -0.0186 0.0518
Portfolios of funds with the
highest alpha 0.1077 0.1192 0.0886 0.0786 -0.0070 0.0800
Portfolios without discrimination
by alpha 0.0409 0.0468 0.0274 -0.0081 -0.0421 0.0124
Note: the portfolios are formed through monthly selection of funds according to their alpha and coeffi cient of determination (r2),
using the Capital Asset Pricing Method as a pricing model, the Bovespa index and the Interbank Deposit Certifi cate as market returns and risk-free interest rate and 12-month moving windows. The Sharpe ratio is the ratio between the average and standard deviation for excess returns.
a: the more this is to the right, the higher the R2 of the funds; b: the lower this is, the greater the alpha of the funds.
Source: Prepared by the authors.
h e next robustness test, as previously described, concerns the pricing model used. Instead of using the CAPM, we apply the same methodology, but with the four factors FFC model, as in Amihud and Goyenko (2013). h e results were consistent and again in line with all of the previous results for excess returns, Jensen’s alpha, and Sharpe ratio. For example, the Jensen’s alpha found
in the portfolio of funds with the lowest R2 and highest
past alpha generated an average yearly alpha of 3.7%, compared with -4.6% for the portfolio of funds with the highest R2 and lowest past alpha. In fact, this value of
Table 7 Monthly based Sharpe ratios for each portfolio of funds using the Fama, French, and Carhart (FFC)model
Portfolios with lowest
R2 funds Intermediate portfolios
a Portfolios with
highest R2 funds
Portfolios without discrimination by R2
Portfolios of funds with the
lowest alpha -0.0216 -0.0134 -0.0245 -0.0525 -0.0686 -0.0375
Intermediate portfoliosb
-0.0028 0.0199 0.0351 0.0063 -0.0325 0.0051
0.0240 0.0523 0.0370 0.0214 -0.0117 0.0248
0.1061 0.0545 0.0537 0.0417 0.0131 0.0537
Portfolios of funds with the
highest alpha 0.1039 0.0811 0.0712 0.0652 0.0371 0.0727
Portfolios without discrimination
by alpha 0.0417 0.0388 0.0345 0.0156 -0.0135 0.0230
Note: coeffi cient of determination (R2) and alphas of the funds result from the linear regression using the Bovespa index and the
additional risk factors “small minus big”, “high minus low”, and “winners minus losers” of the FFC model.
a: the more this is to the right, the higher the R2 of the funds; b: the lower this is, the greater the alpha of the funds.
Source: Prepared by the authors.
6. DETERMINANTS OF THE FUNDS’ R
2As the R2 is an abstract measure, it is important to
understand which characteristics of Brazilian equity funds can indicate high and low levels of selectivity (according to the R2). For this, as Amihud and Goyenko (2013)
elaborated in the US market, regressions were carried
out with panel data using a logarithmic transformation of this measure (which we will call TR2) as the dependent
variable. h e TR2 has a symmetrical distribution, works
better than the R2, and is calculated in accordance with
equation 3.
TR
2= log [ (
ξ
R
2
+ c ) / ( 1 -
ξ
R
2
+ c ) ]
in which c = 0.5/n and n = 12, this being the size of the sample used to construct the R2 series.
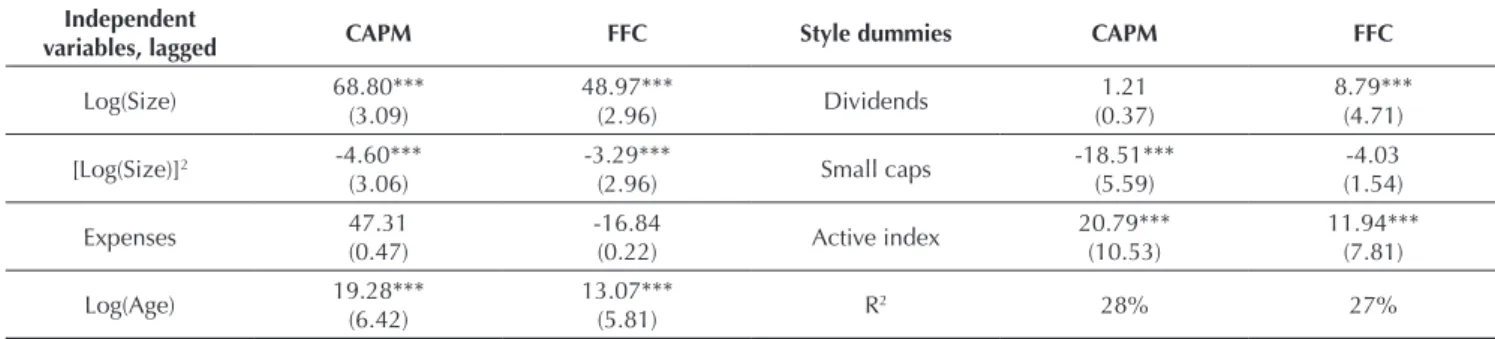
h e fund attributes used as explanatory variables in the model were size, in the logarithmic form and quadratic logarithm (to analyze curvature), expenses (measured by administration fees over net equity), style, and age (in logarithmic form). h e styles were represented by dummies identifying funds (i) focused on shares that distribute dividends, (ii) focused on small caps, and (iii) referenced to indices. Funds that do not i t into these three styles have less common actions or do not present any commitment to a specii c strategy. Age corresponds to the time in years since the fund began operations. Size is measured by fund net equity. Information related
to changes in management and fund turnover, despite being used in the US study, did not present any levels of availability, coverage, and sui cient quality in the databases used and so they were not used.
Eight 12-month windows were removed from the sample without any overlap with the funds’ TR2 at the
end of the window and their attributes at the beginning. h e regressions were carried out with errors clustered by fund and units of time, as well as containing dummies for each 12-month period. h e results from the regressions can be observed in Table 8, in which we present them both for the CAPM model and for the FFC model (as a robustness test).
Independent of the pricing model used, R2 is rising
and concave for the size variable, which is shown by the positive coei cient in the i rst degree and negative coei cient in the second (both statistically signii cant), exactly like the US market. On the other hand, the administrative expenses variable was not statistically signii cant. Age was very signii cant in both pricing models, as well as positive, which is another result that diff ered from Amihud and Goyenko (2013): new funds
tend to be more selective in Brazil.
With regards to the styles analyzed, the fact a fund is referenced indicates less selectivity, which is consistent with what is expected for an index-based fund. Funds that bet on shares with dividends present a bias for a high R2,
indicating less selectivity, and funds that invest in shares in relatively small companies have a bias for a lower R2
(negative coei cient).
7. CONCLUSION
h is paper applied, in the Brazilian equity funds market, the methodology from Amihud and Goyenko (2013) for predicting performance based on level of activity, as measured by the R2, that is, the R2 of the regression for
excess fund returns in relation with excess market returns (measured by the Ibovespa). We investigated a sample of 867 equity funds considered active over the period from November 2004 and October 2014.
As in the US market, this methodology was quite eff ective in Brazil for constructing portfolios of better performing funds. Funds with lower R2 values, identii ed as
being more selective, presented above average returns and funds with higher R2 values, or that accompanied market
performance more, had a below average performance in the period analyzed. h e portfolio of funds that recorded the highest level of activity presented an average excess return of 0.26% a month, a monthly alpha of 0.34%, and a Sharpe ratio of 0.0494. h e portfolio composed of the least selective funds presented an average excess return of -0.19%, an alpha of -0.09%, and a Sharpe ratio of -0.0314. With regards to cumulative return, the portfolio with the most selective funds presented a performance of 190%,
while the portfolio with the least selective funds, or with the lowest R2, obtained only 70%.
h is study coni rms the hypothesis that funds’ exposure to idiosyncratic risk results in better performance, even when measured by the Sharpe ratio (which adjusts exposures to diff erent levels of risk). h e results found are robust when we use the four factors FFC model instead of the traditional CAPM. h e conclusion that selectivity leads to higher returns corroborates with previous studies carried out in the Brazilian (Malacrida et al., 2007; Rochman and Eid, 2006) and international (Cremers and Petajisto, 2009; Daniel et al., 1997; Kacperczyk et al., 2005) markets. Performance was measured by excess average return, by the Jensen’s alpha, by the Sharpe ratio, and by cumulative returns. In all cases, the performance of the constructed portfolios increases gradually with a reduction in the R2 of the component funds. An additional,
but equally interesting result is that the historic alpha of the component funds also determined performance. In other words, past performance (measured by the Jensen’s alpha) indicates a higher chance of future performance. h e alpha and the R2 of the funds were, therefore, (at least
Table 8 Calculation of the coeffi cient of determination (R2) based on the funds’ attributes as independent variables - TR given by
equation 3
Independent
variables, lagged CAPM FFC Style dummies CAPM FFC
Log(Size) 68.80*** (3.09)
48.97***
(2.96) Dividends
1.21 (0.37)
8.79*** (4.71)
[Log(Size)]2 -4.60***
(3.06)
-3.29***
(2.96) Small caps
-18.51*** (5.59)
-4.03 (1.54)
Expenses 47.31
(0.47)
-16.84
(0.22) Active index
20.79*** (10.53)
11.94*** (7.81)
Log(Age) 19.28*** (6.42)
13.07***
(5.81) R2 28% 27%
Note: the coeffi cients and their respective t statistics result from the panel regressions for the transformed logarithm of the R2
of Brazilian equity funds in function of their main statistical and dynamic attributes. The R2 of the excess return for the funds is
obtained based on the Capital Asset Pricing Method (CAPM) and Fama, French, and Carhart (FFC) pricing models. ***: statistical signifi cance to 1%.
reasonable) indicators of performance and can thus be used by investors to decide which assets (more precisely, Brazilian equity funds) their resources will be allocated to (this conclusion is especially relevant for funds of funds). As a suggestion for future research, it could be investigated whether a portfolio with a low and i xed
number of low R2 and high Jensen’s alpha funds would
maintain the ei cient performance found here, in order to make it possible to build a portfolio with fewer funds and probably lower costs. Another promising idea would be to try and identify the sources of risk not captured by the CAPM that would explain the performance of these fund.
REFERENCES
Amihud, Y., & Goyenko, R. (2013). Mutual fund’s R2 as predictor of performance. Review of Financial Studies, 26, 667-694. Argolo, E. F. B., Leal, R. P. C., & Almeida, V. S. (2012). O modelo
de Fama e French é aplicável no Brasil? Rio de Janeiro, RJ: Instituto Coppead de Administração.
Associação Brasileira das Entidades dos Mercados Financeiro e de Capital. (2015). Classifi cação ANBIMA de Fundos. Retrieved from http://portal.anbima.com.br/fundos-de-investimento/ classii cacao-de-fundos/classii ca cao-anbima-de-fundos/ Pages/classii cacao.aspx.
Bellizia, N. W. (2009). Aplicação do CAPM para a determinação do custo de capital próprio no Brasil (Master’s Degree). Faculdade de Economia, Administração e Contabilidade, Universidade de São Paulo, São Paulo.
Brands, S., Brown, S. J., & Gallagher, D. R. (2005). Portfólio concentration and investment manager performance.
International Review of Finance, 4(3-4) 149-174. Carhart, M. (1997). On persistence in mutual fund returns.
Journal of Finance, 52(1), 57-82.
Castro, B. R., & Minardi, A. M. A. F. (2009). Comparação do desempenho dos fundos de ações ativos e passivos. Revista Brasileira de Finanças, 7(2), 143-161.
Cremers, M., & Petajisto A. (2009). How active is your fund manager? A new measure that predicts performance. Review of Financial Studies, 22(9), 3329-3365.
Cremers, M., Ferreira, M., Matos P., & Starks, L. (2011). h e mutual fund industry worldwide: explicit and closet indexing, fees, and performance [Working Paper]. Social Science Research Network. Retrieved from https://papers.ssrn.com/ sol3/papers.cfm?abstract_id=1830207.
Cremers, M., Petajisto, A., & Zitzewitz E. (2012). Should benchmark indices have alpha? Revisiting performance evaluation. Critical Finance Review, 2(1), 1-48.
Daniel, K., Grinblatt, M., Titman, S., & Wermers, R. (1997). Measuring mutual fund performance with characteristic-based benchmarks. Journal of Finance, 52(3), 1035-1058. Fama, E. F., & French, K. R. (1992). h e cross-section of expected
stock returns. Journal of Finance, 47(2), 427-465.
Fama, E. F., & French, K. R. (1993). Common risk factors in the returns on stocks and bonds. Journal of Financial Economics,
33(1), 3-56.
Fund management will invest for food: like books and music, the investment industry is being squeezed. (2014). The Economist. Retrieved from http://www.economist.com/news/ briei ng/21601500-books-and-music-investment-industry-being-squeezed-will-invest-food.
Jegadeesh, N., & Titman, S. (1993). Returns to buying winners and selling losers: implications for stock market ei ciency. Journal of Finance, 48(1), 65-91.
Kacperczyk, M. T., & Seru, A. (2007). Fund manager use of public information: new evidence on managerial skills. Journal of Finance, 62(2), 485-528.
Kacperczyk, M. T., Sialm, C., & Zheng, L. (2005). On industry concentration of actively managed equity mutual funds.
Journal of Finance, 60(4), 1983-2011.
Laes, M. A., & Silva, M. E. (2014). Performance of mutual equity funds in Brazil: a bootstrap analysis. Revista Economia, 15(3), 294-306.
Malacrida, M. J. C., Yamamoto, M. M., Lima, G. A. S. F., & Pimentel, R. C. (2007). Gestão ativa dos fundos de investimento: uma análise de desempenho. Anais do7º Congresso USP de Controladoria e Contabilidade, São Paulo, SP, Brazil.
Milani, B., Ceretta, P. S., Barba, F. G., & Casarin, F. (2010). Fundos de investimento brasileiros: a inl uência dos momentos superiores na avaliação de desempenho. Revista Brasileira de Gestão de Negócios, 12(36), 289-303.
Oliveira, B. G. Filho, Mussa, A., & Gouvea, M. A. (2011). Modelos de retornos esperados para fundos de investimentos de ações no mercado brasileiro: testes empíricos utilizando metodologia preditiva. Anais do XIV SEMEAD – Seminários em Administração – São Paulo, SP, Brasil.
Rao, C. R. (1973). Linear statistical inference and its applications
(2nd. ed.). New York, NY: Wiley.
Rochman, R. R., & Eid, W. Junior (2006). Fundos de investimento ativos e passivos no Brasil: comparando e determinando seus desempenhos. Anais do XXX Encontro Nacional dos Programas de Pós-Graduação em Administração, Salvador, BA, Brazil.
Santos, J. O., Famá, R., & Mussa, A. (2012). A adição do fator de risco momento ao modelo de precii cação de ativos dos três fatores de Fama & French aplicado ao mercado acionário brasileiro. Revista de Gestão REGE, 19(3), 453-472.
Correspondence address:
Marcelo dos Santos Guzella
Universidade de São Paulo, Faculdade de Economia, Administração e Contabilidade, Departamento de Contabilidade e Atuária Avenida Professor Luciano Gualberto, 908 – CEP: 05508-010