to Intracellular
Listeria monocytogenes
Nadine Gillmaier1., Andreas Go¨tz2., Anette Schulz2
, Wolfgang Eisenreich1*, Werner Goebel2*
1Lehrstuhl fu¨r Biochemie, Technische Universita¨t Mu¨nchen, Garching, Germany,2Max-von-Pettenkofer Institut, Ludwig-Maximilians-Universita¨t Mu¨nchen, Mu¨nchen, Germany
Abstract
The metabolic response of host cells, in particular of primary mammalian cells, to bacterial infections is poorly understood. Here, we compare the carbon metabolism of primary mouse macrophages and of established J774A.1 cells uponListeria monocytogenes infection using 13C-labelled glucose or glutamine as carbon tracers. The 13C-profiles of protein-derived amino acids from labelled host cells and intracellularL. monocytogenesidentified active metabolic pathways in the different cell types. In the primary cells, infection with liveL. monocytogenes increased glycolytic activity and enhanced flux of pyruvate into the TCA cycle via pyruvate dehydrogenase and pyruvate carboxylase, while in J774A.1 cells the already high glycolytic and glutaminolytic activities hardly changed upon infection. The carbon metabolism of intracellular L. monocytogeneswas similar in both host cells. Taken together, the data suggest that efficient listerial replication in the cytosol of the host cells mainly depends on the glycolytic activity of the hosts.
Citation:Gillmaier N, Go¨tz A, Schulz A, Eisenreich W, Goebel W (2012) Metabolic Responses of Primary and Transformed Cells to Intracellular Listeria monocytogenes. PLoS ONE 7(12): e52378. doi:10.1371/journal.pone.0052378
Editor:Holger Bruggemann, Aarhus University, Denmark
ReceivedJuly 20, 2012;AcceptedNovember 12, 2012;PublishedDecember 21, 2012
Copyright:ß2012 Gillmaier et al. This is an open-access article distributed under the terms of the Creative Commons Attribution License, which permits unrestricted use, distribution, and reproduction in any medium, provided the original author and source are credited.
Funding:This work was supported by the grants Go168/28-1 and EI 384/5-2 (SPP1316) from the German Research Foundation (DFG). The funders had no role in study design, data collection and analysis, decision to publish, or preparation of the manuscript.
Competing Interests:The authors have declared that no competing interests exist. * E-mail: [email protected] (WE); [email protected] (WG)
.These authors contributed equally to this work.
Introduction
Adaptation of the bacterial metabolism to their host cells is a crucial step in the replication cycle of intracellular bacterial pathogens. This important aspect of pathogenesis of intracellular bacteria has long been neglected, but has recently received increased attention (for recent reviews see [1,2,3,4]). After internalization by suitable host cells (mainly dendritic cells, macrophages and epithelial cells), these bacteria are able to actively replicate either in specialized membrane-surrounded vacuoles, e.g.Salmonella enterica, Legionella pneumophila, Mycobacterium tuberculosis, Chlamydia trachomatis, Brucella abortus, or - after escape from the primary phagosome - in the host cell’s cytosol, e.g.Shigella flexneri, Listeria monocytogenes, and Rickettsia prowazeki [5,6,7]. Whereas the latter bacteria in principle have direct access to most nutrients taken up or produced by the host cells, the necessary basic nutrients must be first transported across the impermeable vacuolar membrane before they can reach vacuole-bound bacteria. Although research on intracellular bacterial metabolism is still in its infancy, the data already available suggest that each intracellular bacterial pathogen adapts its metabolism to preferred carbon and nitrogen sources offered by the host cells, which allows not only intracellular bacterial replication but seems to optimize also the expression of virulence factors essential for the intracel-lular life cycle [2,3].
However, a possible flaw of these studies is that most of these data were obtained with established epithelial and macrophage cell lines. In contrast to the differentiated cells infected by the intracellular bacteria duringin vivoinfections, the established cell
lines (used in the above mentioned studies) are cancer cells which carry out a significantly altered metabolism. Most normal cells use the tricarboxylic acid (TCA) cycle to produce ATP in the presence of oxygen by oxidative phosphorylation (OXPHO). Although OXPHO occurring in mitochondria provides more ATP than glycolysis, the glycolytic pathway can produce ATP at a higher rate [8]. The metabolism of cancer cells is subject to the ‘‘Warburg effect’’ [9] resulting in enhanced glucose uptake and preferential glucose catabolism via glycolysis even under normoxic conditions (‘‘aerobic glycolysis’’). Pyruvate, the end product of glycolysis, is converted to lactate under these conditions. Mitochondrial conversion of pyruvate to acetyl-CoA is often strongly suppressed and the metabolic flux through the TCA cycle, as well as aerobic respiration via the electron transport chain (ETC) is inhibited [10,11]. Thus, ATP is mainly generated in cancer cells by enhanced glycolysis which favours by increased glucose uptake -fast rather than efficient energy production.
In addition, enhanced glutaminolysis, i.e. uptake and conversion of glutamine to glutamate and further toa-ketoglutarate (a-KG) in
due to the decreased formation of glucose-derived acetyl-CoA [16]. As compensation, increased citrate production by carboxyl-ation ofa-KG, catalyzed by mitochondrial isocitrate
dehydroge-nase 2 (IDH2) can occur [17].
Induction of ‘‘core’’ metabolic host cell genes may occur by the interaction with virtually all bacterial pathogens mainly via NF-kB
activation, triggered by pathogen-associated molecular patterns (PAMPs) [18,19] and by interferon-gamma (IFN-c) [20,21].
However, whether and how intracellular pathogens manipulate the host cell’s metabolism in a pathogen-specific fashion remains by and large an open, yet crucial question. The metabolism of mammalian cells is under the control of a complex regulatory network consisting of several signalling pathways that converge in the activation of several transcription factors, such as p53 [22,23], Myc [24,25] and HIF-1 [25,26]. The three regulators control (among others) the expression of multiple genes involved in the uptake and metabolism of glucose and glutamine. These transcription factors, but also amino acid sensors like mTORC1 [27] and other nutrient ‘‘transceptors’’ [28,29] controlling the host cell metabolism, and the constitutive expression and/or the altered activity of these regulatory components appear to be responsible for the metabolic deregulation of most cancer cells. These metabolic regulators may also represent potential host cell targets for the interaction with specific virulence factors and effector proteins of the bacterial pathogens and such interactions may lead to the reprogramming of the host cell metabolism.
As a first step to evaluate the need and efficiency of redistribution of resources between host cells and intracellular bacterial pathogens, we compared in this study the carbon assimilation of mouse bone marrow derived macrophages (BMM) and of macrophage-like J774A.1 cells without and with infection byL. monocytogenesusing13C-isotopologue profiling of amino acids. Primary host cells (like BMM) are of special interest in this context as they resemble more closely the target cells affected by in vivo
infections than the commonly used established cell lines (like J774A.1). Recognition of specific metabolic host targets indis-pensible for the proliferation of intracellular bacterial pathogens may also provide novel approaches for antimicrobial interventions. The data indicate that the expectedly different core carbon metabolism of the two cell types is quite differently affected by intracellular L. monocytogenes. In sharp contrast, the carbon metabolism of the intracellular bacteria is similar in both host cell types.
Results
Experimental Approach for the Determination of the Basic Carbon Metabolism in Uninfected andListeria monocytogenes-infected Primary and Transformed Murine Macrophages
13
C-Isotopologue profiling of protein-derived amino acids is a powerful technique to determine active pathways and metabolite fluxes in living cells supplied with appropriate13C-labelled carbon sources, such as glucose (reviewed in [3,30]). To study possible differences in the metabolic responses of primary and established mammalian host cells to infection by intracellular bacterial pathogens, we applied this method to uninfected and Listeria monocytogenes-infected bone marrow macrophages derived from C57BL/6 mice (in the following abbreviated BMM) and macrophage-like J774A.1 cells derived from a murine reticulum sarcoma [31].
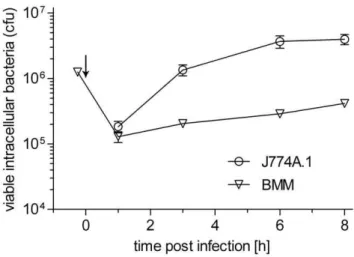
Listeria monocytogeneswas taken up by both host cell types with similar efficiency (about 5% infected cells) and escape into the cytosol occurred at similar times (latest 1 h post infection, pi). The
intracellular replication rates during the 8 h incubation period apparently differed considerably (Fig. 1). Moreover, at the time of harvest (8 h pi), the number of infected host cells increased up to 25% in J774A.1 cells, probably due to cell-to-cell spread of the intracellular listeriae, but not in BMM. This results in a 5-fold higher number of L. monocytogenes-infected J774A.1 cells (and accordingly more intracellular bacteria) in comparison with L. monocytogenes-infected BMMs. Since glucose and glutamine are the most important carbon sources for proliferating mammalian cells, uniformly 13C-labelled glucose ([U-13C6]glucose) or glutamine
([U-13C5]Gln) were used as precursors in experiments with
uninfected and infected host cells. Separation of the intracellular bacteria and the host cells was performed as described previously [32]. In both fractions, the 13C-isotopologue profiles of de novo -synthesized (hence 13C-labelled) amino acids were determined after hydrolyzing protein under acidic conditions. Since the culture medium contained all amino acids, the biosynthesis of amino acids requiring multiple enzymatic steps should be repressed under these conditions. Indeed, 13C-incorporation occurred mainly into Ala, Glu and Asp from the host cells whose production requires only transamination of specific catabolic intermediates, generated by glycolysis (Ala from pyruvate) or by the TCA cycle (Asp from oxaloacetate (OAA) and Glu froma -ketoglutarate (a-KG)). Hence, the 13C-enrichments in Ala, Asp, and Glu reflect the cellular concentrations of the respective13 C-labelled catabolic intermediates and therefore allow conclusions concerning the activity of the metabolic pathways leading to these intermediates in the uninfected and infected host cells.
Comparing the labelling profiles of amino acids from infected and uninfected host cells, metabolic changes caused by the intracellular cytosolically replicating L. monocytogenes could be identified. To specifiy the impacts due to live L. monocytogenes,
13
C-profiles of host cells treated with UV-inactivatedL. monocyto-genesor interferon-gamma (IFN-c) [33] were also determined.
Figure 1. Growth ofL. monocytogenesEGDe in BMM (triangles) and J774A.1 cells (circles). Bacterial growth was determined over a period of 8 h post infection (pi). Indicated are the colony forming units (cfu) after infection of 2x10⁵host cells with 5 bacteria per host cell. Each experiment was done three times in triplicate. Values are means6SD of one representative experiment. The generation times given in the text were calculated from time point 1h pi to 8h pi for BMM and from 1h pi to 3h pi for J774A.1 host cells. Arrow indicates addition of gentamicin.
13C-Profiles of Amino Acids from BMM Cells Cultured in
the Presence of [U-13C6]Glucose
In uninfected BMM cells, low 13C-incorporation occurred mainly into Glu and Ala, when fed with [U-13C6]glucose for 8 h
(Fig. 2A). Under these conditions, [13C3]-Ala, [13C1]-Asp, [13C1
]-and [13C2]-Glu were predominantly formed (Fig. 2C), suggesting
that [U-13C6]glucose is converted at a low rate via the glycolytic
pathway to [13C3]-pyruvate (the precursor of [13C3]-Ala), which is
further degraded by pyruvate dehydrogenase (PDH) to13CO2and
[13C2]-acetyl-CoA. The latter metabolite is channeled into the
TCA cycle and linked to unlabelled oxaloacetate (OAA – for example derived from unlabelled Gln - see below) yielding [13C2
]-a-KG, the precursor of [13C2]-Glu (flux 1 in Fig. S1). Formation of
the [13C1]-isotopologues can be explained by carbon flux via
pyruvate carboxylase (PYC) involving13CO2as a substrate (flux 2
in Fig. S1).
Infection with live (and at a lower extent by UV-inactivated)L. monocytogenesnot only caused enhanced13C-incorporation into Ala, Asp and Glu (Fig. 2A), but also changed the isotopologue pattern of Glu. Besides the major [13C2]-Glu species (formation via flux 1
in Fig. S1), [13C1]-, [13C3]-, [13C4]-, and even [13C5]-Glu were
now also formed albeit in lower amounts (Fig. 2C). The13C-a-KG precursors required for these latter Glu isotopomers can be generated by PYC- and PDH-catalyzed reactions with different combinations of labelled and unlabelled pyruvate and CO2
leading to [13C1]-, [13C3]-, [13C4]-OAA, which in combination
with [13C2]-labelled and unlabelled acetyl-CoA (derived from
unlabelled Gln - see below) result in the formation of the [13C1]-,
[13C3]-, [13C4]-, and [13C5]-a-KG precursors (flux 2 in Fig. S1).
Under infection conditions, similar amounts of [13C1]-, [13C2]-,
and [13C3]-Asp isotopologues were formed. The [13C1]- and
[13C3]-Asp isotopologues require as precursors [13C1]- and [13C3
]-OAA, respectively, which are generated by ATP-dependent pyruvate carboxylase (PYC) either from unlabelled pyruvate (derived from unlabelled Gln - see below) and 13CO2 or from
[13C3]-pyruvate and unlabelled CO2(flux 2 in Fig. S1). 13
CO2
could originate either from the13C-labelled pyruvate by PDH or from decarboxylation of [13C6]-6-phosphogluconate in the pentose
phosphate pathway. The [13C2]-OAA precursor for [13C2]-Asp is
formed in the TCA cycle by linking [13C2]-acetyl-CoA to
unlabelled OAA (again derived from Gln - see below) (flux 1 in Fig. S1). In IFN-c-activated BMM, 13C-incorporation into Glu, Asp and Ala slightly increased as compared to untreated BMM (Fig. 2A).
The very weakly13C-labelled amino acids Ser and Gly showed the expected [13C3]-Ser and [
13
C2]-Gly isotopologues, deriving
from the glycolytic intermediate [13C3]-3-phosphoglycerate.
Nei-ther infection of BMM by L. monocytogenes nor IFN-c activation
seem to change the rate of13C-incorporation into the latter amino acids in BMM.
Together, the data show that BMM cells exhibit low metabolic activity, but viableL. monocytogenes(and to a lesser extent IFN-cand
UV-inactivated bacteria) enhance glycolysis leading to an increased level of labelled pyruvate, which is channeled at increased rates into the TCA cycle via the PDH- and PYC-generated intermediates.
13C-Profiles of Amino Acids from J774A.1 Cells Cultured
in the Presence of [U-13C6]Glucose
Uninfected J774A.1 cells grown in the presence of [U-13C6
]glu-cose showed much higher 13C-incorporation into Glu, Ala and Asp (up to 5-fold depending on the amino acid) than BMM (Fig. 2B). 13C-Incorporation into Glu, Asp and Ala significantly
decreased in IFN-c-treated cells and slightly decreased upon
infection with liveL. monocytogenes, but not with UV-inactivatedL. monocytogenes(Fig. 2B). This is in sharp contrast to13
C-incorpora-tion into the same amino acids from BMM host cells, where infection withL. monocytogenesleads to a considerable increase. This suggests the presence of a highly active glucose-derived metabolite flux through the glycolytic pathway already in the uninfected J774A.1 cells and at least through those steps of the TCA cycle, which are necessary for the generation of OAA anda-KG, the intermediates for Asp and Glu. This flux is in contrast to BMM -not further activated by theL. monocytogenes infection. The13 C-incorporation into Ser and Gly from uninfected and infected J774A.1 cells was as low as in BMM cells (Fig. 2B).
Other than in BMM, the isotopologue distribution of J774A.1 amino acids did not significantly change upon infection with live or killedL. monocytogenesor by treatment with IFN-c. Notably, the
13
C-isotopologue patterns of Ala, Asp and Glu from uninfected J774A.1 were quite similar to those fromL. monocytogenes-infected BMM cells (Fig. 2D), arguing for the generation of these isotopologues by similar pathways in both cases (see above and Fig. S1). Thus, the high level of [13C3]-Ala (deriving from [
13
C3
]-pyruvate) indicates a high metabolite flux of the added [U-13C6]glucose through the glycolytic pathway in J774A.1 cells.
The low amount of13C-labelled Ser and Gly apparently derived from the glycolytic intermediate [13C3]-3-phosphoglycerate. These
data again show that biosynthesis of amino acids that requires more than only transamination of a glycolytic or TCA interme-diate is repressed when the corresponding amino acid are externally supplied, regardless whether the carbon metabolism is low (as in BMM) or high (as in J774A.1).
Additionally and in contrast to the experiments with BMMs, lower13C-incorporation into the above mentioned amino acids was observed when IFN-c activated J774A.1 cells were used,
indicating that IFN-cactivation has a different effect on carbon metabolism in the J774A.1 tumor cell line.
In summary, the results show that the glycolytic pathway and at least thea-KG- and OAA-producing steps of the TCA cycle which
are also essential for anabolic processes (amino acid, nucleotide and lipid biosynthesis) are highly active in J774A.1 cells. L. monocytogenesinfection hardly alters these metabolic steps. 13C-Profiles of Amino Acids from BMM and J774A.1 Cells
Cultured in the Presence of [U-13C5]Glutamine
Next, BMM and J774A.1 cells without or with infection byL. monocytogeneswere supplemented with 2 mM [U-13C5]Gln. In both
host cell types, the major amount of 13C-label was found - as expected - in [U-13C5]Glu, indicating that most of the supplied
[U-13C5]Gln was directly incorporated into protein (Fig. 3).
Substantial 13C-incorporation was also found in Asp indicating that Gln is in part used for replenishing the TCA cycle to support anabolic reactions in uninfected and infected cells. Incorporation into Asp from J774A.1 cells was about 3 to 5-fold higher compared to incorporation into Asp from BMM cells (Fig. 3A and B). It can be concluded that the anaplerotic reactions via glutaminolysis were more active in J774A.1 cells.
In addition to the major [13C5]-Glu isotopologue, mainly
[13C3]-Glu and in small amounts also [13C1]- and [13C2]-Glu were
generated in BMM, as well as in J774A.1 cells. 13C-Asp
isotopologues were formed in the order
[13C4].[13C1] = [13C2].[13C3] in BMM, but in the order
[13C4].[13C3].[13C2].[13C1] in J774A.1 cells, suggesting that
infection (Figs. 3C and 3D). Activation by IFN-ccaused a slight
reduction (about 30%) of 13C-incorporation in viable J774A.1 cells, but not in BMMs.
Obviously, [13C5]-Gln is transported into the mitochondria
where it is converted to [13C5]-a-KG, [13C4]-succinate, [13C4
]-fumarate, [13C4]-malate, [13C4]-OAA and 13CO2 in the TCA
cycle, running in the canonical direction (flux 1 in Fig. S2). Unlabelled acetyl-CoA (deriving from the unlabelled glucose via glycolysis) when linked to [13C4]-OAA yields [13C3]-a-KG.
Indeed, this pathway leads to the major 13C-isotopologues of Glu ([13C5] and [13C3]) and Asp ([13C4]), suggesting that it is
mainly used in BMM and J774A.1 cells. The fluxes 2, 3 and 4 in
Fig. S2 explain the formation of the other (minor) 13C isotopologues of Glu and Asp. Of special interest is the generation of [13C3]-Asp, which is the second major13C-Asp isotopologue in
J774A.1, but not in BMM. This Asp isotopologue can be mainly generated by flux 2 shown in Fig. S2, which is initiated by the reductive carboxylation of a-KG to isocitrate catalyzed by NADPH-dependent mitochondrial isocitrate dehydrogenase (IDH2). This reverse IDH2 reaction has been demonstrated in cancer cells [17,34] and obviously also occurs in J774A.1 cells.
Small, but well reproducible13C-label was also observed in Ala, Ser and Gly from both cell types (for numerical values, see Table S1). These 13C-isotopologues were probably formed from
inter-Figure 2.13C-Profiles of amino acids from host cells cultivated in the presence of [U-13C
6]glucose.(A)13C-Excess (mol %; displayed as a color code) of amino acids derived from BMM cells; for each condition, two independent labeling experiments were performed. The color for each amino acid correlates with the mean value of three MS determinations with the same sample. (B)13C-Excess (mol %; displayed as a color code) of amino acids derived from J774A.1 cells; for each condition, two independent labeling experiments were performed. The color for each amino acid correlates with the mean value of three MS determinations with the same sample. (C) Relative isotopologue composition of amino acids derived from BMM. Colored columns indicate the % amounts of isotopologues comprising 1, 2, 3, 4, or 513C-atoms (M
+1 to M+5; left scale; * indicate values from
only one labeling experiment; otherwise, the values represent means from two labeling experiments).13C-Excess values are shown as grey columns (mol %, right scale; error bars indicate SD for two independent labeling experiments). (D) Relative isotopologue composition of amino acids derived from J774A.1 cells. Colored columns indicate the % amounts of isotopologues comprising 1, 2, 3, 4, or 513C-atoms (M
+1 to M+5; left scale; the values
represent means from two labeling experiments).13C-Excess values are shown as grey columns (mol %, right scale; means from two independent labeling experiments; error bars indicate SD for the two labeling experiments). Experiments were done with and without infection byListeria monocytogenes(L.m.) and with (+) and without (-) activation by interferon-c(IFN-c). The color maps indicate13C-excess in semi-logarithmic form to show even relatively small13C excess values; for numerical values, see also Table S1.
mediates generated by gluconeogenesis starting from [13C4]-OAA
(flux 1). Infection byL. monocytogenesagain hardly changed the rates of13C-incorporation into these amino acids in the two cell types. In summary, glutaminolytic activity in BMM cells is similarly low as the glycolytic activity. Flux through glutaminolysis remains low upon L. monocytogenes infection. In contrast, glutaminolysis is much more active in J774A.1 cells and might be even slightly inhibited by theL. monocytogenesinfection.
13C-Profiles of Amino Acids from
L. monocytogenes Replicating in BMM or J774A.1 Cells
Regardless whether the bacteria replicated in BMM or J774A.1 cells, the same bacterial amino acids (in the order Ala.Asp.Thr.Glu.Ser.Tyr.Lys.Gly) were 13C-labelled in
the presence of [U-13C6]glucose (Fig. 4A, for numerical values, see
Table S2). Even the absolute 13C-enrichment values and the isotopologue patterns (Fig. 4C) were similar in amino acids fromL. monocytogenes, irrespective of growth in BMM or J774A.1 cells. This indicates that in both host cells the same glucose-derived carbon sources were used and metabolized in a similar way by intracellular L. monocytogenes (see key reactions highlighted in orange in Fig. 5). In IFN-c-treated BMM cells, no change of the
rate of 13C-incorporation into the amino acids and of the13 C-isotopologue patterns was observed, whereas a 2-fold reduction in the rate of 13C-incorporation into the amino acids occurred in IFN-c-treated J774A.1 cells (Fig. 4A).
In the presence of [U-13C5]-Gln,L. monocytogenesreplicating in
BMM incorporated substantial amounts of [13C5]-Glu/Gln into
Figure 3.13C-Profiles of amino acids from host cells cultivated in the presence of [U-13C5]glutamine.(A)13C-Excess (mol %) of amino acids derived from BMM cells, (B)13C-Excess (mol %) of amino acids derived from J774A.1 cells, (C) Relative isotopologue composition of amino acids derived from BMM. (D) Relative isotopologue composition of amino acids derived from J774A.1 cells. For more details, see legend to Figure 2; for numerical values, see also Table S2.
Figure 4.13C-Profiles of amino acids fromListeria monocytogenesreplicating in BMM or J774A.1 host cells. (A) Experiment with [U-13C6]glucose.13C-Excess (mol %) displayed as a color map. (B) Experiment with [U-13C5]glutamine.13C-Excess (mol %) displayed as a color map. (C) Relative isotopologue compositions. Colored columns indicate the % amounts of isotopologues comprising 1, 2, 3, 4, or 513C-atoms (M+1 to M+5; left scale).13C-Excess values are shown as grey columns (mol %, right scale); for numerical values, see also Tables S1 and S2.
bacterial protein (Figs. 4B and 4C), but apparently did not metabolize [13C5]-Glu/Gln further, since no other amino acid,
except Pro which derives directly from Glu, acquired significant
13
C-label. This is not unexpected, since L. monocytogenes lacks a -ketoglutarate dehydrogenase which should be necessary for
channeling [13C5]-Glu/Gln as carbon source into the listerial
TCA cycle. L. monocytogenes replicating in J774A.1 incorporated considerably less [13C5]-Glu/Gln into protein (Fig. 4B). IFN-c
inhibited the formation of [13C5]-Glu/Gln inL. monocytogeneswhen
Figure 5. Reconstructed metabolite fluxes originating from glucose or glutamine in BMM (A) and J774A.1 cells (B) with or without infection byL. monocytogenes. Black arrows indicate glucose-derived fluxes. Line widths indicate the approximate activities through these reactions. Green arrows indicate fluxes via glutaminolysis. Red arrows display flux modulations due to infection withL. monocytogenes. Bacterial pathways are highlighted in orange. The listerial metabolism is mainly fed by host cell derived [U-13C3]glycerol (deriving from [U-13C6]glucose) and [U-13C6]glucose 6-phosphate as described before [32]. The13C-labelled intermediates for the formation of the major13C-amino acid isotopologues derive from glycolytic reactions to pyruvate which is converted by PDH to Ac-CoA. The latter intermediate is channeled into the TCA cycle yielding together with OAA citrate and further toa-KG. OAA is produced by PYC-catalyzed carboxylation of pyruvate due to the disrupted listerial TCA cycle [47] which is also the reason for the inability ofL. monocytogenesto catabolize [U-13C5]glutamine.
the bacteria replicated in J774A.1 cells, but not when they replicated in BMM cells (Figs. 4 B and 4C).
These data show that the carbon metabolism of intracellularly growing L. monocytogenes is similar in BMM and J774A.1 and mainly depends on the glycolytic activity of the host cells, while the glutaminolytic activity does not seem to affect the listerial carbon metabolism.
Discussion
Glucose and glutamine are the major carbon sources providing energy and intermediates for anabolic processes to proliferating mammalian cells via glycolysis, the pentose phosphate shunt, glutaminolysis and the TCA cycle. 13C-Isotopologue profiling using [U-13C6]glucose or
[U-13
C5]glutamine was applied to
determine the carbon pathways in primary murine bone marrow macrophages (BMM) and the established murine macrophage cell line J774A.1. The activities in the core carbon metabolism of the two cell types turned out to be quite different. Glycolytic and glutaminolytic activities were low in BMMs, but high in neoplastic J774A.1 macrophages (cf. line widths of black and green arrows in Fig. 5), which is a typical feature (‘‘Warburg effect ‘‘) of many cancer cells [11,13].
The enhanced metabolic activities in J774A.1 cells can be explained by the fact that this cell line derives from a mouse tumor expressing c-Myc constitutively [35]. This transcription factor causes up-regulation of the genes for the glucose transporter GLUT1, several glycolytic enzymes and lactate dehydrogenase (LDH-A) [25,36,37]. Myc also induces a transcriptional program that promotes glutaminolysis by increasing the level of a glutamine transporter and mitochondrial glutaminase (GLS) [38], leading to cell adaptation to glutamine as a bioenergetic substrate. Indeed, the carbon metabolism of J774A.1 cells, deduced from the 13 C-profiles of Ala, Glu and Asp, displayed the expected Myc-induced glycolytic and glutaminolytic pathways [23,24]. Interestingly, substantial reductive carboxylation of glutamine-derived a-KG
to citrate, catalyzed by the mitochondrial IDH2, occurred in J774A.1 cells, but not in BMM under any of the described experimental conditions. This reaction, running in the opposite direction to the canonical TCA cycle has also been previously observed in cancer cells [34]. It generates citrate for anaplerosis under hypoxic conditions and appears to be HIF-1-regulated under these conditions [17].
Interestingly, the metabolic patterns in J774A.1 were hardly altered by infection with live (or killed)L. monocytogenes, suggesting that the carbon metabolism of J774A.1 cells is already appropriate for efficient intracellular metabolism ofL. monocytogenes. IFN-cled to an apparent reduction of the glycolytic and the glutaminolytic activities which may be due to enhanced production of reactive oxygen species (ROS) causing reduced viability of these host cells [39].
In sharp contrast, infected BMM cells showed a strongly increased glycolytic activity (red arrows in Fig. 5) in comparison with uninfected BMM cells, whereas carbon flux via glutaminolysis remained low. Taking into consideration the relatively low portion of infected cells in the L. monocytogenes-treated BMM population (see above), the increment in metabolic induction caused by the intracellularL. monocytogenesshould be even higher than expressed by the reported experimental numbers. Activation by IFN-cor
UV-killedL. monocytogenesinduced a similar flux modulation, albeit at a considerably lower level.
The IFN-c-mediated relatively low induction may be due to
enhanced expression of inducible nitric oxide synthase (iNOS or NOS2) [40,41]. The thereby increased amount of NO activates
glucose uptake and glycolysis in macrophages and other cells [42]. Similar iNOS induction has also been shown for live and killed bacteria by PAMP-induced NF-kB activation [19] and may explain the slight increase of metabolic activity by UV-inactivated bacteria. The high induction of glycolysis in BMM observed with live L. monocytogenes requires, however, not only uptake of the listeriae (which is similar for the live and UV-inactivated L. monocytogenes), but also release of the bacteria into the host cell’s cytosol (which occurs with live but not with UV-inactivated L. monocytogenes). The thereby triggered induction of host cell glycolysis could be caused by HIF-1 activation (via stabilization of the HIF-1asubunit) and is indeed frequently observed during
infections with extra- and intracellular bacterial pathogens [43,44]. However, activated HIF-1 blocks PDH activity (through activation of PDH kinase, [45]) and thus inhibits the TCA cycle. On the other hand, the inducedde novosynthesis of Glu and Asp in BMM (particularly when infected by liveL. monocytogenes) requires active pyruvate dehydrogenase (PDH), pyruvate carboxylase (PYC), citrate synthase (CS), isocitrate dehydrogenase (probably IDH1 and IDH2), ATP-dependent citrate lyase (ACL) and malic enzyme (ME). Hence, PDH must be active in the infected BMMs which becomes particularly evident by the increased production of [13C2]-Glu as major13C-Glu isotopologue species in the infected
BMM cells when cultured in the presence of [U-13C6]glucose.
Generation of this Glu isotopologue requires [13C2]-acetyl-CoA
that can only be produced by PDH from [U-13C6]glucose-derived
[13C3]-pyruvate. Thus, HIF-1 is probably not responsible for the
highly induced glycolysis in BMMs when infected with live L. monocytogenesand it remains an intriguing question which host cell regulator is responsible for this induction and which listerial factor triggers it. Listeriolysin might be a candidate on the listerial side [46].
Notably, the carbon metabolism of the intracellular L. monocytogenes, deduced from the13C-profiles of the labelled amino acids by [U-13C6]glucose, was similar in BMM and J774A.1.
Substantial 13C-incorporation did not only occur into bacterial Ala, Glu and Asp, but also into Ser, Gly, Pro, Thr and Lys, indicating that the intracellular listeriae sense the obviously low level of these latter amino acids in the host cell cytosol, whereas the host cells sense, as expected, the high external amino acid concentrations. The bacterial carbon metabolism is apparently not influenced by the highly different efficiency of glutamine uptake and consumption by the two host cell types. This may be due to the missinga-ketoglutarate dehydrogenase [47] and the inefficient
uptake of OAA and Asp [48] intoL. monocytogenes,rendering its catabolism insensitive to glutamine. As shown previously [32], intracellularL. monocytogenesseem to prefer glycerol and glucose 6-phosphate as carbon sources provided by the host cell. Indeed, the availability of these carbon compounds depends only on the glycolytic but not on the glutaminolytic activity of host cells.
In summary, the data show that L. monocytogenes infections modifies the metabolism of primary host cells (at least of BMM) with ana prioriinadequate metabolism for listerial replication in such a way that it becomes appropriate for the intracellular metabolism of these bacteria.
Materials and Methods
Bacterial Strains, Macrophage Cells and Growth Media
glucose, 110 mg/l sodium pyruvate and supplemented with 2 mM glutamine, 10 mM HEPES, 10 mg/l recombinant murine mac-rophage colony-stimulating factor (M-CSF), 10% FCS and 5% horse serum for 8 to 10 days; fresh medium was added every 3 days. Mice were cared for in accordance with the principles outlined by the European Convention for the Protection of Vertebrate Animals Used for Experimental and Other Scientific Purposes (European Treaty Series, no. 123; http://conventions. coe.int/Treaty/en/Treaties/Html/123). All animal experiments were in compliance with the German animal protection law and were approved (permit no. 03-001/08) by the responsible Federal State authority and ethics committee. The isolation and use of mouse macrophages were approved by the responsible Federal State authority (AZ 55.2-1-54-2531.6-14-02).
Growth Conditions and Infection
L. monocytogeneswas grown in BHI at 37uC with aeritation to an OD600<1. Then, the culture was centrifuged at 7,0006gand washed two times with ice-cold PBS. Aliquots resuspended in PBS containing 20% (v/v) glycerol were frozen at -80uC and used for later infection. The differentiated mouse primary macrophages (BMM) and the J774A.1 cells were seeded in 24 hole plates at cell densities of 26105 and 16105 cells per hole, respectively, and incubated overnight to allow adherence of the macrophages. BMM and J774A.1 cells were infected withL. monocytogenesEGDe (5 bacteria per host cell) resuspended in RPMI medium with 10% FCS and 10mM recombinant human insulin to enhance glucose
uptake by BMM [49]. Infection was synchronized by centrifuga-tion at 1736gand 37uC for 5 min. After 60 min of incubation, the medium was replaced by RPMI containing additionally 50mg/ml gentamicin to kill extracellular bacteria. This was defined as time point 0 post infection (pi). Under these conditions, up to 5% of the BMM and J774A.1 cells contained intracellular bacteria. Intracellular bacterial growth was measured over a period of 8 h by lysing the cells in distilled water and counting the released viable bacteria by plating them on BHI agar plates.
13C-Labelling Experiments
26106BMM and 16106 J774A.1 cells, respectively, were seeded in culture plates (Ø 10 cm), containing medium supple-mented with unlabelled substrates, 20 ng/ml interferon-gamma (IFN-c) where indicated, and incubated for 24 h. Infection was
carried out as described above with L. monocytogenes EGDe at a MOI of 5. As controls, an equal number of host cells remained uninfected or were infected with UV-inactivatedL. monocytogenes(5 bacteria per host cell). After 30 min of gentamicin-treatment, the medium was replaced by fresh RPMI now containing additionally 10 mM [U-13C6]glucose (without unlabelled glucose, but 2 mM
unlabelled glutamine) or 2 mM [U-13C5]glutamine (no unlabelled
glutamine, but 10 mM unlabelled glucose). At 8.5 h pi, cells were washed with PBS buffer and lysed in 1 ml ice-cold distilled water containing 0.1% TritonX-100, 10 mM sodium azide, 5mg/ml tetracycline and 50mg/ml chloramphenicol for 10 min. The lysate was vigorously vortexed and the bacteria were pelleted at 25,000 6g. The bacteria-free supernatant was frozen (in liquid nitrogen). The bacterial pellet was washed with RIPA buffer [50], recentrifuged and frozen in liquid nitrogen without resuspending it.
Protein Hydrolysis and Amino Acid Derivatization
Protein-containing samples (i.e. bacteria-free supernatant or bacterial pellet, see above) were heated in 6 M HCl for 24 h at 105uC. Under these conditions, protein-derived Gln and Asn were converted into Glu and Asp, respectively. Trp and Cys were
destroyed by this treatment. HCl was evaporated under nitrogen and the pellet was dissolved in 50% acetic acid. Separation and purification of the protein-derived amino acids was performed via a cation exchange column of Dowex 50Wx8 (H+
-form, 200–400 mesh, 56100 mm), washed with water and developed with 4 M ammonium hydroxide. The eluate was dried under nitrogen, and the residue dissolved in 50ml water-free acetonitrile. A mixture of
50ml of N-(tert-butyldimethylsilyl)-N-methyl-trifluoroacetamide containing 1% tert-butyldimethylsilylchloride (Sigma) was added. The derivatization took place at 70uC for 30 min. The resulting N-(tert-butyldimethylsilyl) (TBDMS)-amino acids were then mea-sured via GC/MS. The yields of TBDMS-Arg and TBDMS-Met were low. Therefore, isotopologue data of theses amino acids are typically not listed.
Gas Chromatography/mass Spectrometry (GC/MS)
GC/MS was performed on a GC 2010 (Shimadzu, Duisburg, Germany) equipped with a fused silica capillary column (Equity TM-5; 3060.25mm film thickness; SUPELCO, Bellefonte, PA) and a quadrupol QP2010 plus detector (Shimadzu) working with electron impact ionization at 70 eV. The derivatized sample was injected in a 1:10 split mode at an interface temperature of 260uC and a helium inlet pressure of 70 kPa. The GC-column was developed at 150uC for 3 min and then with a temperature gradient of 7uC/min to a final temperature of 280uC which was held for 3 min. With a sampling rate of 0.5 s, selected ion monitoring was used. Data collection proceeded via GC/MS Solution software (Shimadzu). All samples were measured three times.13C-Excess and isotopologue abundances were calculated according to standard procedures [51,52] including: (i) determi-nation of the TBDMS-derivate spectrum of derivatized amino acids, (ii) determination of mass isotopologue distributions of labelled TBDMS-amino acids, and (iii) correction for 13 C-incorporation concerning the heavy isotope contributions due to the natural abundances in the TBDMS-moiety and the amino acid atoms. The data for listerial amino acids were normalized by subtracting the contributions from host cell protein due to minor contamination of the bacterial pellet with host cell membrane fragments.
Supporting Information
Figure S1 Reconstructed metabolic fluxes based on the
13
C-labelled amino acid isotopologues deriving from [U-13C6]glucose. Flux 1describes the formation of [13C3]-Ala,
[13C2]-Asp and [ 13
C2]-Glu isotopologues by glycolysis and the
canonical TCA cycle using unlabeled OAA (deriving from glutamine) and [13C2]-Ac-CoA from [U-13C6]-glucose. Flux 2
describes the formation of the [13C
1]-, [13C2]- and [13C3]-Glu
isotopologues and of the [13C1]-, [13C3]-, and [13C4]-Asp
isotopologues via glycolysis, PYC-derived 13C-labeled OAA intermediates and unlabeled Ac-CoA (from glutamine-derived pyruvate (Pyr). The intermediates deriving from citrate are converted to the corresponding13C-Asp and13C3-Glu
isotopolo-gues by ACL and ICD-1 and ICD-2, respectively. Intermediates predominantly deriving from13C-glucose are written in red letters, while those predominantly deriving from unlabeled glutamine are in black letters and those deriving from13C-glucose and unlabeled glutamine in green letters. The red dots indicate the number of
13
C-atoms in the respective compound. (TIF)
Figure S2 Reconstructed metabolic fluxes based on the
13
[13C3]-Glu and [13C4]-Asp via glutaminolysis, TCA cycle
reactions, and ACL-catalyzed reaction to [13C4]-OAA.
Interme-diates deriving predominantly from [U-13C5]glutamine are written
in blue letters, while those deriving predominantly from unlabelled glucose are in black letters and those deriving from [U-13C5
]glu-tamine and unlabelled glucose in green letters.Flux 2shows the formation of [13C5]-Glu and [13C3]-Asp isotopologues via
glutaminolysis, citrate production by isocitrate dehydrogenase (ICD2)-dependent carboxylation ofa-KG and citrate conversion
toa-KG and OAA by cytosolic ACL and ICD1. Intermediates
deriving predominantly from [U-13C5]glutamine are written in
blue letters, while CO2 as well as the intermediates deriving
predominantly from catabolism of unlabelled glucose are in black letters and those deriving from [U-13C5]glutamine and unlabelled
CO2are in green letters.Flux 3describes the formation of [13C2
]-Glu, [13C2]- and [13C4]-Asp isotopologues via glutaminolysis,
canonical TCA cycle reactions to [13C4]-malate, conversion to
[13C3]-pyruvate and 13CO2 generation of [13C2]-Ac-CoA by
PDH, condensation to unlabelled OAA (from unlabelled glucose) yielding [13C2]-citrate which is further converted by ACL to
[13C2]-OAA and by ICD1 to [13C2]-a-KG.Flux 4describes the
formation of [13C1]-Glu and [ 13
C1]-Asp isotopomers via
glutami-nolysis, canonical TCA reactions yielding (among other interme-diates) 13CO2which is used for PYC-catalyzed carboxylation of
unlabelled pyruvate to [13C1]-OAA, giving rise together with
unlabelled Ac-CoA (from unlabelled Glc) to [13C1]-citrate and
further to [13C1]-OAA and [13C1]-a-KG. The blue dots indicate
the number of13C-atoms in the respective compound. For further
details and abbreviations, see main text. (TIF)
Table S1 13C-Isotopologue abundance in mol% of
protein derived amino acids from experiments with uninfected and Listeria monocytogenes-infected BMM and J774A.1 macrophages with 11 mM [U-13C
6]glucose and with or without IFN-c.(I) and (II) represent two biological
experiments. Isotopologues are described by an extended binary code: 1 represents a13C-atom, 0 stands for12C, X is unknown. Y is unknown, but for a given number (outside the brackets) it represents a13C-atom. Data from host cells represent mean values of three measurements (with S.D.) of cell lysate. Data from intracellularListeria monocytogenesrepresent calculated values of the bacterial fraction (spill over factor of host cell pellet was determined as described under Methods); n.d. means not determined.
(PDF)
Table S2 13C-Isotopologue abundance in mol% of
protein derived amino acids from experiments with uninfected and Listeria monocytogenes-infected BMM and J774A.1 macrophages with 2 mM [U-13C5]glutamine and with or without IFN-c.(I) and (II) represent two biological experiments. Isotopologues are described by an extended binary code: 1 represents a13C-atom, 0 stands for12C, X is unknown. Y is unknown, but for a given number (outside the brackets) it represents a13C-atom. Data from host cells represent mean values of three measurements (with S.D.) of cell lysate. Data from intracellularListeria monocytogenesrepresent calculated values of the bacterial fraction (spill-over factor of host cell pellet was determined as described under Methods); n.d. means not determined.
(PDF)
Acknowledgments
The authors thank Hubert Hilbi for carefully reading the manuscript.
Author Contributions
Conceived and designed the experiments: WE WG. Performed the experiments: NG AG AS. Analyzed the data: NG AG WE WG. Contributed reagents/materials/analysis tools: AS. Wrote the paper: WG WE.
References
1. Mun˜oz-Elı´as EJ, McKinney JD (2006) Carbon metabolism of intracellular bacteria. Cell Microbiol 8: 10–22.
2. Poncet S, Milohanic E, Maze´ A, Nait Abdallah J, Ake´ F, et al. (2009) Correlations between carbon metabolism and virulence in bacteria. Contrib Microbiol 16: 88–102.
3. Eisenreich W, Dandekar T, Heesemann J, Goebel W (2010) Carbon metabolism of intracellular bacterial pathogens and possible links to virulence. Nat Rev Microbiol 8: 401–412.
4. Fuchs TM, Eisenreich W, Heesemann J, Goebel W (2012) Metabolic adaptation of human pathogenic and related nonpathogenic bacteria to extra- and intracellular habitats. FEMS Microbiol Rev 36: 435–462.
5. Alonso A, Garcı´a-del Portillo F (2004) Hijacking of eukaryotic functions by intracellular bacterial pathogens. Int Microbiol 7: 181–191.
6. Kumar Y, Valdivia RH (2009) Leading a sheltered life: intracellular pathogens and maintenance of vacuolar compartments. Cell Host Microbe 18: 593–601. 7. Beiting DP, Roos DS (2011) A systems biological view of intracellular pathogens.
Immunol Rev 240: 117–128.
8. Pfeiffer T, Schuster S, Bonhoeffer S (2001) Cooperation and competition in the evolution of ATP-producing pathways. Science 292: 504–507.
9. Warburg O (1956) On respiratory impairment in cancer cells. Science 124: 269– 270.
10. Yin C, Qie S, Sang N (2012) Carbon source metabolism and its regulation in cancer cells. Crit Rev Eukaryot Gene Expr 22: 17–35.
11. DeBerardinis RJ, Thompson CB (2012) Cellular metabolism and disease: what do metabolic outliers teach us? Cell 148: 1132–1144.
12. Feron O (2009) Pyruvate into lactate and back: from the Warburg effect to symbiotic energy fuel exchange in cancer cells. Radiother Oncol 92: 329–333. 13. Daye D, Wellen KE (2012) Metabolic reprogramming in cancer: Unraveling the
role of glutamine in tumorigenesis. Semin Cell Dev Biol 23 : 362–369. 14. DeBerardinis RJ, Mancuso A, Daikhin E, Nissim I, Yudkoff M, et al. (2007)
Beyond aerobic glycolysis: transformed cells can engage in glutamine metabolism that exceeds the requirement for protein and nucleotide synthesis. Proc Natl Acad Sci U S A 104: 19345–19350.
15. Cheng T, Sudderth J, Yang C, Mullen AR, Jin ES, et al. (2011) Pyruvate carboxylase is required for glutamine-independent growth of tumor cells. Proc Natl Acad Sci U S A 108: 8674–8679.
16. Moreno-Sa´nchez R, Rodrı´guez-Enrı´quez S, Marı´n-Herna´ndez A, Saavedra E (2007) Energy metabolism in tumor cells. FEBS J 274: 1393–1418.
17. Wise DR, Ward PS, Shay JE, Cross JR, Gruber JJ, et al. (2011) Hypoxia promotes isocitrate dehydrogenase-dependent carboxylation ofa-ketoglutarate to citrate to support cell growth and viability. Proc Natl Acad Sci U S A 108: 19611–19616.
18. Boldrick JC, Alizadeh AA, Diehn M, Dudoit S, Liu CL, et al. (2002) Stereotyped and specific gene expression programs in human innate immune responses to bacteria. Proc Natl Acad Sci U S A 99: 972–977.
19. Nau GJ, Richmond JF, Schlesinger A, Jennings EG, Lander ES, et al. (2002) Human macrophage activation programs induced by bacterial pathogens. Proc Natl Acad Sci U S A 99: 1503–1508.
20. Schroder K, Hertzog PJ, Ravasi T, Hume DA (2004) Interferon-gamma: an overview of signals, mechanisms and functions. J Leukoc Biol 75: 163–189. 21. Schroder K, Sweet MJ, Hume DA (2006) Signal integration between IFN
gamma and TLR signalling pathways in macrophages. Immunobiol 211: 511– 524.
22. Puzio-Kuter AM (2011) The role of p53 in metabolic regulation. Genes Cancer 2: 385–391.
23. Maddocks OD, Vousden KH (2011) Metabolic regulation by p53. J Mol Med 89: 237–245.
24. Gordan JD, Thompson CB, Simon MC (2007) HIF and c-Myc: sibling rivals for control of cancer cell metabolism and proliferation. Cancer Cell 12: 108–113. 25. Dang CV, Le A, Gao P (2009) MYC-induced cancer cell energy metabolism and
therapeutic opportunities. Clin Cancer Res 15: 6479–6483.
26. Patiar S, Harris AL (2006) Role of hypoxia-inducible factor-1alpha as a cancer therapy target. Endocr Relat Cancer 13: S61–S75.
28. Holsbeeks I, Lagatie O, Van Nuland A, Van de Velde S, Thevelein JM (2004) The eukaryotic plasma membrane as a nutrient-sensing device. Trends Biochem Sci 29: 556–564.
29. Hyde R, Cwiklinski EL, MacAulay K, Taylor PM, Hundal HS (2007) Distinct sensor pathways in the hierarchical control of SNAT2, a putative amino acid transceptor, by amino acid availability. J Biol Chem 282: 19788–19798. 30. Zamboni N, Sauer U (2009) Novel biological insights through metabolomics and
13
C-flux analysis. Curr Opin Microbiol 12: 553–558.
31. Ralph P, Nakoinz I (1975) Phagocytosis and cytolysis by a macrophage tumour and its cloned cell line. Nature 257: 393–394.
32. Eylert E, Scha¨r J, Mertins S, Stoll R, Bacher A, et al. (2008) Carbon metabolism ofListeria monocytogenesgrowing inside macrophages. Mol Microbiol 69: 1008– 1017.
33. Boehm U, Klamp T, Groot M, Howard JC (1997) Cellular responses to interferon-gamma. Annu Rev Immunol 15: 749–795.
34. Holleran AL, Briscoe DA, Fiskum G Kelleher JK (1995) Glutamine metabolism in AS-30D hepatoma cells. Evidence for its conversion into lipids via reductive carboxylation. Mol Cell Biochem 152: 95–101.
35. Fan K, Barendsen N, Sensenbrenner L, Chen BD (1993) Deregulation of granulocyte-macrophage colony-stimulating factor (GM-CSF) receptor in murine macrophage cell line J774A.1. J Cell Physiol 154: 535–542. 36. Osthus RC, Shim H, Kim S, Li Q, Reddy R, et al. (2000) Deregulation of
glucose transporter 1 and glycolytic gene expression by c-Myc. J Biol Chem 275: 21797–21800.
37. Kim JW, Zeller KI, Wang Y, Jegga AG, Aronow BJ, et al. (2004) Evaluation of myc E-box phylogenetic footprints in glycolytic genes by chromatin immuno-precipitation assays. Mol Cell Biol 24 : 5923–5936.
38. Wise DR, DeBerardinis RJ, Mancuso A, Sayed N, Zhang XY, et al. (2008) Myc regulates a transcriptional program that stimulates mitochondrial glutaminolysis and leads to glutamine addiction. Proc Natl Acad Sci U S A 105: 18782–18787. 39. Wellen KE, Thompson CB (2011) Cellular metabolic stress: Considering how
cells respond to nutrient excess. Mol Cell 40: 323–332.
40. De Stefano D, Maiuri MC, Iovine B, Ialenti A, Bevilacqua MA, et al. (2006) The role of NF-kappaB, IRF-1, and STAT-1alpha transcription factors in the iNOS gene induction by gliadin and IFN-gamma in RAW 264.7 macrophages. J Mol Med 84: 65–67.
41. Jarasch N, Martin U, Kamphausen E, Zell R, Wutzler P, et al. (2005) Interferon-gamma-induced activation of nitric oxide-mediated antiviral activity of macrophages caused by a recombinant coxsackievirus B3. Viral Immunol 18 : 355–364.
42. Mateo RB, Reichner JS, Mastrofrancesco B, Kraft-Stolar D, Albina JE (1995) Impact of nitric oxide on macrophage glucose metabolism and glyceraldehyde-3-phosphate dehydrogenase activity. Am J Physiol 268: C669–675.
43. Hartmann H, Eltzschig HK, Wurz H, Hantke K, Rakin A, et al. (2008) Hypoxia-independent activation of HIF-1 by enterobacteriaceae and their siderophores. Gastroenterology 134 : 756–767.
44. Werth N, Beerlage C, Rosenberger C, Yazdi AS, Edelmann M, et al. (2010) Activation of hypoxia inducible factor 1 is a general phenomenon in infections with human pathogens. PLoS One 5: e11576.
45. Kim JW, Tchernyshyov I, Semenza GL, Dang CV (2006) HIF-1-mediated expression of pyruvate dehydrogenase kinase: a metabolic switch required for cellular adaptation to hypoxia. Cell Metab 3: 177–185.
46. Stavru F, Bouillaud F, Sartori A, Ricquier D, Cossart P (2011) Listeria monocytogenes transiently alters mitochondrial dynamics during infection. Proc Natl Acad Sci U S A 108: 3612–3617.
47. Eisenreich W, Slaghuis J, Laupitz R, Bussemer J, Stritzker J, et al. (2006)13 C Isotopologue perturbation studies ofListeria monocytogenescarbon metabolism and its modulation by the virulence regulator PrfA. Proc Natl Acad Sci U S A 103: 2040–2045.
48. Scha¨r J, Stoll R, Schauer K, Loeffler DI, Eylert E, et al. (2010) Pyruvate carboxylase plays a crucial role in carbon metabolism of extra- and intracellularly replicatingListeria monocytogenes. J Bacteriol 192: 1774–1784. 49. Gao D, Bailey CJ, Griffiths HR (2009) Metabolic memory effect of the saturated
fatty acid, palmitate, in monocytes. Biochem Biophys Res Comm 388: 278–282. 50. Go¨tz A, Eylert E, Eisenreich W, Goebel W (2010) Carbon metabolism of enterobacterial human pathogens growing in epithelial colorectal adenocarci-noma (Caco-2) cells. PLoS One 5: e10586.
51. Pickup JF, McPherson K (1976) Theoretical consideration in stable isotope dilution mass spectrometry for organic analysis. Analyt Chem 48: 1885–1890. 52. Lee WP, Byerley LO, Bergner EA (1991) Mass isotopologue analysis: theoretical
![Fig. S2 explain the formation of the other (minor) 13 C isotopologues of Glu and Asp. Of special interest is the generation of [ 13 C 3 ]-Asp, which is the second major 13 C-Asp isotopologue in J774A.1, but not in BMM](https://thumb-eu.123doks.com/thumbv2/123dok_br/15716944.122324/4.918.92.827.87.686/explain-formation-minor-isotopologues-special-generation-second-isotopologue.webp)

