Profiling of Both
Mycobacterium tuberculosis
and
Infected Human Dendritic Cells and Macrophages
Ludovic Tailleux1., Simon J. Waddell2., Mattia Pelizzola3., Alessandra Mortellaro3., Michael Withers4, Antoine Tanne1¤b, Paola Ricciardi Castagnoli3¤a, Brigitte Gicquel1, Neil G. Stoker4*, Philip D. Butcher2*, Maria Foti3*, Olivier Neyrolles1*¤b
1Institut Pasteur, Unit of Mycobacterial Genetics, Paris, France,2Medical Microbiology, Division of Cellular and Molecular Medicine, St. George’s University of London, London, United Kingdom, 3Department of Biotechnology and Bioscience, University of Milan-Bicocca, Milan, Italy, 4Department of Pathology and Infectious Diseases, Royal Veterinary College, London, United Kingdom
Background.Transcriptional profiling using microarrays provides a unique opportunity to decipher host pathogen cross-talk on the global level. Here, for the first time, we have been able to investigate gene expression changes in bothMycobacterium tuberculosis, a major human pathogen, and its human host cells, macrophages and dendritic cells.Methodology/Principal Findings.In addition to common responses, we could identify eukaryotic and microbial transcriptional signatures that are specific to the cell type involved in the infection process. In particularM. tuberculosisshows a marked stress response when inside dendritic cells, which is in accordance with the low permissivity of these specialized phagocytes to the tubercle bacillus and to other pathogens. In contrast, the mycobacterial transcriptome inside macrophages reflects that of replicating bacteria. On the host cell side, differential responses to infection in macrophages and dendritic cells were identified in genes involved in oxidative stress, intracellular vesicle trafficking and phagosome acidification.Conclusions/Significance.This study provides the proof of principle that probing the host and the microbe transcriptomes simultaneously is a valuable means to accessing unique information on host pathogen interactions. Our results also underline the extraordinary plasticity of host cell and pathogen responses to infection, and provide a solid framework to further understand the complex mechanisms involved in
immunity toM. tuberculosisand in mycobacterial adaptation to different intracellular environments.
Citation: Tailleux L, Waddell SJ, Pelizzola M, Mortellaro A, Withers M, et al (2008) Probing Host Pathogen Cross-Talk by Transcriptional Profiling of BothMycobacterium tuberculosisand Infected Human Dendritic Cells and Macrophages. PLoS ONE 3(1): e1403. doi:10.1371/journal.pone.0001403
INTRODUCTION
Co-evolution of microbes and the immune system has resulted in the selection of sophisticated mechanisms, which may provide advantages to the host or to the microbe, and ultimately result in resistance or susceptibility to infectious disease. The use of both human and pathogen microarrays in time-course experiments may allow the activities of host and pathogen to be measured simultaneously, and might show how gene expression changes in the host correlate with those observed in the microorganism and
vice versa. A detailed comprehension of the common responses is likely to give insight into the basic mechanisms governing host-pathogen cross-talk, whereas genes that are modulated in a cell-specific manner may provide information about cell-specific gene expression programs initiated upon pathogen encounter. These studies will ultimately allow the dissection of regulatory networks, which underlie the transcriptional response to infection [1,2,3,4]. Here we sought to use microarray technology to decipher simultaneously transcriptional changes in a human pathogen of primary public health importance,Mycobacterium tuberculosis, and in its main host cells, macrophages (Mws) and dendritic cells (DCs) throughout infection.
A major virulence feature of the tuberculosis (TB) bacillus relies on the mechanisms it has evolved to parasitize host phagocytes
[5,6]. DCs and Mws are continuously produced from common
hematopoietic stem cells within the bone marrow ; both cell types are central to anti-mycobacterial immunity and to TB pathogen-esis, yet they serve distinct roles during the infection process. While alveolar Mws act as sentinel cells by engulfing foreign inhaled particles by active phagocytosis and play a scavenger function, they are poor activators of naive T cells. In contrast, DCs are able to initiate and modulate adaptive immune responses through recognition and phagocytosis of pathogens at the sites of infection,
and through subsequent cytokine secretion and migration to the draining lymph nodes where they process and present antigens to naive lymphocytes. The outcome of host cell and mycobacterial
Academic Editor: Derya Unutmaz, New York University School of Medicine, United States of America
ReceivedOctober 22, 2007;AcceptedDecember 6, 2007;PublishedJanuary 2, 2008
Copyright:ß2008 Tailleux et al. This is an open-access article distributed under the terms of the Creative Commons Attribution License, which permits unrestricted use, distribution, and reproduction in any medium, provided the original author and source are credited.
Funding:This work was supported by a 6th Framework Programme Priority [1] grant (Molecular Markers of M. tuberculosis Early Interactions with Host Phagocytes, MM-TB, number LSHP-CT-2004-012187) from the European Commu-nity. The whole genome M. tuberculosis microarray was constructed and analysed at St George’s University of London as part of the multi-collaborative microbial pathogen microarray facility (BuG@S), for which funding from The Wellcome Trust’s Functional Genomics Resources Initiative is acknowledged (grant number 062511). P.Ricciardi-Castagnoli is a recipient of a EU M.Curie Chair Award.
Competing Interests:The authors have declared that no competing interests exist.
* To whom correspondence should be addressed.E-mail: [email protected] (NS); [email protected] (PB); [email protected] (MF); [email protected] (ON)
.These authors contributed equally to this work.
¤aCurrent address:Singapore Immunology Network (SIgN), Biomedical Sciences Institutes, Agency for Science, Technology and Research (A*STAR), IMMUNOS, Singapore, Singapore,
interactions most likely depends on differential molecular events, a snapshot of which may be measured in the changing transcrip-tional profiles of Mws and DCs, which we have investigated here. Previously, a number of important studies have been published dealing with global gene expression profiling of M. tuberculosis -infected mouse [7] or human [8,9,10,11] Mws and DCs [8], and with mycobacterial transcriptome analysis in mouse [12] or human Mws [13], or in mouse [14,15] or human [16] lung tissue samples. Here were able to compare the transcriptional responses upon mycobacterial infection both in the pathogen and in infected Mws and DCs derived from the same donors. Using microarrays designed to probe the human or the mycobacterial transcriptomes, we could follow these changes simultaneously over time-course experiments. Our results identify a core set of genes that respond similarly in Mws and DCs uponM. tuberculosisinfection, as well as cell-type specific gene expression patterns; on the microbial side,
mycobacteria exhibit both a common response to Mw and DC
infection, as well as differential responses to the two cell types. In particular, we could identify a clear mycobacterial stress response signature in DCs, which is in line with previous findings on the low replication rate of bacilli inside these cells [17]. In contrast the mycobacterial transcriptome in Mws reflects that of intracellularly replicating bacteria.
Altogether, these results highlight that global and simultaneous gene expression profiling of both the host and the pathogen is a useful means of accessing information on host pathogen interactions; our study also provides a solid framework for further understanding host pathogen interactions in TB.
RESULTS
M. tuberculosis
induces differential responses in
human M
w
s and DCs
Human monocyte-derived Mws and DCs were infected by M.
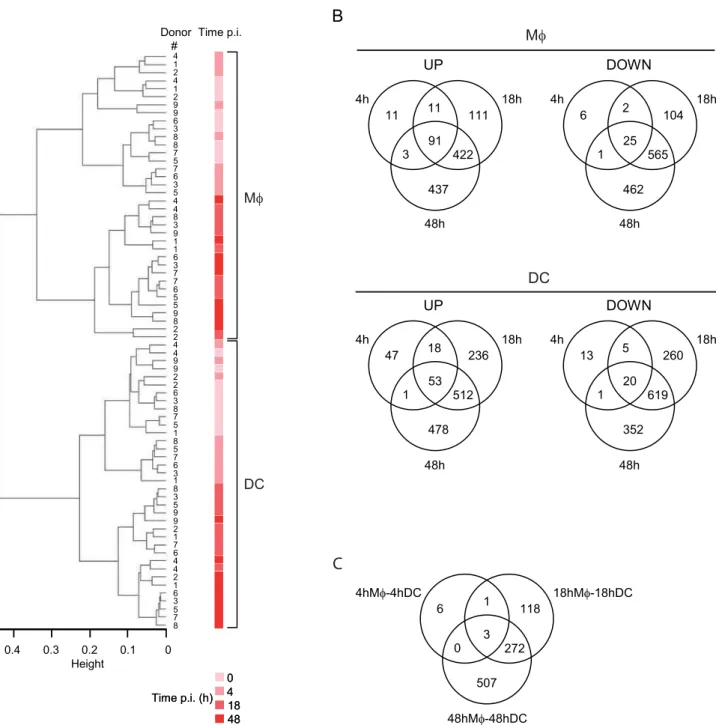
tuberculosisfor 4, 18 or 48 hours, and cellular transcriptomes were analyzed as compared to the reference transcriptome at the time of infection (time-point 0). Comprehensive gene expression profiles of 9 independent healthy donors were generated with high-density oligonucleotide human arrays with 22,283 probe sets, which in total interrogated the expression levels of approximately 18,400 transcripts and variants, including 14,500 well-characterized human genes. Using unsupervised hierarchical cluster analysis with 11,262 probe sets we identified the differences in gene expression between DCs and Mws, which readily distinguished the two groups. As shown in Figure 1A, Mws and DCs were found to group into two classes independently of the time-point and of the donor analyzed, thus identifying distinct responses to infection. Moreover, within the same cluster early (0–4 hours) and late (18– 48 hours) molecular signatures could be identified. Altogether, these results clearly show that host cell responses depend mainly on the cell type and the duration of infection, and that donor-to-donor variability only weakly influences the response profiles.
A subsequent statistical analysis was applied to select the genes associated with infection. Using the Limma Bioconductor library, 2,251 and 2,615 probe sets were found to be significantly differentially regulated in Mws and DCs respectively (Figure 1B).
The sets of genes modulated upon infection in Mws and DCs
mostly overlapped, yet Mws and DCs showed clear differences in gene regulation during infection, especially at time-points 18 h and 48 h (Figure 1C). As a validation of our data, we looked at selected examples of genes described as showing altered expression in previous studies. ThusCD1a-c,CD83, andinterleukin(IL)-12p40
were modulated in DCs only (Suppl. Figure S1), as previously shown [8,9,18,19,20]. Conversely, expression ofIL-1b and IL-6
was induced mostly in Mws, as previously reported for both mRNA and protein levels (Suppl. Figure S1 ; [18]).
Functional annotation and clustering reveal a core
response and cell type-specific signatures in
M.
tuberculosis
-infected M
w
s and DCs
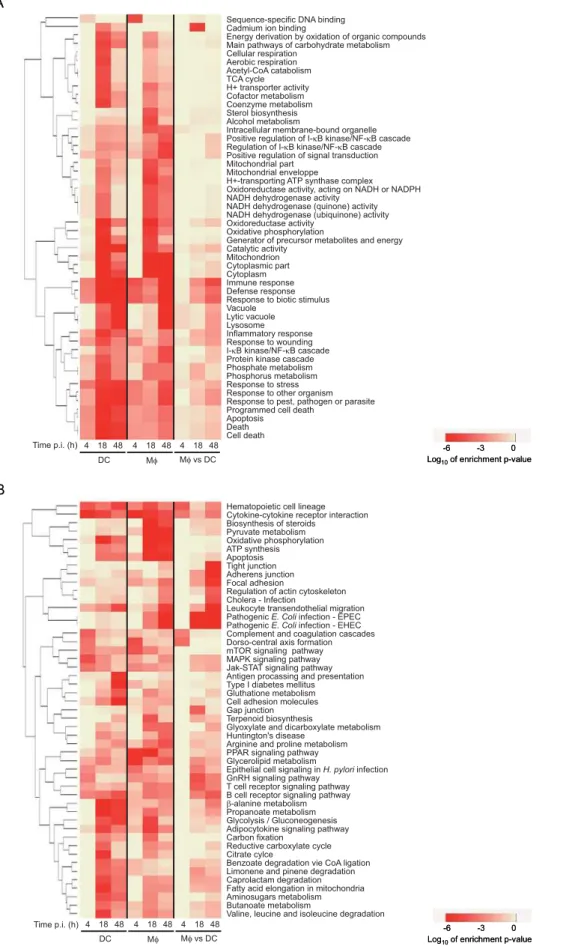
In order to gain insight into the common and differential responses of Mws and DCs toM. tuberculosisinfection, we performed gene functional classification on the basis of the annotation resources provided by GeneOntology (GO) [21] and Kyoto Encyclopedia of Genes and Genomes (KEGG) [22,23]. The annotation terms from each time point analysed were further clustered according to enrichment p-values (log10of p-value ) in a functional summary as
shown in Figure 2.
GO (Figure 2A) and KEGG (Figure 2B) annotations allowed us to identify gene families, whose expression is altered either in Mws or in DCs or in both cell types upon infection. Annotation is given accord-ing to GO and KEGG nomenclatures. For instance, differentially expressed genes (DEGs) contained in the KEGG « PathogenicE. coli
infection-EPEC » and « Pathogenic E. coli infection-EHEC »
categories include genes involved in sensing pathogens, such as
TLR4, genes involved in intracellular signalling and trafficking, such asCDC42EP3, and other genes (see the online GO and KEGG databases for further details). The common gene clusters are mostly related to basic cellular processes such as carbohydrate and pyruvate metabolism, aerobic respiration and energy production.
Importantly, cell type-specific signatures are also identified. They are mainly annotated as being involved in the response to infection, as well as in cell motility and cytoskeleton remodelling (Figure 2). In particular, hierarchical clustering of expression patterns of genes related to oxidative stress (Figure 3A), and intracellular vesicle acidification (Figure 3B) and trafficking (Figure 3C) revealed profound differences in Mwand DC responses to infection. As a selected example, the expression patterns of the small GTP-binding protein Rac isoforms 1 and 2 were the opposite in the two cell types : while Rac1 was induced in DCs and barely expressed in Mws, which was confirmed by Western blotting (Figure 4A), the Rac2 isoform was induced in Mws and not detected in DCs. Rac is part of the NADPH-dependent phagocyte oxidase (Phox), whose activity is prominently dependent on Rac2 rather than Rac1, at least in neutrophils [24,25]. Other genes encoding Phox subunits, namely
p40phox,p67phoxandgp91phoxwere found to be preferentially expressed and/or induced in Mws, as compared to in DCs, following infection (Figure 3A). Altogether, these results are in agreement with the general idea that Mws are more prone to reactive oxygen species (ROS) production than DCs [26], which might limit phagosome acidification and promote antigenic peptide presentation [27]. In line with this view, we demonstrated that Mws produce more superoxide anions, as compared to DCs, when treated with PMA or infected withM. tuberculosis, on the whole cell level (Figure 4B). In addition to its role in Phox activation, Rac acts as a molecular switch for signal transduction to regulate several cellular functions. The differential expression patterns of Rac1 and Rac2 inM. tuberculosis-infected Mws and DCs might also have important consequences on intracellular trafficking of the bacillus and on various signalling cascades.
inducesNOS2transcription and NO production [7]. Nevertheless, the roles of NO and reactive nitrogen intermediates in TB still remain to be fully elucidated [30].
Another example of differentially regulated genes, of interest in the context of M. tuberculosis infection, is the family of genes encoding the vesicular (v)-ATPase subunits (Figure 3B), as the mycobacterial phagosome has been reported to avoid fusion with v-ATPase-expressing intracellular vesicles in Mws [31,32]. The v-ATPase is composed of two main complexes, the V0 complex responsible for H+ import from the cytosol into the vesicular
lumen, and the V1 complex responsible for ATP hydrolysis. The V0 and V1 complexes are formed of 6 and 8 subunits, respectively.
The ATP6V1H gene, encoding the V1 50/57 kDa subunit, is strongly induced in Mws upon infection, whereas it is barely expressed in DCs. Overall, genes in this class were differentially regulated in Mws, but almost all were either not expressed or down-modulated in DCs. Our results suggest thatM. tuberculosis
infection induces a marked reprogramming of the v-ATPase-encoding genes in the Mw, and pinpoints a profound difference in host cell endocytic machinery response to infection between Mws and DCs. In line with this finding, we observed dramatic differences in modulation of genes encoding Rab GTPases and other modulators of intracellular trafficking in infected Mws and DCs (Figure 3C). For instanceRab9Awas found induced in DCs
A
B
4h 18h 48h 47 18 53 1 236 512 478 UP 4h 18h 48h 13 5 20 1 260 619 352 DOWNDC
4h 18h 48h 11 11 91 3 111 422 437 UP 4h 18h 48h 6 2 25 1 104 565 462 DOWNM
φ
4 1 2 4 1 2 9 9 6 3 8 8 7 5 7 6 3 5 4 4 8 3 9 1 1 6 3 7 7 6 5 5 9 8 2 2 4 4 9 9 2 2 6 3 8 7 5 1 8 5 7 6 3 1 8 3 5 9 9 2 1 7 6 4 4 2 1 6 3 5 7 8 Donor # Time p.i. 0 4 18 48 Time p.i. (h)0 4 18 48 Time p.i. (h)
DC Mφ
0.4 0.3 0.2 0.1 0 Height
0.4 0.3 0.2 0.1 0 Height 4hMφ-4hDC 18hMφ-18hDC 48hMφ-48hDC 6 1 3 0 118 272 507
C
Figure 1. Transcriptional differences betweenM. tuberculosis-infected Mws and DCs.(A) Hierarchical clustering of arrays indicating the donor# (1–9), the time of infection (0, 4, 18, 48 h) and the cell type (Mws vs DCs). (B) Venn diagrams illustrating the number of up- and down-regulated genes in Mws (upper panels) and DCs (lower panels) after 4, 18, or 48 h infection, as compared to basal expression levels at the time of infection. (C) Venn diagram showing the number of genes differently modulated in the direct comparison of Mws and DCs after 4, 18, and 48 h infection.
Sequence-specific DNA binding Cadmium ion binding
Energy derivation by oxidation of organic compounds Main pathways of carbohydrate metabolism Cellular respiration
Aerobic respiration Acetyl-CoA catabolism TCA cycle H+ transporter activity Cofactor metabolism Coenzyme metabolism Sterol biosynthesis Alcohol metabolism
Intracellular membrane-bound organelle Positive regulation of I-κB kinase/NF-κB cascade Regulation of I-κB kinase/NF-κB cascade Positive regulation of signal transduction Mitochondrial part
Mitochondrial enveloppe
H+-transporting ATP synthase complex Oxidoreductase activity, acting on NADH or NADPH NADH dehydrogenase activity
NADH dehydrogenase (quinone) activity NADH dehydrogenase (ubiquinone) activity Oxidoreductase activity
Oxidative phosphorylation
Generator of precursor metabolites and energy Catalytic activity
Mitochondrion Cytoplasmic part Cytoplasm Immune response Defense response Response to biotic stimulus Vacuole
Lytic vacuole Lysosome Inflammatory response Response to wounding I-κB kinase/NF-κB cascade Protein kinase cascade Phosphate metabolism Phosphorus metabolism Response to stress Response to other organism Response to pest, pathogen or parasite Programmed cell death
Apoptosis Death Cell death 4 18 48 4 18 48 4 18 48
DC Mφ Mφ vs DC
B
Hematopoietic cell lineage Cytokine-cytokine receptor interaction Biosynthesis of steroids
Pyruvate metabolism Oxidative phosphorylation ATP synthesis Apoptosis Tight junction Adherens junction Focal adhesion
Regulation of actin cytoskeleton Cholera - Infection
Leukocyte transendothelial migration Pathogenic E. Coli infection - EPEC Pathogenic E. Coli infection - EHEC Complement and coagulation cascades Dorso-central axis formation mTOR signaling pathway MAPK signaling pathway Jak-STAT signaling pathway Antigen procassing and presentation Type I diabetes mellitus Gluthatione metabolism Cell adhesion molecules Gap junction Terpenoid biosynthesis
Glyoxylate and dicarboxylate metabolism Huntington's disease
Arginine and proline metabolism PPAR signaling pathway Glycerolipid metabolism
Epithelial cell signaling in H. pylori infection GnRH signaling pathway
T cell receptor signaling pathway B cell receptor signaling pathway β-alanine metabolism Propanoate metabolism Glycolysis / Gluconeogenesis Adipocytokine signaling pathway Carbon fixation
Reductive carboxylate cycle Citrate cylce
Benzoate degradation vie CoA ligation Limonene and pinene degradation Caprolactam degradation Fatty acid elongation in mitochondria Aminosugars metabolism Butanoate metabolism
Valine, leucine and isoleucine degradation 4 18 48 4 18 48 4 18 48
DC Mφ Mφ vs DC
-6 -3 0 Log10of enrichment p-value
-6 -3 0 Log10of enrichment p-value
-6 -3 0 Log10of enrichment p-value
-6 -3 0 Log10of enrichment p-value
A
Time p.i. (h)
Time p.i. (h)
Figure 2. Clustering of functional categories altered in Mws and DCs uponM. tuberculosisinfection.The 50 top ranking GO (A) and KEGG (B) functional categories according to enrichment p-values of differentially expressed genes in Mws and DCs at 4, 18 and 48 h post-infection as compared to baseline levels at the time of infection, and in DCs as compared to Mws at 4, 18 and 48 h post-infection. The order of gene families was determined by hierarchical clustering. Annotation is given according to GO and KEGG nomenclatures. See the online GO and KEGG databases for further details.
r
Figure 3. Differential regulation of genes involved in oxidative stress, vacuole acidification and intracellular trafficking inM. tuberculosis-infected Mws and DCs. Red-blue display showing hierarchical clustering according to normalized expression levels of genes involved in (A) phagocyte oxidase assembly and resistance to oxidative stress, (B) v-ATPase production and phagosome acidification, (C) intracellular trafficking machinery and (D) IFN response and TLR-related pathways. Log2ratios of absolute expression values divided by the median of each gene across all
donors and conditions are reported according to the colour codes indicated. doi:10.1371/journal.pone.0001403.g003
B A
C
Rab9A
0 1 3 5
Time p.i. (days)
Mφ
DC 0,0E+00
2,0E+04 4,0E+04 6,0E+04 8,0E+04
0 2 4 6 8
Time (min)
RL
Us
(
%
t
0
)
Mφ
Mφ PMA DC PMA
0,0E+00 2,0E+02 4,0E+02 6,0E+02
0 5 10 15 20
Time (min)
RL
Us
(
%
t
0
)
Mφ
Mφ TB DC TB
Rac1
DC Mφ
Time p.i. (h) 18 48 18 48 18 48 18 48 MW (kDa) Control TB Control TB
DC Mφ
Time p.i. (h) 18 48 18 48 18 48 18 48 MW (kDa) Control TB Control TB
19 28 39 19 28 39
Mφ
DC
C
F
Us
(x10
6) / 5
0
0,000 c
e
lls
35
30
25
20
15
10
5
0
Figure 4. Validation of candidate genes and phenotypic characterization of M. tuberculosis-infected Mws and DCs. (A) Western blotting validation of selected candidate genesRac1andRab9A. Each line contains 5mg of total proteins. (B) Differential superoxide production expressed in
relative light units (RLUs) by Mws and DCs either treated with PMA (left panel), or infected withM. tuberculosis(right panel). (C) Differential multiplication ofM. tuberculosiswithin human monocyte-derived Mws and DCs.
while it was barely expressed in Mws (Figures 3C and 4A). Rab9 regulates vesicular trafficking from the trans-Golgi network (TGN) to the lysosomes through late endosomes [33] ; in particular this GTPase is required for transport of lysosomal hydrolases from the TGN to the lysosomes. The strong induction of Rab9 in DCs only likely reflects the specialized function of these cells in antigen processing and presentation and might interfere with phagosome biogenesis, which should be further investigated.
Apart from genes involved in intracellular trafficking and vesicle maturation, relevant differences between Mwand DC responses to infection were detected in genes involved in intracellular signalling, in particular in interferon (IFN) response, Toll-like receptor (TLR) signalling and related signalling pathways [34] (Figure 3D). In general, DCs were more responsive than Mws to infection, with more genes induced, such asSOCS2,ISG20,TRAF5
and IRF4 (Figure 3D). The very strong induction of SOCS2
(suppressor of cytokine signalling 2) [35,36] in DCs only, for instance, might have important consequences on the maturation and cytokine secretion profile ofM. tuberculosis-infected DCs, which should be further explored.
Together, these results reveal that human DCs and Mws
respond differently to M. tuberculosis infection and allowed us to identify gene expression signatures specific to each cell type, which opens the way for further functional studies in host cell response to intracellular infection and to the immune response to TB.
There are core and cell type-specific responses and
cell type-specific
M. tuberculosis
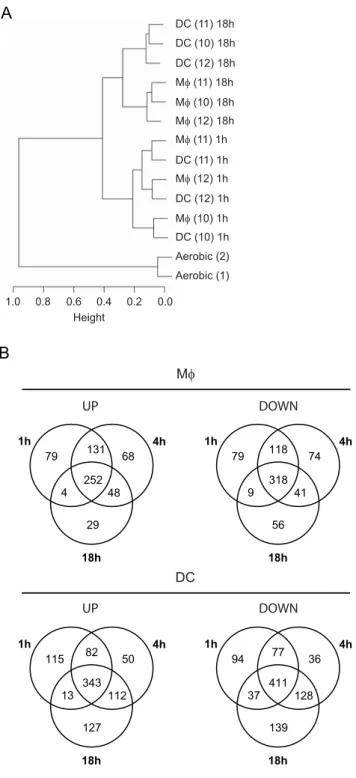
In an attempt to further decipher host cell-mycobacteria interac-tions, we analyzed the changes in the mycobacterial transcriptome during infection of human Mws and DCs. Phagocytes were derived and differentiated from monocytes of three independent healthy donors, and infected at a multiplicity of infection of 2–5 bacterium per cell for 1, 4 or 18 h. Mycobacterial RNA was extracted from infected cells using a differential lysis method previously described [12,37], and amplified using a modified Eberwine T7-based system. Hierarchical clustering of the arrays (Figure 5A) clearly showed a mycobacterial response specific to an intracellular context as compared toin vitrolog phase growth. Mycobacterial responses to DC or Mwinfection were also clearly distinguishable at the 18 h time point. This pattern reflects the changing cell-specific gene expression pattern of M. tuberculosis over time. Significantly differentially expressed genes were identified by comparing the intracellular mRNA profiles ofM. tuberculosiswith those derived from aerobically growing bacilli. The transcriptional patterns described below were also observed from infected Mws and DCs extracted from two additional healthy donors as part of a pilot project. Transcriptome modification was more pronounced inM. tuberculosis
extracted from DCs than in Mws (with 1,764 vs 1,306 genes
respectively differentially regulated relative to aerobic growth; Figure 5B). A common mycobacterial response to the two phagocytes was identified as well as cell-type specific signatures.
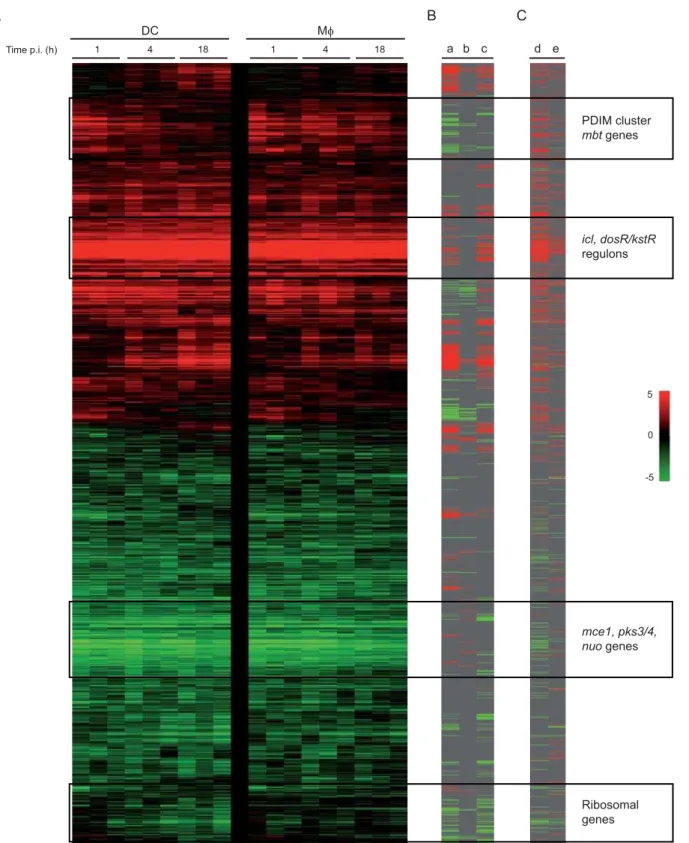
A core set of genes involved in the adaptation of bacilli to the intracellular environment and representative of thein vivophenotype ofM. tuberculosiswas observed (Figure 6), as previously reported by others [3,12,13,14,15,16]. The switch to a lipolytic lifestylein vivowas demonstrated by the induction of genes involved in theb-oxidation of fatty acids [12] (fadD3/9,fadE5/14/24/28/30/33/34,echA6/7/ 12/19/20, fadB2,fadA6), the glyoxylate shunt [38] and gluconeo-genesis (icl,gltA1,pckA), and cholesterol metabolism (42 genes from the previously defined gene cluster [39], hypergeometric probability 3.4610215). The changing respiratory state of the bacilli inside human phagocytes from aerobic to micro-aerobic or anaerobic was
exemplified by the induction of genes involved in alternative electron transfer (fdxA/C, narK2/X) and the down-regulation of the type I NADH dehydrogenases relative to aerobic log phase growth (nuoA-N) [40]. A large number of these genes are co-ordinately transcribed through thedosR/S/TandkstRregulatory systems. ThedosR/dosS
two-component system, that allows coordinated response to several
B
1h 4h
18h 115 82
343 13
50
112
127
1h 4h
18h
94 77
411 37
36
128
139 DC
UP DOWN
1h 4h
18h 79 131
252 4
68
48
29
1h 4h
18h 79 118
318 9
74
41
56 Mφ
UP DOWN
A
0.0 0.2 0.4 0.6 0.8 1.0
Height
DC (11) 18h DC (10) 18h DC (12) 18h Mφ (11) 18h Mφ (10) 18h Mφ (12) 18h Mφ (11) 1h
Mφ (12) 1h DC (11) 1h
DC (12) 1h
Aerobic (2) Aerobic (1) DC (10) 1h Mφ (10) 1h
Time p.i. (h)
DC Mφ
1 4 18 1 4 18 a b c d e
A B C
PDIM cluster
mbtgenes
icl, dosR/kstR
regulons
mce1, pks3/4, nuo genes
Ribosomal genes
5
0
-5
Figure 6. Functional and hierarchical clustering of theM. tuberculosisresponse to DCs and Mws infection.(A) Red-green display showing 1,875M. tuberculosisgenes identified to be significantly differentially expressed at 1, 4 or 18 h in Mws and DCs relative to aerobicin vitrogrowth. Genes are ordered in rows, conditions as columns. Red colouring indicates genes induced in intracellularvs.aerobic growth conditions (fold change); green colouring denotes repression. (B) Genes are highlighted that were significantly differentially regulated over time (18 hvs. 1 h) in the M. tuberculosisresponse to DCs (a) or Mws (b), red colouring identifies genes induced with time, green repressed; together with (c) those genes identified to be over-expressed (red) or under-expressed (green) after infection of DCs compared to Mws (DC18hvs. Mw18h). (C) Genes previously identified in other intracellular studies as being modulated in specific conditions are marked, namely genes induced (red colouring) or repressed (green) inside murine Mws (d) [12], and up-regulated (red) or down-regulated (green) in a hollow fibre murine model (e) [47].
stresses including O2deprivation and exposure to oxidative radicals
[41,42,43,44], was induced in both Mws and DCs. Accordingly, 45 members of thedosRregulon [45] were up-regulated intracellularly (p = 3.3610234). Similarly over half the genes of thekstRregulon, predicted to be involved in lipid degradation and cholesterol utilization, were up-regulated in both cell types compared to M. tuberculosis aerobic growth (p = 1.061029) [46]. The changing expression pattern of these two regulons over time in each infection model is depicted in Figure 7B–C. Genes involved in the
sequestration of iron (mbtB/D/E/F/I/J) were also induced.
Interestingly, several genes encoding enzymes or molecular partners involved in the synthesis of polyketides (papA1,papA3,pks2-4) were
down-regulated in both DCs and Mws. This likely reflects
reorganization of the mycobacterial cell wall during infection. Analysis of the intracellular gene expression profiles also allowed cell type-specific signatures to be identified in the mycobacterial transcriptome. Differences were in general apparent early in infection, but only became statistically significant at 18 h post-infection, when 153 and 191 genes were over-expressed in Mws
and DCs, respectively (Figures 6B & 7A). Many of the genes over-expressed in DCs were induced in both DCs and Mws relative to aerobic growth, and were thus up-regulated in DCs to a significantly greater degree than in theM. tuberculosisresponse to Mw infection. Genes over-expressed in DCs compared to Mws included many members of thedosRandkstRregulons (hypergeo-metric p-values 1.8610216and 2.4610216respectively; Figure 7B– C), genes involved in amino acid biosynthesis (argB-D, argF, and
hisC/D/F), and lipid degradation (echA19, fabD, fadA5, fadD13/19, fadE12/23/26-28/34, mmsA, mutA-B), as well as 24 genes belonging to the cholesterol catabolism gene cluster Rv3492c-Rv3574recently identified inM. tuberculosis[39]. The induction of genes in DCs compared to Mws of functional significance in nitrate respiration (narG/narK2) and in respiration in limiting O2
conditions (cydA-D) was also demonstrated. Many genes over-expressed in DCs compared to Mws have also been identified to be
induced during dormancy in vivo [47] (Figure 6C), nutrient
starvation [48], in limiting O2conditions [49] or associated with a
slowed mycobacterial growth rate [50].
Figure 7. Cell-specific responses ofM. tuberculosisto Mws and DCs.(A) The transcriptional profiles of 191 genes (red colouring) and 153 genes (green) identified to be significantly over-expressed in DCs and Mws respectively at 18 h post infection. Box plots showing the gene expression pattern (in fold change) of (B)kstRregulon [46], (C)dosRregulon [45], and (D) ribosomal gene family (functional category II.A.1 [63]), in DCs and Mws at 1, 4 and 18 h timepoints relative to aerobic growth.
Genes encoding ribosomal proteins (rplB,rplF,rplN,rpsF,rpsN; Figure 7D) and DNA biosynthesis (dnaB/N, fusA) were under-expressed in DCs compared to Mws, indicating slowed mycobac-terial replication in these cells [48]. This links with the observation that therelAgene was over-expressed in M. tuberculosisextracted from DCs compared to Mws at 18 h post-infection indicating that the stringent response may be regulated in a cell-specific manner. Many genes in the biosynthesis (papA5,ppsC,pks1,pks15,fadD22/ 29) and export (drrB-C,lppX) [51,52] of phtiocerol dimycocerosate (PDIM), a surface molecule that is important in pathogenesis, were also more weakly expressed in theM. tuberculosisresponse to DC compared to Mwinfection.
Taken together, these results suggest that DCs restrict access of intracellular mycobacteria to important nutrients, including amino acids, and indicate that the switch of mycobacterial metabolism towards fatty acid utilization as a carbon source and micro-aerobic or anaerobic respiration is even furthered inside DCs than inside Mws. Furthermore many of these cell type-specific changes in gene expression are also differentially regulated over time, with a large proportion of the genes that are over-expressed in DCsvsMws at 18 h also significantly induced in M. tuberculosis extracted from DCs at 18 h compared to 1 h post-infection (Figures 6B & 7A). We confirmed that the bacterial growth is indeed reduced in DCs (Figure 4C). Altogether, these results clearly indicate an increased mycobacterial stress response in DCs and support and extend
previous findings [17] describing the limited ability of M.
tuberculosisto multiply inside human DCs.
DISCUSSION
Here we have investigated host-pathogen cross-talk by profiling global gene expression over a time course in both the host cell and the microbe simultaneously, using M. tuberculosis-infected human
Mws and DCs as a model system. Previously, a number of
important studies have been published dealing with global host cell [7,8,9,10,11] or M. tuberculosis [12,13,14,15,16,40,48,50] gene expression profiling upon infection. This is the first time however that simultaneous host-pathogen profiles have been produced with this important pathogen. We have also used the most appropriate human cell model, and this is the first time indeed that the transcriptome ofM. tuberculosishas been described in human DCs. In addition to core responses, we have identified a number of cell type-specific signatures in both the mycobacterial and the host cell transcriptomes. This allowed us to extract information not only on the physiology of both host immune cells and intracellular bacilli during infection, but also on how intracellular mycobacteria perceive different environments, and how host cells respond differentially to intracellular infection.
Although the M. tuberculosis response to the intracellular
environment measured here reflects many features of the M.
tuberculosis in vivophenotype [12,15,16], our results clearly indicate that mycobacteria respond differently to phagocytosis by the two different phagocyte types. Transcriptome analysis indicates that the bacilli perceive the DC phagosome as a more constraining environment than the Mwphagosome, with a greater induction of stress responsive genes during DC infection. Over-expression of ribosomal genes in Mws as compared to in DCs for instance, is an indicator of active protein synthesis and likely of bacterial division. This is in accordance with our previous results showing mycobacterial growth inside human-derived Mws and mycobac-terial stasis inside human DCs [17]. The ability of DCs to control infection by intracellular pathogens seems not to be restricted to
M. tuberculosis, and has also been observed with other mycobacteria [53,54] and other bacteria [55,56,57,58]. This might represent a unique strategy evolved by DCs to cope with intracellular
pathogens and ensure their antigen presenting functions [17]. Although the stress response observed in DCs is clear, the very nature of the stress encountered by the bacilli inside these cells is not easy to identify. Possible obvious explanations include differential reactive oxygen and nitrogen species production, phagosome acidification, and/or nutrient limitation. The results obtained from both the mycobacterial and host cell transcriptomes allow us to raise and evaluate possible hypotheses.
Genes of thedosRregulon were induced in both DCs and Mws, and many of them were over-expressed in DCs. The most highly induced gene of thedosRregulon (acr1/hspX) has been implicated in actively slowing down bacterial growth [59,60], so induction of this regulon would partly explain growth limitation. The dosRSTtwo
component system responds to O2 limitation and/or to NO
[42,45,61] and our dataset allows us to look for the likely stimulus by analysing the host transcriptome. BecauseNOS2/iNOSwas not induced and NO was not detected in either cell type, it is unlikely that increased NO production explains the mycobacterial stress response observed in DCs. The possibility remains that O2might be
limiting in DCs. At the level of the host cell transcriptome, this might be reflected by the increased number of genes involved in respiration and energy production whose expression was modulated in DCs as compared to in Mws (Figure 2A). An increased O2consumption by
DCs may account for the mycobacterial phenotype inside these cells, which should be further investigated. Furthermore theM. tuberculosis aldgene is over-expressed in DCs. This gene encodes a functional alanine dehydrogenase that might be involved in NAD+
regenera-tion under low O2conditions [62]. Many of those genes that have
been identified as being up-regulated under limiting O2conditions
[49] were found to be over-expressed in DCs.
Superoxide production is another possible source of bacterial stress. The observations that several genes involved in synthesis of the phagocyte oxidase, such asgp91phox, were down-regulated in DCs upon infection, and the global superoxide production was less in DCs than in Mws, argue against this, although differential assembly of the enzyme complex at the phagosome membrane may lead to an increased O22 production locally in the mycobacterial vacuole.
Interestingly, and opposite to what is observed in Mws, infected DCs seem to preferentially synthesise Rac1 rather than Rac2. This differential synthesis of Rac isoforms may have important conse-quences on the level of superoxide production [25]. The exact topology and activity of the phagocyte oxidase at the phagosome
membrane in DCs and Mws should be further studied and
compared. In addition, 18 oxidoreductases (including adhD and
hmp) and three cytochrome P450s (cyp125/132/144) were over-expressed inM. tuberculosisextracted from DCs at 18 h compared to Mws; furthermore the functional category of I.B.7. (miscellaneous oxidoreductases and oxygenases [63] was identified to be signifi-cantly enriched (p = 1.461023). Seven of these probable oxidore-ductases were predicted to be part of thekstRregulon [46], other members of which were also identified to be over-expressed in theM. tuberculosisresponse to DCs compared to Mws infection. The cell-specific induction of these genes that may be involved in the mycobacterial response to oxidative stress may reflect the increas-ingly hostile environment encountered by bacilli inside DCs at 18 h post infection, compared to Mws.
We believe that a third possibility to explain the constrained phenotype of mycobacteria in DCsaltered phagosome acidification -is unlikely because the phagosomal lumen -is kept slightly alkaline in DCs, which allows moderate antigen degradation and proper antigen presentation [27]. We have previously reported that the mycobac-terial phagosome was not more acidic in DCs than in Mws [17].
mycobacte-rial genes involved in nutrient uptake, storage or synthesis were over-expressed in DCs. This is the case, for instance, of the glutamine uptake geneglnH, which might indicate limited mycobacterial access to iron and glutamine in DCs. Previous work has shown that some genes involved in glutamine synthesis are essentialin vitroandin vivo
[64,65,66]. A large number of genes (45) over-expressed in DCs have previously been reported to be induced in nutrient limitation conditions (e.g. pdhA/B,cysD,ald,lat, androcA/D1) [48], in addition
relA, which encodes the putative regulator of the stringent response that is induced under starvation, was also over-expressed during DC compared to Mwinfection.
In relation to nutrition, our results strongly suggest differential utilization of cholesterol by mycobacteria in DCs and Mws. Indeed, 24 genes belonging to the recently identified cholesterol catabolism gene cluster [39] were found to be significantly over-expressed in DCs ; 23 of these have been identified as part of thekstRregulon [46]. The functional characterisation of this large regulon and the role of cholesterol utilization by intracellular mycobacteria is still elusive, and requires further exploration. It is likely that KstR, a transcriptional repressor, is bound by lipid molecules (perhaps cholesterol or a cholesterol derivative), so inducing the regulon that degrades these lipids for energy and as a carbon source. Thus the fact that the regulon is activated more rapidly in DCs indicates the presence of these nutrients, and perhaps the lack of an alternative carbon source. In conclusion, our study provides a solid framework to be used to further understand host cell-mycobacteria interactions, and paves the way for a number of novel investigation questions. This unique dataset will be increasingly useful as more functional information and regulatory networks are defined, and can be interrogated as needed. Although known before that
mycobacte-rial growth is limited in DCs in comparison to Mws, the
mechanisms are not understood. Our data provide a detailed picture that will allow mechanisms to be proposed and tested. These results underline the extraordinary plasticity of the mechanisms involved in the host cell response to infection and of microbial adaptation to different intracellular environments. It is a subtle and dynamic picture that emerges. Such a fine tuning in molecular responses likely results from long periods of co-evolution ; further understanding these mechanisms should ultimately lead to novel and adapted intervention strategies to combat TB and other deadly infectious diseases.
MATERIALS AND METHODS
Bacteria, cells and infection
Human monocytes were purified from cytapheresis rings and differentiated into Mws or DCs according to a previously described procedure [17].M. tuberculosisH37Rv was grown from a frozen stock to mid-log phase in 7H9 medium (BD) supplemented with albumin-dextrose-catalase (ADC, Difco). The intact virulence of bacteria in the frozen stock was checked by infecting C57BL/6 mice intranasally with 103bacilli. After 21 and 42 days, the bacterial load in the lungs was of about 107bacteria. Cells were infected as previously described [17], at multiplicities of infection (MOI) of 5 and 2 for the 1 h and 4 h/18 h time-points, respectively, for mycobacterial RNA extrac-tion ; and at a MOI of 1 for cellular RNA extracextrac-tion. After 1, 4, 18 h and 48 h of infection, cells were recovered by centrifugation and processed for cellular or bacterial RNA extraction.
Cellular RNA extraction, preparation, and
hybridisation to the arrays
Total RNA was extracted from all 9 individual donors (corresponding to 72 samples in total) using TRIZOLH reagent (Life Technologies Inc., Carlsbad, CA) and further purified with
RNeasy columns (Qiagen, Valencia, CA), as described by the manufacturers. All sample quality was controlled strictly to verify the RNA integrity before use in microarray experiments. RNA quantity was evaluated spectrophotometrically, and the quality was assessed with the Agilent 2100 bioanalyzer (Agilent Technol-ogies Inc, Palo Alto, CA). Only samples with good RNA yield and
no RNA degradation (28S:18S.1.7 and RNA integrity
num-ber.8.5) were retained for further experiments. Labelling of samples and hybridisation to the Human U133A oligonucleotide microarray chips (Affymetrix, Santa Clara, CA) containing 22,283 probe sets were performed according to the manufacturer’s protocols. Briefly, for the microarray experiment, 10mg of total RNA was used for cRNA synthesis. cDNA was synthesizedin vitro
with the BioArray HighYield RNA Transcript Labeling kit (Enzo Life Sciences, Farmingdale, NY) with a T7-(dT)24 primer for this reaction. Biotinylated cRNA was then generated from the cDNA reaction using the BioArray High Yield RNA Transcript Kit. The
cRNA was then fragmented in fragmentation buffer (56
fragmentation buffer: 200 mM Tris-acetate, pH 8.1, 500 mM
KOAc, 150 mM MgOAc) at 94uC for 35 min before the chip
hybridisation. Fifteen micrograms of fragmented cRNA was then added to a hybridisation cocktail (0.05mg/mL fragmented cRNA, 50 pM control oligonucleotide B2, BioB, BioC, BioD, and cre hybridisation controls, 0.1 mg/mL herring sperm DNA, 0.5 mg/ mL acetylated BSA, 100 mM MES, 1 M NaCl, 20 mM EDTA, 0.01% Tween 20) and cRNA was hybridised to chips. The arrays were washed and stained with R-phycoerythrin streptavidin in the GeneChip Fluidics Station 400. The arrays were then scanned with the GeneArray Scanner. Affymetrix GeneChip Microarray Suite 5.0 software was used for washing, scanning, and basic analysis. Following scanning, array images were assessed by eye to confirm scanner alignment and the absence of significant bubbles or scratches. 39/59 ratios for glyceraldehyde-39-phosphate
dehy-drogenase (GAPDH) and b-actin were confirmed to be within
acceptable limits range from QC report, and BioB spike controls were found to be present on 100%, with BioC, BioD and CreX also present in increasing intensity. When scaled to a target intensity of 150 scaling factors for all arrays were within acceptable limits as were background, Q values and mean intensities.
Bacterial RNA extraction, preparation, and
hybridisation to the arrays
Mycobacterial RNA was extracted from infected Mws or DCs by a differential lysis procedure using the GTC/Trizol method developed by Manganet al. [12,37]. RNA was DNase-treated and purified using RNeasy columns (Qiagen), and quantified using the NanoDrop ND-1000 Spectrophotometer (NanoDrop Technologies) and Agilent 2100 Bioanalyser (Agilent Technologies). 250 ng total
M. tuberculosisRNA was amplified using an Eberwine T7-oligo-dT-based system after an initial polyadenylation step (MessageAmp II Bacteria, Ambion). Single rounds of amplification were performed, with an IVT reaction of 16 hours at 37uC. This amplification method has been previously demonstrated to be reproducible and capable of identifying representative changes in gene expression (Waddellet al. Submitted manuscript). Microarray hybridisations were conducted as previously described [67] with 5mg Cy5-labelled cDNA derived from amplifiedM. tuberculosisRNA against 2mg Cy3-labelledM. tuberculosisH37Rv genomic DNA. Mycobacterial RNA was extracted from Mws and DCs from three healthy donors at 1, 4 and 18 h post infection, and from two biological replicates of log phasein vitrogrowth, and hybridised in duplicate to aM. tuberculosis
Cellular microarray data analysis
The following analysis steps were performed using a modified version of the AMDA library [68]. Four quality checks were performed to verify the quality of sample preparation and hybridisation. These are based on the frequency of probe sets with Detection call ‘Absent’ or ‘Present’ and their associated averaged values in each sample, as well as on the ratios between the expression values for 39 and 59 end of Gapdh and Actin
transcripts. All the resulting values were in agreement with the highest Affymetrix recommended quality standards.
Probe-level background corrected expression intensities were generated starting from the image files following the Affymetrix recommendations as implemented in the GCOS software. Probeset-level were generated using the GCRMA method [69] and normalized using quantile normalization [70] at the probe level.
To filter out noisy data before the selection of differentially expressed genes, a filter was applied based on Detection calls. As a first step, probe sets called ‘Absent’ over all conditions and replicates were removed (5,792). As a second step, the 95th percentile of all the signals of the entire dataset that were flagged with an absent call was determined and used as a threshold to remove all the remaining probe sets whose expression values were always below this value in each sample (5,229). Finally 11,262 probe sets remained for the next analysis steps.
Hierarchical clustering based on complete linkage method and Pearson correlation as a similarity measure was applied to evaluate the effect of the different sources of variability (donors, time-points and host specific responses). The resulting dendrogram can be interpreted similarly to a phylogenetic tree and the vertical scale indicates 1 -Pearson correlation coefficients as a measure of similarity.
The Limma Bioconductor library developed by Gordon Smyth
et al. [71] was used for the detection of differentially expressed genes. This method is based on the fitting of a linear model to estimate the variability in the data. In case of one-channel microarray data this approach is the same as analysis of variance except that a model is fitted for every gene. A statistics of differential expression for the analysis of paired data (pairing based on donors) is used and an empirical Bayes method is applied to moderate the standard errors. Differentially expressed genes have been selected based on a threshold p-value of 1024. P-values have been corrected for multiple testing using Benjamini & Hochberg’s method to control the false discovery rate.
A functional annotation of differentially expressed genes was performed on the basis of the annotation provided by the HGU133a Bioconductor library (version 1.14.0). In particular we focused on the annotation available from Gene Ontology (GO, www.geneontology. org, [71]) and KEGG (www.genome.jp/kegg, [71]).
Only the functional categories with at least 3 differentially expressed genes have been considered. The most representative functional annotations for each experimental condition are identified using the hypergeometric distribution to determine the probability of random occurrence of functional terms (functional enrichment). Based on this probability ranking only the top 50 statistically most significant annotation terms are reported. To perform a statistical test not biased by the redundancy of the probe sets (more probe sets for the same gene), the computation of p-value of functional enrichment was based on the Entrez Gene assignment. Functional annotations have been clustered based on the Log10 of enrichment p-values of different annotation terms
across the different conditions. This plot can be useful to compare the functional characterization of differentially expressed genes in the different conditions. In particular annotation terms specific for a subset of conditions could be identified, as well as annotation terms that are equally relevant for all the conditions. Note that the
colours of such a graph (Figure 2) reflect only the enrichment p-values (highly significant is red), they are not representative of the direction of the modulation (up/down-modulated).
Bacterial microarray data analysis
The hybridised slides were scanned sequentially at 532 nm and 635 nm corresponding to Cy3 and Cy5 excitation maxima using
the Affymetrix 428TMArray Scanner (MWG). Comparative spot
intensities from the images were calculated using Imagene 5.5 (BioDiscovery) and data from multiple scans combined using MAVI 2.6.0 software (MWG Biotech AG). Data analysis was performed using functions from the Limma (linear models for microarray data analysis) software package [72]. The array data were filtered to include only cDNA elements flagged to be present on 80% of the arrays, and normalised to the 50th percentile of all remaining genes. Differentially expressed genes were identified using a ‘‘Two-Groups: Common Reference’’ experimental design. Duplicate spots within arrays and across technical replicate hybridisations (i.e.all replicate values for the same RNA sample) were averaged before performing the linear model fit. Genes with a moderated t-test p value (with Benjamini and Hochberg multiple testing correction) of,0.05 were considered to be significantly differentially expressed. These genes were hierarchically clustered using Cluster and the results displayed using Treeview software [73]. The hypergeometric distribution was used to determine if functional categories of genes were significantly enriched in the intracellular profiles [74].
Quantification of superoxide production
Superoxide production by PMA-treated orM. tuberculosis-infected
cells was quantified using the LumimaxH Superoxide Anion
Detection kit (Stratagene, La Jolla, CA) following the manufac-turer’s instructions.
Analysis of cellular gene expression with Western
blotting
Cellular proteins were quantified using the Micro BCATM kit (Pierce, Rockford, IL). For each extract analyzed, 10mg of proteins were loaded per well, and proteins were detected using anti-Rac1 (BD Biosciences, San Jose, CA) and -Rab9A (Abcam Inc., Cambridge, MA) monoclonal antibodies.
Access to microarray data
Gene regulation data for all analyzed eukaryotic genes are available in the publicly available GENOPOLIS database (https://gc-lab32. btbs.unimib.it/genopolisDB/html/users.php; login: Olivier.Neyr-olles ; password: genopolis). Fully annotated raw and filteredM. tuberculosis microarray data has been deposited in BmG@Sbase (accession number: E-BUGS-58; http://bugs.sgul.ac.uk/E-BUGS-58) and also ArrayExpress (accession number: E-BUGS-http://bugs.sgul.ac.uk/E-BUGS-58). Both
databases are MIAME compliant. Preliminary access to the M.
tuberculosis dataset is available at http://bugs.sgul.ac.uk/bugsbase using the username: journalaccount3, password: hg67Ky42B. To view microarray experiment details select E-BUGS-58 from the drop-down menu, then Find. Then click on the experiment summary tree to access protocols and raw/filtered expression data.
SUPPORTING INFORMATION
Figure S1 Mean expression levels of selected genes (in arbitrary units, a.u.) in M. tuberculosis-infected human macrophages (open circles) and dendritic cells (filled circles).
ACKNOWLEDGMENTS
M. tuberculosis genomic DNA was generously provided by Colorado State University, TB Vaccine Testing and Research Materials (HHSN266200400091C). We thank Donatella Biancolini (Genopolis, Milan, Italy) for processing the microarray experiments of infected Mws and DCs, and Ottavio Beretta and Federico Vitulli (Genopolis, Milan, Italy) for bioinformatics support. We thank Lorenz Wernisch for helpful discussions on microarray analysis methods.
Author Contributions
Conceived and designed the experiments: PB ON BG NS LT SW PR AM MF. Performed the experiments: ON LT SW AM AT. Analyzed the data: PB ON BG NS LT SW PR AM MP MW MF. Contributed reagents/ materials/analysis tools: PB ON NS LT SW AM MP MW MF. Wrote the paper: PB ON BG NS LT SW PR AM MP MF. Other: Contributed to obtaining funding: NS BG PB PR ON. Co-senior authors: MF ON.
REFERENCES
1. Ricciardi-Castagnoli P, Granucci F (2002) Opinion: Interpretation of the complexity of innate immune responses by functional genomics. Nat Rev Immunol 2: 881–889.
2. Schnappinger D, Schoolnik GK, Ehrt S (2006) Expression profiling of host pathogen interactions: howMycobacterium tuberculosisand the macrophage adapt to one another. Microbes Infect 8: 1132–1140.
3. Waddell SJ, Butcher PD (2007) Microarray analysis of whole genome expression of intracellularMycobacterium tuberculosis. Curr Mol Med 7: 287–296. 4. Waddell SJ, Butcher PD, Stoker NG (2007) RNA profiling in host-pathogen
interactions. Curr Opin Microbiol 10: 297–302.
5. Russell DG (2001)Mycobacterium tuberculosis: here today, and here tomorrow. Nat Rev Mol Cell Biol 2: 569–577.
6. Vergne I, Chua J, Singh SB, Deretic V (2004) Cell biology ofMycobacterium tuberculosisphagosome. Annu Rev Cell Dev Biol 20: 367–394.
7. Ehrt S, Schnappinger D, Bekiranov S, Drenkow J, Shi S, et al. (2001) Reprogramming of the macrophage transcriptome in response to interferon-gamma andMycobacterium tuberculosis: signaling roles of nitric oxide synthase-2 and phagocyte oxidase. J Exp Med 194: 1123–1140.
8. Chaussabel D, Semnani RT, McDowell MA, Sacks D, Sher A, et al. (2003) Unique gene expression profiles of human macrophages and dendritic cells to phylogenetically distinct parasites. Blood 102: 672–681.
9. Nau GJ, Richmond JF, Schlesinger A, Jennings EG, Lander ES, et al. (2002) Human macrophage activation programs induced by bacterial pathogens. Proc Natl Acad Sci U S A 99: 1503–1508.
10. Ragno S, Romano M, Howell S, Pappin DJ, Jenner PJ, et al. (2001) Changes in gene expression in macrophages infected with Mycobacterium tuberculosis: a combined transcriptomic and proteomic approach. Immunology 104: 99–108. 11. Wang JP, Rought SE, Corbeil J, Guiney DG (2003) Gene expression profiling
detects patterns of human macrophage responses following Mycobacterium tuberculosisinfection. FEMS Immunol Med Microbiol 39: 163–172.
12. Schnappinger D, Ehrt S, Voskuil MI, Liu Y, Mangan JA, et al. (2003) Transcriptional adaptation of Mycobacterium tuberculosis within macrophages: insights into the phagosomal environment. J Exp Med 198: 693–704. 13. Cappelli G, Volpe E, Grassi M, Liseo B, Colizzi V, et al. (2006) Profiling of
Mycobacterium tuberculosisgene expression during human macrophage infection: upregulation of the alternative sigma factor G, a group of transcriptional regulators, and proteins with unknown function. Res Microbiol 157: 445–455. 14. Talaat AM, Lyons R, Howard ST, Johnston SA (2004) The temporal expression profile ofMycobacterium tuberculosisinfection in mice. Proc Natl Acad Sci U S A 101: 4602–4607.
15. Talaat AM, Ward SK, Wu CW, Rondon E, Tavano C, et al. (2007) Mycobacterial bacilli are metabolically active during chronic tuberculosis in murine lungs: insights from genome-wide transcriptional profiling. J Bacteriol 189: 4265–4274.
16. Rachman H, Strong M, Ulrichs T, Grode L, Schuchhardt J, et al. (2006) Unique transcriptome signature ofMycobacterium tuberculosisin pulmonary tuberculosis. Infect Immun 74: 1233–1242.
17. Tailleux L, Neyrolles O, Honore-Bouakline S, Perret E, Sanchez F, et al. (2003) Constrained intracellular survival ofMycobacterium tuberculosisin human dendritic cells. J Immunol 170: 1939–1948.
18. Giacomini E, Iona E, Ferroni L, Miettinen M, Fattorini L, et al. (2001) Infection of human macrophages and dendritic cells withMycobacterium tuberculosisinduces a differential cytokine gene expression that modulates T cell response. J Immunol 166: 7033–7041.
19. Henderson RA, Watkins SC, Flynn JL (1997) Activation of human dendritic cells following infection withMycobacterium tuberculosis. J Immunol 159: 635–643. 20. Stenger S, Niazi KR, Modlin RL (1998) Down-regulation of CD1 on
antigen-presenting cells by infection withMycobacterium tuberculosis. J Immunol 161: 3582–3588.
21. Harris MA, Clark J, Ireland A, Lomax J, Ashburner M, et al. (2004) The Gene Ontology (GO) database and informatics resource. Nucleic Acids Res 32: D258–261.
22. Kanehisa M (1997) A database for post-genome analysis. Trends Genet 13: 375–376.
23. Kanehisa M, Goto S (2000) KEGG: kyoto encyclopedia of genes and genomes. Nucleic Acids Res 28: 27–30.
24. Werner E (2004) GTPases and reactive oxygen species: switches for killing and signaling. J Cell Sci 117: 143–153.
25. Yamauchi A, Marchal CC, Molitoris J, Pech N, Knaus U, et al. (2005) Rac GTPase isoform-specific regulation of NADPH oxidase and chemotaxis in
murine neutrophils in vivo. Role of the C-terminal polybasic domain. J Biol Chem 280: 953–964.
26. Werling D, Hope JC, Howard CJ, Jungi TW (2004) Differential production of cytokines, reactive oxygen and nitrogen by bovine macrophages and dendritic cells stimulated with Toll-like receptor agonists. Immunology 111: 41–52. 27. Savina A, Jancic C, Hugues S, Guermonprez P, Vargas P, et al. (2006) NOX2
controls phagosomal pH to regulate antigen processing during crosspresentation by dendritic cells. Cell 126: 205–218.
28. Nicholson S, Bonecini-Almeida Mda G, Lapa e Silva JR, Nathan C, Xie QW, et al. (1996) Inducible nitric oxide synthase in pulmonary alveolar macrophages from patients with tuberculosis. J Exp Med 183: 2293–2302.
29. Wang CH, Liu CY, Lin HC, Yu CT, Chung KF, et al. (1998) Increased exhaled nitric oxide in active pulmonary tuberculosis due to inducible NO synthase upregulation in alveolar macrophages. Eur Respir J 11: 809–815.
30. Nathan C, Shiloh MU (2000) Reactive oxygen and nitrogen intermediates in the relationship between mammalian hosts and microbial pathogens. Proc Natl Acad Sci U S A 97: 8841–8848.
31. Barker LP, George KM, Falkow S, Small PL (1997) Differential trafficking of live and deadMycobacterium marinumorganisms in macrophages. Infect Immun 65: 1497–1504.
32. Sturgill-Koszycki S, Schlesinger PH, Chakraborty P, Haddix PL, Collins HL, et al. (1994) Lack of acidification in Mycobacterium phagosomes produced by exclusion of the vesicular proton-ATPase. Science 263: 678–681.
33. Lombardi D, Soldati T, Riederer MA, Goda Y, Zerial M, et al. (1993) Rab9 functions in transport between late endosomes and the trans Golgi network. Embo J 12: 677–682.
34. Kawai T, Akira S (2006) Innate immune recognition of viral infection. Nat Immunol 7: 131–137.
35. Machado FS, Johndrow JE, Esper L, Dias A, Bafica A, et al. (2006) Anti-inflammatory actions of lipoxin A4 and aspirin-triggered lipoxin are SOCS-2 dependent. Nat Med 12: 330–334.
36. Yoshimura A, Naka T, Kubo M (2007) SOCS proteins, cytokine signalling and immune regulation. Nat Rev Immunol 7: 454–465.
37. Mangan JA, Monahan IM, Butcher PD (2002) Gene expression during host-pathogen interactions: approaches to bacterial mRNA extraction and labeling for microarray analysis. In: Wren BW, Dorrell N, eds. Methods in Microbiology. London: Academic Press.
38. McKinney JD, Honer zu Bentrup K, Munoz-Elias EJ, Miczak A, Chen B, et al. (2000) Persistence ofMycobacterium tuberculosisin macrophages and mice requires the glyoxylate shunt enzyme isocitrate lyase. Nature 406: 735–738.
39. Van der Geize R, Yam K, Heuser T, Wilbrink MH, Hara H, et al. (2007) A gene cluster encoding cholesterol catabolism in a soil actinomycete provides insight intoMycobacterium tuberculosissurvival in macrophages. Proc Natl Acad Sci U S A 104: 1947–1952.
40. Shi L, Sohaskey CD, Kana BD, Dawes S, North RJ, et al. (2005) Changes in energy metabolism ofMycobacterium tuberculosisin mouse lung and under in vitro conditions affecting aerobic respiration. Proc Natl Acad Sci U S A 102: 15629–15634.
41. Kendall SL, Movahedzadeh F, Rison SC, Wernisch L, Parish T, et al. (2004) TheMycobacterium tuberculosis dosRStwo-component system is induced by multiple stresses. Tuberculosis (Edinb) 84: 247–255.
42. Kumar A, Toledo JC, Patel RP, Lancaster JR Jr, Steyn AJ (2007)Mycobacterium tuberculosisDosS is a redox sensor and DosT is a hypoxia sensor. Proc Natl Acad Sci U S A 104: 11568–11573.
43. Ohno H, Zhu G, Mohan VP, Chu D, Kohno S, et al. (2003) The effects of reactive nitrogen intermediates on gene expression inMycobacterium tuberculosis. Cell Microbiol 5: 637–648.
44. Roberts DM, Liao RP, Wisedchaisri G, Hol WG, Sherman DR (2004) Two sensor kinases contribute to the hypoxic response ofMycobacterium tuberculosis. J Biol Chem 279: 23082–23087.
45. Park HD, Guinn KM, Harrell MI, Liao R, Voskuil MI, et al. (2003) Rv3133c/ dosR is a transcription factor that mediates the hypoxic response ofMycobacterium tuberculosis. Mol Microbiol 48: 833–843.
46. Kendall SL, Withers M, Soffair CN, Moreland NJ, Gurcha S, et al. (2007) A highly conserved transcriptional repressor controls a large regulon involved in lipid degradation inMycobacterium smegmatisandMycobacterium tuberculosis. Mol Microbiol 65: 684–699.
48. Betts JC, Lukey PT, Robb LC, McAdam RA, Duncan K (2002) Evaluation of a nutrient starvation model ofMycobacterium tuberculosispersistence by gene and protein expression profiling. Mol Microbiol 43: 717–731.
49. Bacon J, James BW, Wernisch L, Williams A, Morley KA, et al. (2004) The influence of reduced oxygen availability on pathogenicity and gene expression in
Mycobacterium tuberculosis. Tuberculosis (Edinb) 84: 205–217.
50. Beste DJ, Laing E, Bonde B, Avignone-Rossa C, Bushell ME, et al. (2007) Transcriptomic analysis identifies growth rate modulation as a component of the adaptation of mycobacteria to survival inside the macrophage. J Bacteriol 189: 3969–3976.
51. Camacho LR, Ensergueix D, Perez E, Gicquel B, Guilhot C (1999) Identification of a virulence gene cluster of Mycobacterium tuberculosis by signature-tagged transposon mutagenesis. Mol Microbiol 34: 257–267. 52. Sulzenbacher G, Canaan S, Bordat Y, Neyrolles O, Stadthagen G, et al. (2006)
LppX is a lipoprotein required for the translocation of phthiocerol dimycocer-osates to the surface ofMycobacterium tuberculosis. Embo J 25: 1436–1444. 53. Jiao X, Lo-Man R, Guermonprez P, Fiette L, Deriaud E, et al. (2002) Dendritic
cells are host cells for mycobacteria in vivo that trigger innate and acquired immunity. J Immunol 168: 1294–1301.
54. Mohagheghpour N, van Vollenhoven A, Goodman J, Bermudez LE (2000) Interaction ofMycobacterium aviumwith human monocyte-derived dendritic cells. Infect Immun 68: 5824–5829.
55. Kolb-Maurer A, Gentschev I, Fries HW, Fiedler F, Brocker EB, et al. (2000)
Listeria monocytogenes-infected human dendritic cells: uptake and host cell response. Infect Immun 68: 3680–3688.
56. Niedergang F, Sirard JC, Blanc CT, Kraehenbuhl JP (2000) Entry and survival of Salmonella typhimurium in dendritic cells and presentation of recombinant antigens do not require macrophage-specific virulence factors. Proc Natl Acad Sci U S A 97: 14650–14655.
57. Pron B, Boumaila C, Jaubert F, Berche P, Milon G, et al. (2001) Dendritic cells are early cellular targets ofListeria monocytogenesafter intestinal delivery and are involved in bacterial spread in the host. Cell Microbiol 3: 331–340. 58. Westcott MM, Henry CJ, Cook AS, Grant KW, Hiltbold EM (2007) Differential
susceptibility of bone marrow-derived dendritic cells and macrophages to productive infection withListeria monocytogenes. Cell Microbiol 9: 1397–1411. 59. Hu Y, Movahedzadeh F, Stoker NG, Coates AR (2006) Deletion of the
Mycobacterium tuberculosis alpha-crystallin-like hspX gene causes increased bacterial growthin vivo. Infect Immun 74: 861–868.
60. Yuan Y, Crane DD, Barry CE 3rd (1996) Stationary phase-associated protein expression inMycobacterium tuberculosis: function of the mycobacterial alpha-crystallin homolog. J Bacteriol 178: 4484–4492.
61. Voskuil MI, Schnappinger D, Visconti KC, Harrell MI, Dolganov GM, et al. (2003) Inhibition of respiration by nitric oxide induces aMycobacterium tuberculosis
dormancy program. J Exp Med 198: 705–713.
62. Hutter B, Dick T (1998) Increased alanine dehydrogenase activity during dormancy inMycobacterium smegmatis. FEMS Microbiol Lett 167: 7–11. 63. Cole ST, Brosch R, Parkhill J, Garnier T, Churcher C, et al. (1998) Deciphering
the biology ofMycobacterium tuberculosis from the complete genome sequence. Nature 393: 537–544.
64. Harth G, Maslesa-Galic S, Tullius MV, Horwitz MA (2005) All four
Mycobacterium tuberculosis glnAgenes encode glutamine synthetase activities but only GlnA1 is abundantly expressed and essential for bacterial homeostasis. Mol Microbiol 58: 1157–1172.
65. Parish T, Stoker NG (2000)glnEis an essential gene inMycobacterium tuberculosis. J Bacteriol 182: 5715–5720.
66. Tullius MV, Harth G, Horwitz MA (2003) Glutamine synthetase GlnA1 is essential for growth ofMycobacterium tuberculosisin human THP-1 macrophages and guinea pigs. Infect Immun 71: 3927–3936.
67. Stewart GR, Wernisch L, Stabler R, Mangan JA, Hinds J, et al. (2002) Dissection of the heat-shock response inMycobacterium tuberculosisusing mutants and microarrays. Microbiology 148: 3129–3138.
68. Pelizzola M, Pavelka N, Foti M, Ricciardi-Castagnoli P (2006) AMDA: an R package for the automated microarray data analysis. BMC Bioinformatics 7: 335.
69. Irizarry RA, Hobbs B, Collin F, Beazer-Barclay YD, Antonellis KJ, et al. (2003) Exploration, normalization, and summaries of high density oligonucleotide array probe level data. Biostatistics 4: 249–264.
70. Bolstad BM, Irizarry RA, Astrand M, Speed TP (2003) A comparison of normalization methods for high density oligonucleotide array data based on variance and bias. Bioinformatics 19: 185–193.
71. Smyth GK (2004) Linear models and empirical Bayes methods for assessing differential expression in microarray experiments. Statistical Applications in Genetics and Molecular Biology 3.
72. Smyth GK, Michaud J, Scott HS (2005) Use of within-array replicate spots for assessing differential expression in microarray experiments. Bioinformatics 21: 2067–2075.
73. Eisen MB, Spellman PT, Brown PO, Botstein D (1998) Cluster analysis and display of genome-wide expression patterns. Proc Natl Acad Sci U S A 95: 14863–14868.