and Associations with Neuroticism
Michelle Nadine Servaas1*, Harrie¨tteRiese2,3, Remco Jan Renken1, Jan-Bernard Cornelis Marsman1, Johan Lambregs1, Johan Ormel2, Andre´ Aleman1,4
1Neuroimaging Center, Department of Neuroscience, University Medical Center Groningen/University of Groningen, Groningen, The Netherlands,2Interdisciplinary Center for Psychopathology and Emotion Regulation, University Medical Center Groningen/University of Groningen, Groningen, The Netherlands,3Department of Epidemiology, University Medical Center Groningen/University of Groningen, Groningen, The Netherlands,4Department of Psychology, University of Groningen, Groningen, The Netherlands
Abstract
Neuroticism is a robust personality trait that constitutes a risk factor for psychopathology, especially anxiety disorders and depression. High neurotic individuals tend to be more self-critical and are overly sensitive to criticism by others. Hence, we used a novel resting-state paradigm to investigate the effect of criticism on functional brain connectivity and associations with neuroticism. Forty-eight participants completed the NEO Personality Inventory Revised (NEO-PI-R) to assess neuro-ticism. Next, we recorded resting state functional magnetic resonance imaging (rsfMRI) during two sessions. We mani-pulated the second session before scanning by presenting three standardized critical remarks through headphones, in which the subject was urged to please lie still in the scanner. A seed-based functional connectivity method and subsequent clustering were used to analyse the resting state data. Based on the reviewed literature related to criticism, we selected brain regions associated with self-reflective processing and stress-regulation as regions of interest. The findings showed enhanced functional connectivity between the clustered seed regions and brain areas involved in emotion processing and social cognition during the processing of criticism. Concurrently, functional connectivity was reduced between these clusters and brain structures related to the default mode network and higher-order cognitive control. Furthermore, individuals scoring higher on neuroticism showed altered functional connectivity between the clustered seed regions and brain areas involved in the appraisal, expression and regulation of negative emotions. These results may suggest that the criticized person is attempting to understand the beliefs, perceptions and feelings of the critic in order to facilitate flexible and adaptive social behavior. Furthermore, multiple aspects of emotion processing were found to be affected in individuals scoring higher on neuroticism during the processing of criticism, which may increase their sensitivity to negative social-evaluation.
Citation:Servaas MN, Riese H, Renken RJ, Marsman J-BC, Lambregs J, et al. (2013) The Effect of Criticism on Functional Brain Connectivity and Associations with Neuroticism. PLoS ONE 8(7): e69606. doi:10.1371/journal.pone.0069606
Editor:Yu-Feng Zang, Hangzhou Normal University, China
ReceivedJanuary 30, 2013;AcceptedJune 10, 2013;PublishedJuly 26, 2013
Copyright:ß2013 Servaas et al. This is an open-access article distributed under the terms of the Creative Commons Attribution License, which permits unrestricted use, distribution, and reproduction in any medium, provided the original author and source are credited.
Funding:The current study was supported by the Ministry of Education, Culture and Science of the Netherlands (609022). The funders had no role in study design, data collection and analysis, decision to publish, or preparation of the manuscript.
Competing Interests:The authors have declared that no competing interests exist. * E-mail: [email protected]
Introduction
Most people like to hear that they are performing well, both in their personal as well as their professional life. Inevitably, people’s behavior is sometimes negatively judged or criticized by others. Individual differences in stress reactivity play an important role in the way people deal with criticism and other forms of negative social-evaluation [1]. How people cope with stress is determined -among other factors- by their personality. A personality trait that has specifically been associated with stress sensitivity is neuroticism [2– 5]. Neuroticism is one of the Big Five dimensions of personality and represents a robust trait that has been replicated many times in various studies [6]. High neurotic individuals express heightened emotional reactivity, especially to negative events [7] and are more prone to develop psychiatric disorders, such as depression and anxiety disorders [8]. Moreover, these individuals tend to be more self-critical [9] and are overly sensitive to criticism by others [5].
To our knowledge, the interaction between criticism and neuroticism has not previously been studied using functional
(‘perceived criticism’). This has also been replicated in other patients samples, including anxiety disorders, schizophrenia and substance abuse disorders [13]. Individuals that score high on perceived criticism show increased limbic reactivity and decreased cognitive regulatory prefrontal activity during the processing of criticism [13].
One may conclude that criticism is a clinically relevant concept and that it is important to identify and map its underlying neurobiological mechanisms. A new challenge would be to investigate the concept of criticism in a setting, where comments are applicable to the individuals’ current situation and his or her corresponding behaviour. However, related literature on psycho-social stress has taught us that it proved to be a challenge to create a task paradigm within (i) the neuroimaging environment that is (ii) able to reliably induce a stress response and (iii) has a naturalistic character [14]. A meta-analysis on changes in cortisol -an indicator of the stress response- showed that stress could be elicited by motivated performance tasks, which contain elements of social evaluation (e.g. an evaluative audience is present) and uncontrollability (e.g. false feedback) [1]. However, a limitation of motivated performance tasks is that components related to challenge and achievement play a prominent role, which overshadow the effect of negative social-evaluation [15]. Interper-sonal stressor paradigms overcome this limitation but are still strictly virtual simulations of social situations; for example participants are deceived into believing that they are excluded from an online ball-tossing game [16].
To surpass abovementioned drawbacks, we recorded resting state fMRI (rsfMRI) during a newly constructed paradigm in which criticism on the participants’ behaviour was applicable to the current situation. The elements (negative) social-evaluation and uncontrollability, shown to be important in eliciting a stress response [1], were incorporated in the paradigm. We presented participants with three standardized critical remarks through headphones, in which the investigator urged the participant to please lie still in the scanner (independent of whether they were lying still or not). The requests were conferred with an increasingly agitated tone. Furthermore, participants were made aware before they went into the scanner that both the investigator and MRI laboratory technician were monitoring them during the experi-ment. rsfMRI provides an excellent tool to investigate undirected
behaviour in participants; it has been shown that intrinsic activity can be modulated by exogenous factors [17] but is task independent in principle.
The aim of the current study was twofold. First, we investigated which functional connectivity patterns underlie the processing of criticism, using seed-based functional connectivity and subsequent cluster analysis. Based on the reviewed literature related to criticism [1,10–12], we selected regions of interest associated with self-reflective processing: frontal, temporal, parietal and cortical midline structures (Table 1) [18] and stress regulation: the amygdala and hippocampus [19]. We hypothesized enhanced functional connectivity between selected seed regions and brain areas involved during the processing of emotions and social interaction. Second, we investigated whether neuroticism ex-plained variance within functional connectivity patterns related to criticism. We hypothesized altered functional connectivity between selected seed regions and brain areas related to emotion regulation in individuals scoring higher on neuroticism [5]. The former as well as the latter hypothesis were confirmed.
Materials and Methods
Participants
Forty-eight healthy Dutch participants (32 women, mean age 20.786SD 2.45; 16 men, mean age 20.636SD 2.16, age range: 18–27) were recruited from the University of Groningen. Participants were screened for exclusion criteria using a self-report checklist, comprising the following criteria (1) a history of seizure or head injury, (2) a life time diagnosis of psychiatric and/or neurological disorders, (3) a life time diagnosis of psychiatric disorders in first degree relatives of the participant, (4) the use of medication that can influence test results, (5) visual or auditory problems that cannot be corrected, (6) MRI incompatible implants or tattoos, (7) claustrophobia, (8) suspected or confirmed pregnancy.
Ethics statement
The Medical Ethical Committee of the University Medical Center Groningen approved the experimental protocol and written informed consent was obtained from all participants prior to participation. The study was conducted in accordance with the Declaration of Helsinki.
NEO (Neuroticism, Extraversion, Openness) Personality Inventory Revised
The NEO-PI-R [2] is based on the Five-Factor Model (FFM) of personality [20] and consists of 240 items, which assess the following five domains: Neuroticism, Extraversion, Openness, Agreeableness, and Conscientiousness. The psychometric proper-ties of the NEO-PI-R can be considered good. Cronbach’s alpha ranges from 0.86 to 0.92 for the domain scales of the Dutch version of the NEO-PI-R [21].
Stress manipulation
rsfMRI data were recorded during two sessions, each lasting five minutes. Participants were instructed to close their eyes and to not fall asleep. The first session consisted of scanning a standard resting state (standard session). The second session was manipu-lated before scanning by presenting three standardized critical remarks through headphones (criticism session). The general request addressed to the participant was to please lie still in the scanner. Participants were able to respond after each remark. The first remark: ‘‘It is important that you lie still’’ (neutral tone) was presented at time zero. The second remark: ‘‘[harrumph] Could Table 1.Seed regions associated with self-reflective
processing.
Seed region
Brodmann
area Coordinates
x y z
Anterior cingulate gyrus 32 22 42 12
Cuneus 18/23 24 264 24
Left inferior frontal gyrus, orbital part 47 238 22 212
Left insula 48 238 16 28
Left superior frontal gyrus 9 210 44 32
Left temporal pole 38 240 24 220
Superior medial frontal gyrus 9 212 45 34
Superior medial frontal gyrus 10 22 56 8 Posterior cingulate gyrus/precuneus 23/30 22 260 20
you please lie still now for a moment’’ (slightly agitated tone) was presented after the scan preparation. The third remark: ‘‘Lie still now please’’ (agitated tone) was presented after the second remark, depending on the length of the participants’ reaction to the second remark. The scan was proceeded, after the corresponding reaction to the third remark. The remarks were recorded by the investigator (J.L., male voice). In this way, participants were criticized by the person, who led the experiment. Furthermore, participants were introduced to the MRI laboratory technician, before they went into the scanner. Participants were made aware that both the investigator and MRI laboratory technician were monitoring them during the experiment. After the scanning session, participants were debriefed and informed that the repeated requests to lie still were part of the experiment. The order of the sessions was kept constant; the criticism session always followed the standard session.
To validate our stimuli, a pilot study was conducted to demonstrate that the tone of the three critical remarks was indeed perceived as increasingly agitated and that the receipt of the critical remarks was indeed experienced as negative, stressful and arousing. The results showed that the critical remarks were ranked as expected (remark 1 as least agitating and remark 3 as most agitating). Furthermore, positive affect significantly decreased (T(9)= 2.85, p,0.05) after the presentation of the critical remarks, while negative affect significantly increased (T(9)=24.59, p,0.05) (see 1. Stimulus pilot in File S1 for a full description of the pilot study).
Image acquisition
A 3 Tesla Phillips Intera scanner (Phillips Medical Systems, Best, the Netherlands), equipped with an 8-channel SENSE head coil, was used to acquire the images. A high-resolution T1-weighted 3D structural image was obtained using fast-field echo (FFE) for anatomical reference (160 slices; TR: 25 ms; TE: 25 ms; FOV: 2566204; 2566204 matrix; voxel size: 16161 mm). Functional images were acquired by T2*-weighted gradient echo planar imaging (EPI) sequences. The criticism session comprised 150 volumes in 40 axial-slices (TR: 2000 ms; TE: 25 ms; FOV: 2106210; 64666 matrix; voxel size: 3.263.262.5 mm). The standard session comprised 200 volumes – only the first 150 volumes were used for analysis – in 43 axial-slices (TR: 2290 ms; TE: 28 ms; FOV: 2206220; 64661 matrix; voxel size: 3.4463.4463 mm). Slices were acquired in an interleaved manner and oriented parallel to the AC-PC plane without gap.
Image analysis
Image processing and statistical analyses were performed using SPM8 (http://www.fil.ion.ucl.ac.uk), implemented in Matlab 7.8.0 (The Mathworks Inc.). The images were corrected for slice timing and realigned using rigid body transformations. After realignment, the mean image was coregistered to the anatomical T1 image. Subsequently, images were spatially normalized to common stereotactic space (MNI T1-template) and resampled to a voxel size of 26262 mm. Lastly, smoothing was applied using a 6 mm kernel full-width at half maximum (FWHM).
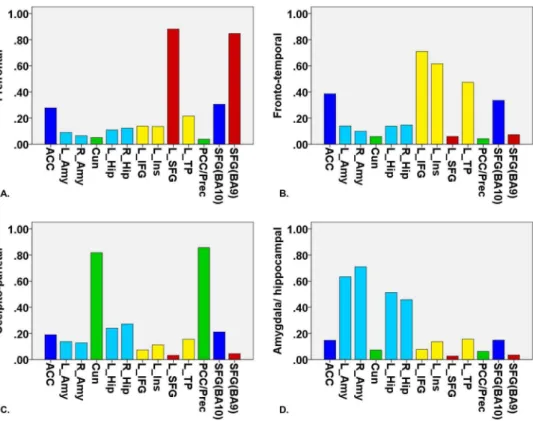
Figure 1. Four clusters were found using fuzzy c-means clustering for the contrast (criticism.standard): (A) prefrontal cluster (red bars), (B) fronto-temporal cluster (yellow bars), (C) occipito-parietal cluster (green bars) and (D) amygdala/hippocampal cluster (light blue bars).The seed regions anterior cingulate cortex and SFG(BA10) are depicted in dark blue. On the x-axis, the different seed regions can be found in alphabetical order. On the y-axis, membership degrees are continuously expressed as proximities to a cluster centroid, containing values between 0 and 1. ACC, anterior cingulate cortex; L_Amy, left amygdala; R_Amy, right amygdala; Cun, cuneus; L_Hip, left hippocampus; R_Hip, right hippocampus; L_IFG, left inferior frontal gyrus; L_Ins, left insula; L_SFG, left superior frontal gyrus; L_TP, left temporal pole; PCC/Prec, posterior cingulate cortex/precuneus; SFG(BA10), superior frontal gyrus (BA10); SFG(BA9), superior frontal gyrus (BA9).
Next, a series of preprocessing steps specific to rsfMRI analysis were performed. First, regression of several nuisance variables was applied to remove sources of spurious variance, comprising six rigid body head motion parameters, the global signal, white matter signal and cerebrospinal fluid (CSF) signal. In order to obtain the last two signals, we performed segmentation to create two separate masks and extracted the first eigenvariate from the time series of the included voxels. In addition, the first temporal derivatives of abovementioned nuisance variables were removed. Second, temporal band-pass filtering was applied to detrend the signal and to retain frequencies between 0.008 – 0.08Hz [22].
Subsequently, a seed-based functional connectivity method was used to analyse the data with a General Linear Model (GLM) [23]. A total of thirteen seed regions were defined based on the following criteria: (i) nine seed regions associated with self-reflective processing were based on a meta-analysis of neuroim-aging studies investigating self-reflection [18] (see Table 1) (ii) the bilateral amygdala and hippocampus were selected as seed regions based on a review on stress regulation in the central nervous system [19]. Next, a sphere (radius of 6 mm) was created with Marsbar [24] around the nine center coordinates, which were reported for the contrast (self.baseline) in the meta-analysis on self-reflection. The center coordinates reflect voxels with a maximum score in clusters of activation that are reported in a certain percentage of the studies, included in the meta-analysis [18]. The seed regions consisted of 123 voxels and had a volume of 984 mm3. With regard to the amygdala and hippocampus, seed regions were constructed using the WFU Pickatlas. Accordingly,
the first eigenvariate was extracted from the time series of the voxels in the thirteen specified seed regions per subject for the two sessions. This resulted in twenty-six eigenvariate time courses for every subject, thirteen for the standard session and thirteen for the criticism session. The eigenvariate time courses were added as a regressor at first level per subject for the two sessions separately and the betas were subtracted from each other (criticism .
standard). The resulting contrast images were entered in a second level random effect analysis.
For every seed region, a design was built on second level that consisted of two factors: subject and gender. Gender was entered as a factor of no interest in the model because a gender difference was found in neuroticism scores (see the Results section, Neuroticism scores). Hence, neuroticism scores were centered separately for women and men and were entered as a regressor of interest in the model. Differences between the two sessions as well as interactions with neuroticism (positive as well as negative correlations) were investigated. Results were corrected on FWE cluster level (cluster extent, k.20) with an initial threshold of p,0.001 uncorrected.
Cluster analysis
In order to facilitate interpretation of the results, above-mentioned connectivity maps, i.e (criticism. standard) for each of the thirteen seed regions, were clustered into a number of networks. First, the connectivity maps were averaged across subjects and concatenated. This resulted in a two dimensional matrix (D), where rows represented the seed regions and columns the voxels. Second, the number of clusters present in the data was estimated by creating Cattell’s screeplot [25] and a maximum profile log-likelihood [26] based on the eigenvalues of the covariance matrix of D. Both methods revealed a four-component solution (see 2. Clustering analysis, Figure S1 in File S1). Third, fuzzy c-means (FCM) clustering was applied to matrix D to group the selected seed regions based on their functional connectivity pattern in four clusters [27,28]. The same four-component solution (see 2. Clustering analysis, Figure S2a in File S1) and cluster partition (see 2. Clustering analysis, Figure S2b in File S1) were found, when the cluster analysis was performed on the connectivity maps resulting from the contrast (criticism.standard 6neuroticism).
Results
Neuroticism scores
The mean neuroticism score across the whole sample was 138.756SD 20.53 and was consistent with the mean reference value mentioned in the NEO-manual [21] for the neuroticism domain within a student sample (research-context, mean 138.46
SD 21.5). Furthermore, a gender difference was found for neuroticism (F(1,46)= 8.55, p,0.05). On average, women had higher scores on neuroticism than men (women: mean 144.446
SD 17.72; men: mean 127.386 SD 21.57) (NEO manual, students, research-context, women: mean 143.66SD 21.0; men: mean 132.86SD 20.6).
Cluster analysis
The eigenvalues revealed a four-component solution (see 2. Clustering analysis, Figure S1 in File S1) and therefore, FCM clustering was applied to find four clusters. The first cluster consisted of functional connectivity patterns associated with two seed regions positioned in the prefrontal cortex; the superior frontal gyrus (BA9) and left superior frontal gyrus (prefrontal cluster). The second cluster comprised functional connectivity
Figure 2. Visualization of correlations between the seed regions based on their functional connectivity pattern.Gephi (0.8.1 – beta) was used to draw the graph. The following colors indicate the cluster to which a specific seed region belongs based on the fuzzy c-means clustering approach: the prefrontal cluster (red), the fronto-temporal cluster (yellow), the occipito-parietal cluster (green) and the amygdala/hippocampal cluster (light blue). The seed regions anterior cingulate cortex and SFG(BA10) are depicted in dark blue. The edges between the nodes have a mixed color. The thickness of the edges represents the strength of the correlation between the seed regions based on their functional connectivity pattern. ACC, anterior cingulate cortex; L_Amy, left amygdala; R_Amy, right amygdala; Cun, cuneus; L_Hip, left hippocampus; R_Hip, right hippocampus; L_IFG, left inferior frontal gyrus; L_Ins, left insula; L_SFG, left superior frontal gyrus; L_TP, left temporal pole; PCC/Prec, posterior cingulate cortex/precuneus; SFG(BA10), superior frontal gyrus (BA10); SFG(BA9), superior frontal gyrus (BA9).
patterns related to three seed regions located in the fronto-temporal cortex; the left inferior frontal gyrus (orbital part), left insula and left temporal pole (fronto-temporal cluster). The third cluster consisted of functional connectivity patterns associated with two seed regions sited in the occipito-parietal cortex; the posterior cingulate gyrus/precuneus and cuneus (occipito-parietal cluster). The fourth cluster comprised functional connectivity patterns related to four subcortical seed regions: left and right amygdala and hippocampus (amygdala/hippocampal cluster). The seed regions anterior cingulate gyrus and superior frontal gyrus (BA10) loaded on both the first cluster as well as the second cluster (see Figure 1 and Figure 2).
Brain networks related to criticism
The criticism and standard session were contrasted for each of thirteen seed regions (see Figure 3 and Table 2). First, brain regions were identified that were functionally connected to the prefrontal cluster. When contrasting the criticism session and standard session, this cluster revealed enhanced functional connectivity with the precuneus, superior parietal gyrus, calcarine sulcus, lingual gyrus, fusiform gyrus, superior occipital gyrus and middle cingulate gyrus. The reverse contrast (standard.criticism)
revealed increased functional connectivity between the prefrontal cluster and the superior medial frontal gyrus, superior frontal gyrus, anterior cingulate gyrus, middle cingulate gyrus, supple-mentary motor area, middle frontal gyrus, insula, inferior frontal gyrus, precentral gyrus, middle temporal gyrus, inferior temporal gyrus, inferior parietal gyrus, angular gyrus and supramarginal gyrus. Second, the functional connectivity pattern was determined for the fronto-temporal cluster. For criticism compared to standard, this cluster showed stronger functional connectivity with the precuneus, lingual gyrus and calcarine sulcus. When standard was contrasted with criticism, enhanced functional coupling was found between the fronto-temporal cluster and the superior medial frontal gyrus, anterior cingulate gyrus, middle cingulate gyrus, supplementary motor area, middle frontal gyrus, insula and inferior frontal gyrus.
Third, brain areas were identified that were functionally connected to the occipito-parietal cluster. When criticism was contrasted with standard, the occipito-parietal cluster showed stronger functional connections with the medial orbital frontal gyrus. For standard compared to criticism, no significant results were found. Finally, the functional connectivity pattern was identified for the amygdala/hippocampal cluster. The contrast (criticism.standard)
Figure 3. Functional connectivity patterns related to the thirteen seed regions overlayed on a MNI template for the different contrasts: (A) criticism.standard, (B) standard.criticism, (C) criticism.standard, positive correlation with neuroticism and (D) criticism.standard, negative correlation with neuroticism.Brain regions, showing enhanced functional connectivity to our thirteen seed regions, are depicted in red for seed regions that belong to the prefrontal cluster, in yellow for seed regions that belong to the fronto-temporal cluster, in green for seed regions that belong to the occipito-parietal cluster and in light blue for seed regions that belong to the amygdala/ hippocampal cluster. Connectivity results for the seed regions anterior cingulate cortex and SFG(BA10) are depicted in dark blue. Results were corrected on FWE cluster level (k.20) with an initial threshold of p,0.001 uncorrected.
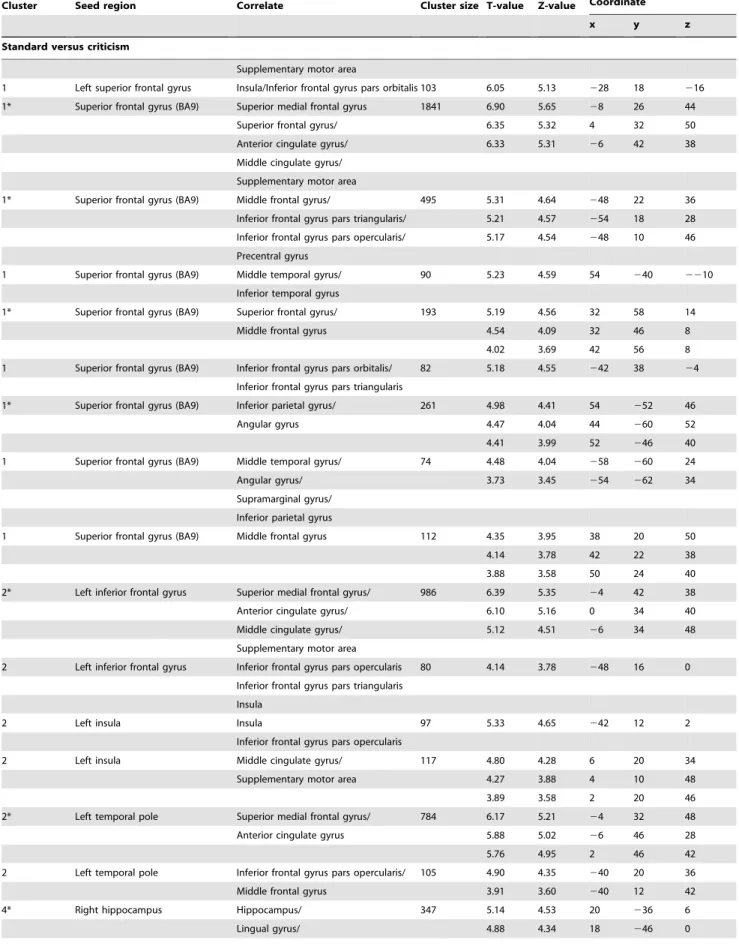
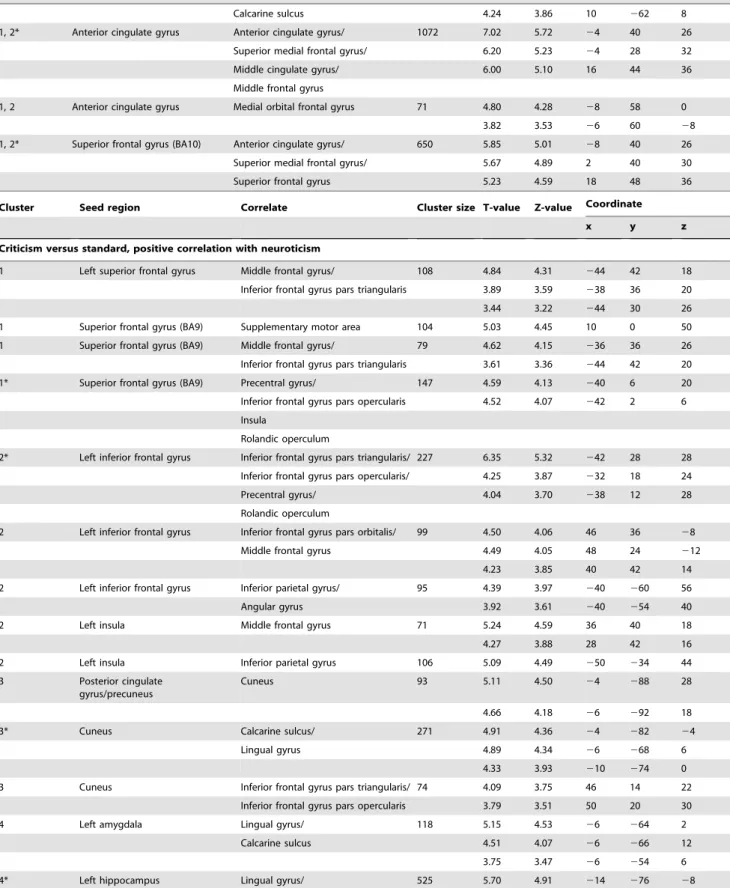
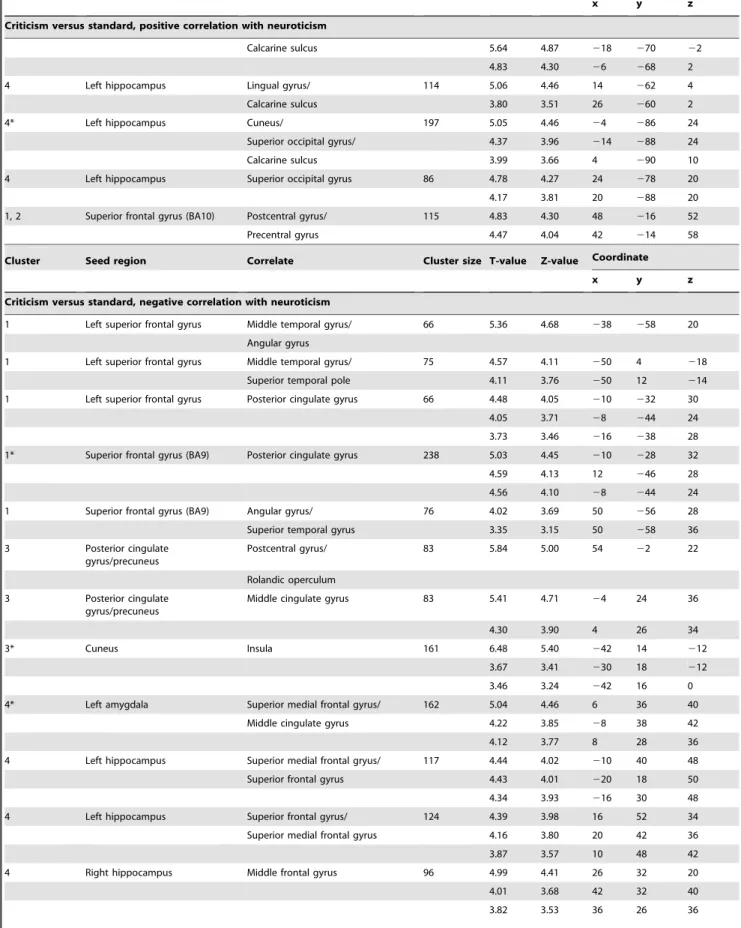
Table 2.Functional connectivity results related to criticism and associations with neuroticism.
Cluster Seed region Correlate Cluster size T-value Z-value Coordinate
x y z
Criticism versus standard
1 Left superior frontal gyrus Superior parietal gyrus/ 87 4.83 4.30 218 264 44
Precuneus 3.70 3.43 220 262 34
1* Left superior frontal gyrus Precuneus 303 4.82 4.30 10 250 50
4.18 3.81 10 242 48
4.14 3.78 0 246 54
1* Left superior frontal gyrus Calcarine sulcus 124 4.55 4.10 26 260 12
4.43 4.01 22 252 6
3.84 3.55 16 264 20
1* Superior frontal gyrus (BA9) Lingual gyrus/ 172 5.45 4.74 236 252 22
Fusiform gyrus 4.52 4.07 216 244 26
4.49 4.05 234 260 24
1 Superior frontal gyrus (BA9) Superior parietal gyrus/ 103 5.25 4.60 216 266 46 Superior occipital gyrus/ 4.29 3.90 220 264 38
Precuneus
1* Superior frontal gyrus (BA9) Calcarine sulcus/ 137 5.12 4.51 22 252 6
Lingual gyrus 4.77 4.26 32 264 16
4.48 4.04 26 260 12
1* Superior frontal gyrus (BA9) Precuneus/ 338 5.02 4.44 0 246 52
Middle cingulate gyrus 4.99 4.42 10 244 52
3.80 3.52 26 252 56
2* Left inferior frontal gyrus Precuneus 615 6.14 5.19 0 256 50
4.88 4.34 10 244 48
4.51 4.07 12 258 46
2 Left inferior frontal gyrus Lingual gyrus/ 99 4.64 4.16 14 254 8
Calcarine sulcus/
Precuneus
2 Left inferior frontal gyrus Calcarine sulcus/ 81 3.92 3.61 22 274 16
Lingual gyrus 3.85 3.56 6 264 16
3.55 3.31 2 260 8
2* Left insula Precuneus 217 4.09 3.74 6 262 48
3.88 3.58 14 258 44
3.88 3.58 8 252 42
3* Posterior cingulate gyrus/precuneus Medial orbital frontal gyrus 133 6.30 5.29 2 50 210
3* Cuneus Medial orbital frontal gyrus 323 6.23 5.25 0 54 -10
5.37 4.68 0 46 28
4.51 4.06 2212 52 26
3* Cuneus Superior frontal gyrus/ 158 5.36 4.68 216 62 16
Superior medial frontal gyrus 3.98 3.65 212 62 6
4 Left amygdala Superior medial frontal gyrus 125 4.23 3.85 22 34 40
4.10 3.75 6 30 48
Cluster Seed region Correlate Cluster size T-value Z-value Coordinate
x y z
Standard versus criticism
1* Left superior frontal gyrus Superior medial frontal gyrus/ 1381 6.22 5.24 210 28 44
Superior frontal gyrus/ 6.21 5.23 10 46 42
Table 2.Cont.
Cluster Seed region Correlate Cluster size T-value Z-value Coordinate
x y z
Standard versus criticism
Supplementary motor area
1 Left superior frontal gyrus Insula/Inferior frontal gyrus pars orbitalis 103 6.05 5.13 228 18 216
1* Superior frontal gyrus (BA9) Superior medial frontal gyrus 1841 6.90 5.65 28 26 44
Superior frontal gyrus/ 6.35 5.32 4 32 50
Anterior cingulate gyrus/ 6.33 5.31 26 42 38
Middle cingulate gyrus/ Supplementary motor area
1* Superior frontal gyrus (BA9) Middle frontal gyrus/ 495 5.31 4.64 248 22 36
Inferior frontal gyrus pars triangularis/ 5.21 4.57 254 18 28 Inferior frontal gyrus pars opercularis/ 5.17 4.54 248 10 46
Precentral gyrus
1 Superior frontal gyrus (BA9) Middle temporal gyrus/ 90 5.23 4.59 54 240 2210 Inferior temporal gyrus
1* Superior frontal gyrus (BA9) Superior frontal gyrus/ 193 5.19 4.56 32 58 14
Middle frontal gyrus 4.54 4.09 32 46 8
4.02 3.69 42 56 8
1 Superior frontal gyrus (BA9) Inferior frontal gyrus pars orbitalis/ 82 5.18 4.55 242 38 24
Inferior frontal gyrus pars triangularis
1* Superior frontal gyrus (BA9) Inferior parietal gyrus/ 261 4.98 4.41 54 252 46
Angular gyrus 4.47 4.04 44 260 52
4.41 3.99 52 246 40
1 Superior frontal gyrus (BA9) Middle temporal gyrus/ 74 4.48 4.04 258 260 24
Angular gyrus/ 3.73 3.45 254 262 34
Supramarginal gyrus/ Inferior parietal gyrus
1 Superior frontal gyrus (BA9) Middle frontal gyrus 112 4.35 3.95 38 20 50
4.14 3.78 42 22 38
3.88 3.58 50 24 40
2* Left inferior frontal gyrus Superior medial frontal gyrus/ 986 6.39 5.35 24 42 38
Anterior cingulate gyrus/ 6.10 5.16 0 34 40
Middle cingulate gyrus/ 5.12 4.51 26 34 48
Supplementary motor area
2 Left inferior frontal gyrus Inferior frontal gyrus pars opercularis 80 4.14 3.78 248 16 0
Inferior frontal gyrus pars triangularis Insula
2 Left insula Insula 97 5.33 4.65 242 12 2
Inferior frontal gyrus pars opercularis
2 Left insula Middle cingulate gyrus/ 117 4.80 4.28 6 20 34
Supplementary motor area 4.27 3.88 4 10 48
3.89 3.58 2 20 46
2* Left temporal pole Superior medial frontal gyrus/ 784 6.17 5.21 24 32 48
Anterior cingulate gyrus 5.88 5.02 26 46 28
5.76 4.95 2 46 42
2 Left temporal pole Inferior frontal gyrus pars opercularis/ 105 4.90 4.35 240 20 36
Middle frontal gyrus 3.91 3.60 240 12 42
4* Right hippocampus Hippocampus/ 347 5.14 4.53 20 236 6
Table 2.Cont.
Cluster Seed region Correlate Cluster size T-value Z-value Coordinate
x y z
Standard versus criticism
Calcarine sulcus 4.24 3.86 10 262 8
1, 2* Anterior cingulate gyrus Anterior cingulate gyrus/ 1072 7.02 5.72 24 40 26
Superior medial frontal gyrus/ 6.20 5.23 24 28 32
Middle cingulate gyrus/ 6.00 5.10 16 44 36
Middle frontal gyrus
1, 2 Anterior cingulate gyrus Medial orbital frontal gyrus 71 4.80 4.28 28 58 0
3.82 3.53 26 60 28
1, 2* Superior frontal gyrus (BA10) Anterior cingulate gyrus/ 650 5.85 5.01 28 40 26
Superior medial frontal gyrus/ 5.67 4.89 2 40 30
Superior frontal gyrus 5.23 4.59 18 48 36
Cluster Seed region Correlate Cluster size T-value Z-value Coordinate
x y z
Criticism versus standard, positive correlation with neuroticism
1 Left superior frontal gyrus Middle frontal gyrus/ 108 4.84 4.31 244 42 18
Inferior frontal gyrus pars triangularis 3.89 3.59 238 36 20
3.44 3.22 244 30 26
1 Superior frontal gyrus (BA9) Supplementary motor area 104 5.03 4.45 10 0 50
1 Superior frontal gyrus (BA9) Middle frontal gyrus/ 79 4.62 4.15 236 36 26 Inferior frontal gyrus pars triangularis 3.61 3.36 244 42 20
1* Superior frontal gyrus (BA9) Precentral gyrus/ 147 4.59 4.13 240 6 20
Inferior frontal gyrus pars opercularis 4.52 4.07 242 2 6 Insula
Rolandic operculum
2* Left inferior frontal gyrus Inferior frontal gyrus pars triangularis/ 227 6.35 5.32 242 28 28 Inferior frontal gyrus pars opercularis/ 4.25 3.87 232 18 24
Precentral gyrus/ 4.04 3.70 238 12 28
Rolandic operculum
2 Left inferior frontal gyrus Inferior frontal gyrus pars orbitalis/ 99 4.50 4.06 46 36 28
Middle frontal gyrus 4.49 4.05 48 24 212
4.23 3.85 40 42 14
2 Left inferior frontal gyrus Inferior parietal gyrus/ 95 4.39 3.97 240 260 56
Angular gyrus 3.92 3.61 240 254 40
2 Left insula Middle frontal gyrus 71 5.24 4.59 36 40 18
4.27 3.88 28 42 16
2 Left insula Inferior parietal gyrus 106 5.09 4.49 250 234 44
3 Posterior cingulate gyrus/precuneus
Cuneus 93 5.11 4.50 24 288 28
4.66 4.18 26 292 18
3* Cuneus Calcarine sulcus/ 271 4.91 4.36 24 282 24
Lingual gyrus 4.89 4.34 26 268 6
4.33 3.93 210 274 0
3 Cuneus Inferior frontal gyrus pars triangularis/ 74 4.09 3.75 46 14 22
Inferior frontal gyrus pars opercularis 3.79 3.51 50 20 30
4 Left amygdala Lingual gyrus/ 118 5.15 4.53 26 264 2
Calcarine sulcus 4.51 4.07 26 266 12
3.75 3.47 26 254 6
Table 2.Cont.
Cluster Seed region Correlate Cluster size T-value Z-value Coordinate
x y z
Criticism versus standard, positive correlation with neuroticism
Calcarine sulcus 5.64 4.87 218 270 22
4.83 4.30 26 268 2
4 Left hippocampus Lingual gyrus/ 114 5.06 4.46 14 262 4
Calcarine sulcus 3.80 3.51 26 260 2
4* Left hippocampus Cuneus/ 197 5.05 4.46 24 286 24
Superior occipital gyrus/ 4.37 3.96 214 288 24
Calcarine sulcus 3.99 3.66 4 290 10
4 Left hippocampus Superior occipital gyrus 86 4.78 4.27 24 278 20
4.17 3.81 20 288 20
1, 2 Superior frontal gyrus (BA10) Postcentral gyrus/ 115 4.83 4.30 48 216 52
Precentral gyrus 4.47 4.04 42 214 58
Cluster Seed region Correlate Cluster size T-value Z-value Coordinate
x y z
Criticism versus standard, negative correlation with neuroticism
1 Left superior frontal gyrus Middle temporal gyrus/ 66 5.36 4.68 238 258 20 Angular gyrus
1 Left superior frontal gyrus Middle temporal gyrus/ 75 4.57 4.11 250 4 218
Superior temporal pole 4.11 3.76 250 12 214
1 Left superior frontal gyrus Posterior cingulate gyrus 66 4.48 4.05 210 232 30
4.05 3.71 28 244 24
3.73 3.46 216 238 28 1* Superior frontal gyrus (BA9) Posterior cingulate gyrus 238 5.03 4.45 210 228 32
4.59 4.13 12 246 28
4.56 4.10 28 244 24
1 Superior frontal gyrus (BA9) Angular gyrus/ 76 4.02 3.69 50 256 28
Superior temporal gyrus 3.35 3.15 50 258 36
3 Posterior cingulate gyrus/precuneus
Postcentral gyrus/ 83 5.84 5.00 54 22 22
Rolandic operculum
3 Posterior cingulate gyrus/precuneus
Middle cingulate gyrus 83 5.41 4.71 24 24 36
4.30 3.90 4 26 34
3* Cuneus Insula 161 6.48 5.40 242 14 212
3.67 3.41 230 18 212
3.46 3.24 242 16 0
4* Left amygdala Superior medial frontal gyrus/ 162 5.04 4.46 6 36 40
Middle cingulate gyrus 4.22 3.85 28 38 42
4.12 3.77 8 28 36
4 Left hippocampus Superior medial frontal gryus/ 117 4.44 4.02 210 40 48
Superior frontal gyrus 4.43 4.01 220 18 50
4.34 3.93 216 30 48
4 Left hippocampus Superior frontal gyrus/ 124 4.39 3.98 16 52 34
Superior medial frontal gyrus 4.16 3.80 20 42 36
3.87 3.57 10 48 42
4 Right hippocampus Middle frontal gyrus 96 4.99 4.41 26 32 20
4.01 3.68 42 32 40
showed enhanced functional coupling between this cluster and the superior medial frontal gyrus. The reverse contrast (standard .
criticism) revealed increased functional connectivity between the amygdala/hippocampal cluster and the hippocampus, lingual gyrus and calcarine sulcus.
The effect of neuroticism on criticism-related brain networks
Interactions between criticism-related functional connectivity and neuroticism were investigated by calculating positive as well as negative correlations with neuroticism for the contrast (criticism.
standard) per seed region (see Figure 3 and Table 2).
First, we identified the functional connectivity pattern for the prefrontal cluster that was modulated by neuroticism. Neuroticism correlated positively with functional connectivity between this cluster and the middle frontal gyrus, supplementary motor area, inferior frontal gyrus, precentral gyrus, insula and rolandic operculum. Furthermore, neuroticism was negatively related to functional connectivity between the prefrontal cluster and the posterior cingulate gyrus, angular gyrus, superior temporal gyrus, middle temporal gyrus and superior temporal pole.
Second, the functional connectivity pattern was identified for the fronto-temporal cluster on which neuroticism had a modula-tory effect. Neuroticism showed a positive correlation with functional connectivity between this cluster and the middle frontal gyrus, inferior parietal gyrus, angular gyrus, inferior frontal gyrus, precentral gyrus and rolandic operculum. No significant functional connectivity results were found, when a negative correlation was calculated with neuroticism.
Third, brain areas were determined for which their functional connection with the occipito-parietal cluster was modulated by neuroticism. Neuroticism was positively associated with functional connectivity between this cluster and the cuneus, calcarine sulcus, lingual gyrus and inferior frontal gyrus. Furthermore, neuroticism correlated negatively with functional connectivity between the occipito-parietal cluster and the middle cingulate gyrus, insula, rolandic operculum and postcentral gyrus. Lastly, we identified the functional connectivity pattern for the amygdala/hippocampal cluster on which neuroticism had a modulatory effect. Neuroticism revealed a positive correlation with functional connectivity between this cluster and the lingual gyrus, calcarine sulcus, superior occipital gyrus and cuneus. Furthermore, neuroticism was negatively related to functional connectivity between the amyg-dala/hippocampal cluster and the superior medial frontal gyrus,
superior frontal gyrus, middle frontal gyrus and middle cingulate gyrus.
Discussion
In the current study, we developed a novel resting-state paradigm to investigate the effect of criticism on functional brain connectivity and associations with neuroticism. The cluster analysis revealed four clusters based on selected seed regions related to self-reflective processing and stress-regulation. During the processing of criticism, these clusters showed enhanced functional connectivity with brain areas involved in emotion processing and social cognition, while they showed reduced connectivity with brain regions related to the default mode network and higher-order cognitive control. Furthermore, the findings revealed that neuroticism modulated functional connec-tivity between aforementioned clusters and brain areas associated with the appraisal, expression and regulation of negative emotions.
Brain networks related to criticism
First, decoupling was found between the prefrontal and fronto-temporal cluster and brain areas related to the default mode network during the processing of criticism. The default state of the brain is supported by a distributed network of anterior and posterior cortical midline structures, the lateral parietal cortex and hippocampal formation [29]. Activity in this network has been observed during passive experimental control conditions and is involved in self-relevant internal cognitive processes [29]. Our finding may suggest that individuals were more externally oriented during the criticism session than during the standard session. Furthermore, the prefrontal and fronto-temporal cluster displayed reduced functional connectivity with several prefrontal brain regions as well. This finding is in line with previous research showing that even mild acute uncontrollable stressors are able to disrupt prefrontal functioning [30,31]. However, the effects of stress on the brain are not always disadvantageous. Emotional stress can bias processing in favor of a salient stimulus that is relevant to the individuals’ current situation [30,31]. In the present paradigm, the salient stimulus took the form of criticism that was expressed onto the subjects’ behavior in the scanner. Accordingly, we found enhanced functional coupling between the clustered seed regions and brain areas involved in emotion processing and social cognition during the processing of criticism. Our results fit with the integrative model of emotion understanding proposed by Spunt and Lieberman (2012) [32]. The authors suggested that first, the Table 2.Cont.
Cluster Seed region Correlate Cluster size T-value Z-value Coordinate
x y z
Criticism versus standard, negative correlation with neuroticism
1, 2 Anterior cingulate gyrus Calcarine sulcus/ 96 4.50 4.06 28 264 10
Lingual gyrus 3.62 3.37 210 252 2
1, 2* Superior frontal gyrus (BA10) Angular gyrus 129 4.73 4.23 52 250 34
4.24 3.86 46 262 28
4.00 3.67 48 254 24
Peak activations with corresponding T-values and Z-values of brain regions, which showed enhanced functional connectivity to our selected seed regions per cluster for the contrasts (criticism.standard), (standard.criticism) and (criticism.standard x neuroticism). Results were corrected on FWE cluster level (k.20) with an initial threshold of p,0.001 uncorrected. An asterisk (*) was used to denote clusters that survived multiple comparisons correction for applying thirteen seed regions (FWE cluster level (k.20) p = 0.05/13 = p,0.003).
mirror neuron system is recruited during the identification of behavior and subsequently, the mentalizing system is recruited in order to make a causal attribution to the observed behavior [32– 34].
In line with the first part of Spunt and Lieberman’s model (2012), we found enhanced functional coupling between the fronto-temporal cluster (specifically the inferior frontal gyrus, IFG) and a number of parietal regions, specifically the precuneus [32]. Previous research has shown that the IFG possesses mirror neuron properties [35,36] and that it is involved in the identification of emotional prosody by utilizing motor representations with regard to the production of a given intonation [37–40]. Such sensorimo-tor patterns may facilitate the identification of other people’s feelings by simulating their mental state [37,38]. This step precedes the mental process of mentalizing in which emotions are attributed to social causes [32]. One of the connections through which both systems are integrated is the connection between the IFG and precuneus (the latter structure is an integral part of the mentalizing system) [32]. This finding is in line with our results, except that Spunt et al. (2012) found the right IFG to be connected to the precuneus instead of the left [32]. However, this distinction might be explained by a difference in task paradigm. In the paradigm of Spunt and Lieberman (2012), participants were instructed to infer an individuals’ emotional state from motor behavior in contrast to linguistic input [32]. In accord, a recent meta-analysis on the diversity of the inferior frontal gyrus revealed that movement control could be attributed to the right hemisphere, while functions related to empathy, language and working memory could be attributed to the left hemisphere [35]. Alternatively, a connection between the left IFG and precuneus has been implicated in the recollection of personal episodes from the past (autobiographical memory) [41]. There is evidence linking autobiographical memory to social cognition by showing a common neural substrate for both mental processes, including the inferior frontal gyrus and precuneus/posterior cingulate gyrus [42]. This functional overlap might promote the construction of predictions regarding other people’s feelings and behavior by drawing upon personal past experiences [42].
With regard to the second part of Spunt and Lieberman’s model (2012), we found enhanced functional connectivity between the prefrontal cluster and several parietal regions (including the precuneus and superior parietal gyrus) and the parietal cluster and medial orbital frontal cortex (OFC) [32]. These regions have been implicated in mentalizing and represent the cognitive and affective components of Theory of Mind (ToM), respectively [33,43–45]. The dorsal medial prefrontal cortex (dmPFC, overlapping with the prefrontal cluster) is involved in inferring what other peoplethink, while the ventral medial prefrontal cortex (vmPFC, overlapping with the medial OFC) is implicated in making inferences about what other people feel [33]. Both components are indirectly connected to the precuneus/posterior cingulate gyrus in the higher association cortex, which is engaged in self-referential processing [43,46]. Furthermore, a connection has been found between the dmPFC and precuneus during the assessment of social relation-ships and their implications [47] and autobiographical memory [46,48]. Moreover, the orbital frontal cortex has been associated with decoding mental states by extracting social information from the environment, such as an individuals’ tone of voice [49].
Finally, we found that the left amygdala coactivated with the dmPFC during the processing of criticism. This finding is consistent with the postulated framework of Etkin et al. (2011), in which a positive connection between abovementioned brain regions is attributed to the appraisal and expression of negative emotions [50]. Furthermore, various studies have shown the
dmPFC and amygdala to be part of a network underlying emotion regulation [51,52].
The effect of neuroticism on criticism-related brain networks
Enhanced functional coupling was found between the prefrontal and fronto-temporal cluster and the lateral prefrontal cortex (LPFC) in individuals scoring higher on neuroticism during the processing of criticism. This region -among others- is involved in the cognitive control over negative emotions [51], specifically during cognitive reappraisal [51,53,54]. Reappraisal can be defined as a strategy in which individuals explicitly regulate their emotions by reinterpreting the meaning of an affective stimulus to reduce its emotional impact [51]. Individual differences in the capacity to employ cognitive control in response to emotionally distressing experiences have been related to variation in adaptive functioning. The impact that these experiences ultimately have on well-being are determined by regulatory success [51]. Generally, high neurotic individuals cope poorly with daily hassles and frequently experience mood spillovers [3,4]. Furthermore, fMRI studies systematically showed that high neurotic individuals are more sensitive to a wide range of negative emotional stimuli, e.g. sad, angry and fearful faces; negative and arousing scenes; negative words; and aversive anticipatory cues [55–62]. In addition, high neurotic individuals are more self-critical [9] and are overly sensitive to criticism by others [5]. These findings and ours may indicate that individuals scoring higher on neuroticism need greater regulatory efforts in order to gain cognitive control over their emotions. However, caution is needed since other functional roles of the LPFC cannot be ruled out [18].
Furthermore, we found decreased functional connectivity between the prefrontal cluster and several default mode brain regions in individuals scoring higher on neuroticism during the processing of criticism. As described before, the default mode network has been related to processes such as self-related processing, mental simulation, introspection, future planning and emotion regulation [29,63]. This finding indicates that although frontal connections are strengthened in high neurotic individuals during the processing of criticism, multiple other long range connections -important for regulating negative emotions- are weakened. It seems that the aforementioned frontal circuit may play a compensatory role by increasing its functional connectivity. Previous research has shown that patients with anxiety disorders also demonstrate decreased default mode functioning in comparison to healthy controls, when they are not given explicit instructions on how to regulate their emotions [63]. In addition, decreased functional coupling was found between the amygdala/hippocampal cluster and a number of frontal regions, including the dmPFC and dorsal lateral prefrontal cortex (dlPFC) in individuals scoring higher on neuroticism during the processing of criticism. As previously mentioned, a connection between these brain areas is involved in the appraisal and expression of negative emotions [50]. It seems that multiple aspects of emotion processing are affected in high neurotic individuals during the processing of criticism, which may increase their sensitivity to negative social-evaluation.
Limitations
a difference on functional connectivity has been investigated by van Dijk et al. (2010). In their study, temporal (TR 2.5 versus 5) as well as spatial (voxel size 2 mm3versus 3 mm3) resolution were varied between runs. The authors concluded that these factors have a minimal effect on functional connectivity measures [22]. Notably, the differences in TR and voxel size were much smaller in the current study (TR 2 versus 2.29 and voxel size 3.263.262.5 versus 3.4463.4463). Therefore, we deem it unlikely that differences in acquisition parameters biased our results substantially. Specifically, the functional connectivity findings related to neuroticism cannot be explained by differential acquisition parameters, since all partici-pants were scanned using the same protocol. Third, a test-retest effect (i.e. time on task) could not be examined in the current study. An option would have been to present neutral comments between the two runs to half of the subjects, however this would have doubled the sample size. Alternatively, counter balancing task order is often applied to disentangle task effects from effects related to test-retest. Note that this was not option because the temporal dynamics of the manipulation are unknown. Investigating the whole-brain functional connectivity dynamics as a consequence of the manip-ulation would be particularly interesting and should improve the sensitivity of the analysis even further. Future research may benefit from studying such time-varying aspects in functional connectivity, for instance, to elucidate how long changes in brain networks related to negative affect persist and whether this pattern is different for high and low neurotic individuals. However, we need to emphasize that having a fixed task order puts constraints on the interpretation of our results. In principle, the findings could be explained by factors such as habituation effects. Nonetheless, differences were found between the two runs that correlated with neuroticism. It is improbable that high neurotic individuals would have reacted in a similar manner to neutral comments, since it is a robust finding in neuroticism research that these individuals express heightened emotional reactivity to negative events [55–62] or react differently to prolonged scan duration. Fourth, no objective stress measures were assessed during the experiment (e.g. heart rate, respiration and cortisol) in order to perform a manipulation check and verify that receiving criticism is indeed experienced as a stressful and arousing
event. Nevertheless, the current paradigm has never been used before and now that it has shown significant effects, it can be investigated more extensively with accompanying measures.
Conclusion
In the current study, we used a novel resting-state paradigm to investigate the effect of criticism on functional brain connectivity and associations with neuroticism. The findings showed that brain regions involved in emotion processing and social cognition were recruited during the processing of criticism, while default mode activity and higher-order cognitive control functions were attenuated. These results may suggest that the criticized person is attempting to understand the beliefs, perceptions, emotions and goals of the critic in order to facilitate flexible and adaptive social behavior. Furthermore, individuals scoring higher on neuroticism showed alterations in functional connectivity between brain areas involved in the appraisal, expression and regulation of negative emotions. These results underscore the general emotional liability that characterizes high neurotic individuals and provide insights into the underlying neurobiological mechanisms that predispose such individuals to the development of mood disorders.
Supporting Information
File S1 Supplementary material. (DOCX)
Acknowledgments
The authors would like to thank A. Sibeijn-Kuiper and J. Streurman-Werdekker for their support in the data acquisition.
Author Contributions
Conceived and designed the experiments: HR JO JL AA. Performed the experiments: JL. Analyzed the data: MNS RJR JCM. Contributed reagents/materials/analysis tools: AA. Wrote the paper: MNS. Proofread-ing the manuscript: HR RJR JCM JO AA.
References
1. Dickerson SS, Kemeny ME (2004) Acute stressors and cortisol responses: A theoretical integration and synthesis of laboratory research. Psychol Bull 130: 355–391.
2. Costa PT, Mccrae RR (1992) The 5-factor model of personality and its relevance to personality-disorders. J Personal Disord 6: 343–359.
3. Ormel J, Bastiaansen A, Riese H, Bos EH, Servaas M, et al. (2013) The biological and psychological basis of neuroticism: Current status and future directions. Neurosci Biobehav Rev 37: 59–72.
4. Suls J, Martin R (2005) The daily life of the garden-variety neurotic: Reactivity, stressor exposure, mood spillover, and maladaptive coping. J Pers 73: 1485– 1510.
5. Watson D, Clark LA, Harkness AR (1994) Structures of personality and their relevance to psychopathology. J Abnorm Psychol 103: 18–31.
6. Costa PTJ, McCrae RR (1989) The NEO-PI/NEO-FFI Manual Supplement. Odessa, FL: Psychological Assessment Resources, Inc.
7. Canli T (2008) Toward a neurogenetic theory of neuroticism. Ann N Y Acad Sci 1129: 153–174.
8. Lahey BB (2009) Public health significance of neuroticism. Am Psychol 64: 241– 256.
9. Clara IP, Cox BJ, Enns MW (2003) Hierarchical models of personality and psychopathology: The case of self-criticism, neuroticism, and depression. Pers Individ Dif 35: 91–99.
10. Premkumar P, Williams SC, Lythgoe D, Andrew C, Kuipers E, et al. (2013) Neural processing of criticism and positive comments from relatives in individuals with schizotypal personality traits. World J Biol Psychiatry 14: 57–70. 11. Blair K, Geraci M, Devido J, McCaffrey D, Chen G, et al. (2008) Neural response to self- and other referential praise and criticism in generalized social phobia. Arch Gen Psychiatry 65: 1176–1184.
12. Hooley JM, Gruber SA, Parker HA, Guillaumot J, Rogowska J, et al. (2009) Cortico-limbic response to personally challenging emotional stimuli after complete recovery from depression. Psychiatry Res 172: 83–91.
13. Hooley JM, Siegle G, Gruber SA (2012) Affective and neural reactivity to criticism in individuals high and low on perceived criticism. PLoS One 7: e44412.
14. Pruessner JC, Dedovic K, Khalili-Mahani N, Engert V, Pruessner M, et al. (2008) Deactivation of the limbic system during acute psychosocial stress: Evidence from positron emission tomography and functional magnetic resonance imaging studies. Biol Psychiatry 63: 234–240.
15. Dedovic K, Duchesne A, Andrews J, Engert V, Pruessner JC (2009) The brain and the stress axis: The neural correlates of cortisol regulation in response to stress. Neuroimage 47: 864–871.
16. Eisenberger NI, Lieberman MD, Williams KD (2003) Does rejection hurt? An fMRI study of social exclusion. Science 302: 290–292.
17. Northoff G, Duncan NW, Hayes DJ (2010) The brain and its resting state activity--experimental and methodological implications. Prog Neurobiol 92: 593–600.
18. van der Meer L, Costafreda S, Aleman A, David AS (2010) Self-reflection and the brain: A theoretical review and meta-analysis of neuroimaging studies with implications for schizophrenia. Neurosci Biobehav Rev 34: 935–946. 19. Pruessner JC, Dedovic K, Pruessner M, Lord C, Buss C, et al. (2010) Stress
regulation in the central nervous system: Evidence from structural and functional neuroimaging studies in human populations—2008 Curt Richter Award Winner. Psychoneuroendocrinology 35: 179–191.
20. Digman JM (1990) Personality structure: Emergence of the five-factor model. Annu Rev Psychol 41: 417–440.
21. Hoekstra HA, Ormel J, De Fruyt F (1996) NEO persoonlijkheidsvragenlijsten: NEO PI-R & FFI. [NEO personality inventories: NEO PI-R & NEO-FFI]. Lisse, The Netherlands: Swets Test Services.
23. Biswal B, Yetkin FZ, Haughton VM, Hyde JS (1995) Functional connectivity in the motor cortex of resting human brain using echo-planar MRI. Magn Reson Med 34: 537–541.
24. Brett M, Anton J, Valabregue R, Poline J (2002) Region of interest analysis using an SPM toolbox [abstract]. Presented at the 8th International Conference on Functional Mapping of the Human Brain, June 2–6, 2002, Sendai, Japan. Available on CD-ROM in Neuroimage, Vol. 16, No. 2, Abstract 497. 25. Cattell RB (1966) Scree test for number of factors. Multivariate Behav Res 1:
245–276.
26. Zhu M, Ghodsi A (2006) Automatic dimensionality selection from the scree plot via the use of profile likelihood. Comput Stat Data Anal 51: 918–930. 27. Bezdek JC (1981) Pattern recognition with fuzzy objective function algoritms.
New York: Plenum Press.
28. Zadeh LA (1977) Fuzzy set and their application to pattern recognition and clustering analysis. New York, London: Academic Press. 355–393 p. 29. Buckner RL, Andrews-Hanna J, Schacter DL (2008) The brain’s default
network: Anatomy, function, and relevance to disease. In: Kingstone A, Miller MB, Kingstone A, Miller MB, editors. The Year in Cognitive Neuroscience 2008. Malden: Blackwell Publishing. 1–38 p.
30. Arnsten AF (2009) Stress signalling pathways that impair prefrontal cortex structure and function. Nat Rev Neurosci 10: 410–422.
31. Liston C, McEwen BS, Casey BJ (2009) Psychosocial stress reversibly disrupts prefrontal processing and attentional control. Proc Natl Acad Sci USA 106: 912–917.
32. Spunt RP, Lieberman MD (2012) An integrative model of the neural systems supporting the comprehension of observed emotional behavior. Neuroimage 59: 3050–3059.
33. Frith CD, Frith U (2006) The neural basis of mentalizing. Neuron 50: 531–534. 34. Uddin LQ, Iacoboni M, Lange C, Keenan JP (2007) The self and social cognition: The role of cortical midline structures and mirror neurons. Trends Cogn Sci 11: 153–157.
35. Liakakis G, Nickel J, Seitz RJ (2011) Diversity of the inferior frontal gyrus–a meta-analysis of neuroimaging studies. Behav Brain Res 225: 341–347. 36. Molenberghs P, Cunnington R, Mattingley JB (2012) Brain regions with mirror
properties: A meta-analysis of 125 human fMRI studies. Neurosci Biobehav Rev 36: 341–349.
37. Alba-Ferrara L, Hausmann M, Mitchell RL, Weis S (2011) The neural correlates of emotional prosody comprehension: Disentangling simple from complex emotion. PLoS One 6: e28701.
38. Aziz-Zadeh L, Sheng T, Gheytanchi A (2010) Common premotor regions for the perception and production of prosody and correlations with empathy and prosodic ability. PLoS One 5: e8759.
39. Ethofer T, Bretscher J, Gschwind M, Kreifelts B, Wildgruber D, et al. (2012) Emotional voice areas: Anatomic location, functional properties, and structural connections revealed by combined fMRI/DTI. Cereb Cortex 22: 191–200. 40. Leitman DI, Wolf DH, Ragland JD, Laukka P, Loughead J, et al. (2010) ‘‘It’s not
what you say, but how you say it’’: A reciprocal temporo-frontal network for affective prosody. Front Hum Neurosci 4: 19.
41. Lundstrom BN, Ingvar M, Petersson KM (2005) The role of precuneus and left inferior frontal cortex during source memory episodic retrieval. Neuroimage 27: 824–834.
42. Spreng RN, Mar RA (2012) I remember you: A role for memory in social cognition and the functional neuroanatomy of their interaction. Brain Res 1428: 43–50.
43. Abu-Akel A, Shamay-Tsoory S (2011) Neuroanatomical and neurochemical bases of theory of mind. Neuropsychologia 49: 2971–2984.
44. Amodio DM, Frith CD (2006) Meeting of minds: The medial frontal cortex and social cognition. Nat Rev Neurosci 7: 268–277.
45. Atique B, Erb M, Gharabaghi A, Grodd W, Anders S (2011) Task-specific activity and connectivity within the mentalizing network during emotion and intention mentalizing. Neuroimage 55: 1899–1911.
46. Cavanna AE, Trimble MR (2006) The precuneus: A review of its functional anatomy and behavioural correlates. Brain 129: 564–583.
47. Iacoboni M, Lieberman MD, Knowlton BJ, Molnar-Szakacs I, Moritz M, et al. (2004) Watching social interactions produces dorsomedial prefrontal and medial parietal BOLD fMRI signal increases compared to a resting baseline. Neuroimage 21: 1167–1173.
48. Cauda F, Geminiani G, D’Agata F, Sacco K, Duca S, et al. (2010) Functional connectivity of the posteromedial cortex. PLoS One 5: e13107.
49. Sabbagh MA (2004) Understanding orbitofrontal contributions to theory-of-mind reasoning: Implications for autism. Brain Cogn 55: 209–219.
50. Etkin A, Egner T, Kalisch R (2011) Emotional processing in anterior cingulate and medial prefrontal cortex. Trends Cogn Sci 15: 85–93.
51. Ochsner KN, Gross JJ (2005) The cognitive control of emotion. Trends Cogn Sci 9: 242–249.
52. Ray RD, Zald DH (2012) Anatomical insights into the interaction of emotion and cognition in the prefrontal cortex. Neurosci Biobehav Rev 36: 479–501. 53. Ochsner KN, Bunge SA, Gross JJ, Gabrieli JD (2002) Rethinking feelings: An
FMRI study of the cognitive regulation of emotion. J Cogn Neurosci 14: 1215– 1229.
54. Ochsner KN, Gross JJ (2008) Cognitive emotion regulation: Insights from social cognitive and affective neuroscience. Current Directions in Psychological Science 17: 153–158.
55. Bru¨hl AB, Viebke MC, Baumgartner T, Kaffenberger T, Herwig U (2011) Neural correlates of personality dimensions and affective measures during the anticipation of emotional stimuli. Brain Imaging Behav 5: 86–96.
56. Chan SW, Norbury R, Goodwin GM, Harmer CJ (2009) Risk for depression and neural responses to fearful facial expressions of emotion. Br J Psychiatry 194: 139–145.
57. Chan SW, Harmer CJ, Goodwin GM, Norbury R (2008) Risk for depression is associated with neural biases in emotional categorisation. Neuropsychologia 46: 2896–2903.
58. Coen SJ, Kano M, Farmer AD, Kumari V, Giampietro V, et al. (2011) Neuroticism influences brain activity during the experience of visceral pain. Gastroenterology 141: 909–917.e1.
59. Cremers HR, Demenescu LR, Aleman A, Renken RJ, van Tol MJ, et al. (2010) Neuroticism modulates amygdala-prefrontal connectivity in response to negative emotional facial expressions. Neuroimage 49: 963–970.
60. Haas BW, Constable RT, Canli T (2008) Stop the sadness: Neuroticism is associated with sustained medial prefrontal cortex response to emotional facial expressions. Neuroimage 42: 385–392.
61. Harenski CL, Kim SH, Hamann S (2009) Neuroticism and psychopathy predict brain activation during moral and nonmoral emotion regulation. Cogn Affect Behav Neurosci 9: 1–15.
62. Kumari V, ffytche DH, Das M, Wilson GD, Goswami S, et al. (2007) Neuroticism and brain responses to anticipatory fear. Behav Neurosci 121: 643– 652.