www.epjournal.net – 2008. 6(4): 613-627
¯ ¯ ¯ ¯ ¯ ¯ ¯ ¯ ¯ ¯ ¯ ¯ ¯ ¯ ¯ ¯ ¯ ¯ ¯ ¯ ¯ ¯ ¯ ¯ ¯ ¯ ¯ ¯
Original Article
Fluctuating Asymmetry and Individual Variation in Regional Gray and White
Matter Volumes: A Voxel-Based Morphometry Study
Matthew Euler, Department of Psychology, University of New Mexico, Albuquerque, New Mexico, USA
Robert J. Thoma, MIND Research Network and Department of Psychiatry, University of New Mexico, Albuquerque, New Mexico, USA
Lauren Parks, Department of Psychology, University of New Mexico, Albuquerque, New Mexico, USA
Steven W. Gangestad, Department of Psychology, University of New Mexico, Albuquerque, New Mexico, USA
Ronald A. Yeo, Department of Psychology, University of New Mexico, Albuquerque, New Mexico, USA. Email: [email protected] (corresponding author)
Abstract: Composite measures of fluctuating asymmetry (FA) of skeletal features are commonly used to estimate developmental instability (DI), the imprecise expression of developmental design due to perturbations during an individual’s growth and maturation. Though many studies have detailed important behavioral correlates of FA, very little is known about its possible neuroanatomical correlates. In this study we obtained structural brain MRI scans from 20 adults and utilized voxel-based morphometry (VBM) to identify specific regions linked to FA. Greater FA predicted greater whole brain white matter volume, and a trend in the same direction was noted for whole brain gray matter volume. Greater FA was associated with significantly greater gray and white matter volumes in discrete brain regions, most prominently in the frontal lobes and in the right cerebral hemisphere. Developmental studies are needed to identify when FA-related brain differences emerge and to elucidate the specific neurobiological mechanisms leading to these differences.
Keywords: fluctuating asymmetry, developmental instability, voxel-based morphometry
Introduction
Developmental instability (DI) refers to an organism’s ability to develop the appropriate species-specific phenotype despite genetic and environmental perturbations that tend to disrupt development, such as mutations, interbreeding, toxins, parasites, injuries, and starvation (Gangestad and Thornhill, 1999; Møller and Swaddle, 1997). DI is often operationalized as fluctuating asymmetry (FA), a composite measure of an individual’s deviations from symmetry in traits that are symmetrical at the population level, without regard to side (Gangestad, Bennett, and Thornhill, 2001). Interest in DI stems in part from the wide range of studies demonstrating that humans with greater FA may show reduced fecundity, health, social dominance, and mating success (Gangestad and Simpson, 2000; Johnstone, 1995; Leung and Forbes, 1997; Thornhill and Møller, 1997; Zebrowitz, Hall, Murphy, and Rhodes, 2002). However, there is substantial variability in the strengths of associations across studies, and reasons for inconsistencies are poorly understood.
To date, greater FA has been reported in a variety of neurodevelopmental disorders (e.g., Edgar et al., 2006; Yeo, Gangestad, and Thoma, 2007) and has also been linked in humans with traits such as intelligence, jealousy, and physical violence (Kowner, 2001). More specifically, individuals with greater FA have been reported to show relatively lower general intellectual functioning (Bates, 2007; Furlow, Armijo-Prewitt, Gangestad, and Thornhill, 1997; Luxen and Buunk, 2006; Prokosch, Yeo, and Miller, 2005; Thoma, Yeo, Gangestad, Halgren, Sanchez, and Lewine, 2005; though see also Johnson, Segal, and Bouchard, 2008) and to express more jealousy in mating situations (Brown and Moore, 2003). Furthermore, greater FA predicts fewer self-reported lifetime sexual partners (Gangestad, Bennett, and Thornhill, 2001) and fewer episodes of physical violence (Furlow, Gangestad, and Armijo-Prewitt, 1998).
Given these behavioral correlates, one would expect FA to vary systematically with aspects of brain anatomy and/or physiology. Identifying specific neural correlates of FA would facilitate our understanding of the mechanisms linking the genetic and environmental determinants of FA with individual differences in behavior. To date, studies linking neural variation with FA in humans are sparse. In general, FA appears to be associated with atypical functional lateralization of the human brain (Thoma, Yeo, Gangestad, Lewine, and Davis, 2000; Yeo, Gangestad, Thoma, Shaw, and Repa, 1997). In addition, we previously reported a positive relationship between skeletal FA and a composite measure of asymmetries of gray matter, white matter, and planum temporale volumes (Thoma, Yeo, Gangestad, Lewine, and Davis, 2002; Thoma et al., 2005). However, we did not find any significant relationships between measures of brain volumes (total brain, gray matter, or white matter) and FA in either of these studies. Consistent with these results, Furlow et al. (1997) found no relationship between head circumference and FA. Further, although FA, gray matter, and total brain volumes individually predict intellectual ability, we have found that these volumes as assessed from MRI scans do not mediate the FA-intelligence relationship (Thoma et al., 2005). However, Bates (2007) recently reported that skull size, which is correlated with brain volume, did mediate the relationship between intelligence and FA.
VBM allows for a fully automated and objective assessment of variations in regional cortical volume, on a whole-brain basis. Studies comparing VBM to manual ROI methods have attested to the validity of the former technique, and have even highlighted the complementarity of the two approaches (Good et al., 2002; Giuliani, Calhoun, Pearlson, Francis, and Buchanan, 2005). As well as quantifying between-group differences in brain volume, VBM has also been used to highlight the relationship between local changes in cortical tissue and measures of cognitive performance (Haier, Jung, Yeo, Head, and Alkire, 2004), disease severity and heterogeneity (Koutsouleris, Gaser, Jager, et al., 2008), and demographics (Smith, Chebrolu, Weckstein, Schmitt, and Markesbery, 2007). Here, we employed VBM to explore the relationship between variations in regional cortical gray and white matter volumes and measured of, in a sample of neurologically intact adults. VBM is especially well suited for exploring the neural correlates of FA. The wide range of behavioral associations of FA does not suggest the central importance of any single brain region. Rather, numerous brain regions could possibly be related to FA, rendering the ROI approach inadequate. In this study, we used VBM to investigate whether specific regions of cortical gray matter and underlying white matter are correlated with FA.
Materials and Methods
Participants
Twenty normal participants (13 male, 7 female) were recruited through ads in the local media. Participants were adults ranging in age from 26 to 62 (see Table 1); one female and two male participants were left-handed. None had a history of head injury, neurological disorder, or unstable medical illness. All participants were screened with the Structured Clinical Interview for DSM-IV Axis-I Disorders, Clinician Version (SCID-CV; First, Spitzer, Gibbon, and Williams, 1996). Individuals with a history of alcohol or other substance abuse in the three months preceding the study were excluded, as were individuals who demonstrated any history of either marijuana or cocaine dependence.
FA Measurement
FA measures reflect deviation from perfect symmetry in bilateral features that, across the relevant population, are typically symmetrical. Alternatively, directional asymmetries (DA) occur in features for which a population of organisms shows a consistent structural or functional bias for a particular side of the body. Examples of directional asymmetry in humans include the placement of the heart and number of lobes in the right versus the left lung. Skeletal FA was assessed in 20 participants using calipers across the feet, ankles, elbows, wrists, and hands. The length and width of each ear and the length of the first four fingers were also measured. Each of these measures was conducted twice to increase reliability, and the mean of the two measurements was calculated and used as the feature size for calculation of FA. Of the seven body parts measured, only hand width was determined to be directionally asymmetric; it was excluded from the present analyses. FA for individual traits was calculated by taking the absolute value of the difference between left and right sides, divided by one-half times the sum of left plus right sides {individual FA = |R-L| / [.5 x (R+L)]}. FA scores for the ten remaining measurements were summed to derive a total FA score for each subject.
For each subject, high-resolution 3D T1-weighted MR images were acquired with a 1.5 T Picker Edge Imager at the VA Functional Neuroimaging Center, using a Field Echo 3D Sagittal sequence (Picker) (TR = 15 ms, TE = 4.4 ms, FOV = 256 mm, flip angle = 25 degrees, matrix 192 x 256, slice thickness = 1.5 mm).
Voxel Based Morphometry
All image analysis was performed using and SPM2 (http://www.fil.ion.ucl.ac.uk/spm/) running in MATLAB version 6.5. The fundamental principles behind VBM have previously been introduced by Ashburner and Friston (2000). First, MR images were manually aligned to a common space in SPM based on the locations of the anterior and posterior commissures. VBM procedures followed the “optimized VBM” protocol as described by Good et al. (2001), including creation of study-specific gray and white matter templates. This involved spatially normalizing each study image to the generic T1 template within SPM using an affine transformation and non-linear basis functions, and segmenting the resulting images into gray matter, white matter, and csf based on voxel intensity values and a priori information about brain tissue distribution. The obtained normalization parameters were then recursively applied to the original images in native space to achieve optimal normalization and segmentation. Optimally segmented gray and white matter images were then averaged to obtain study-specific templates which were smoothed via convolution with a Gaussian kernel of 8mm full width half-maximum (FWHM).
To achieve optimal segmentation of the individual study images, the above recursive procedure was performed where each image was initially segmented and normalized to their respective gray or white matter template. Again, the normalization parameters obtained from this segmentation and warping were applied to the original study-images in native space, and the resulting optimally normalized study-images underwent final segmentation into gray matter, white matter, and CSF. Next, the “modulation” step was performed to correct for erroneous volume changes introduced during spatial normalization. The resulting gray and white matter probability maps were then smoothed with a kernel of 12 mm FWHM, giving the analysis a resolution of approximately 12mm spatial scale for regions significantly associated with FA based on the Matched Filter Theorem (Ashburner and Friston, 2001).
the reported x, y, z coordinates and associated regions only approximate their corresponding regions in Talairach space.
Results
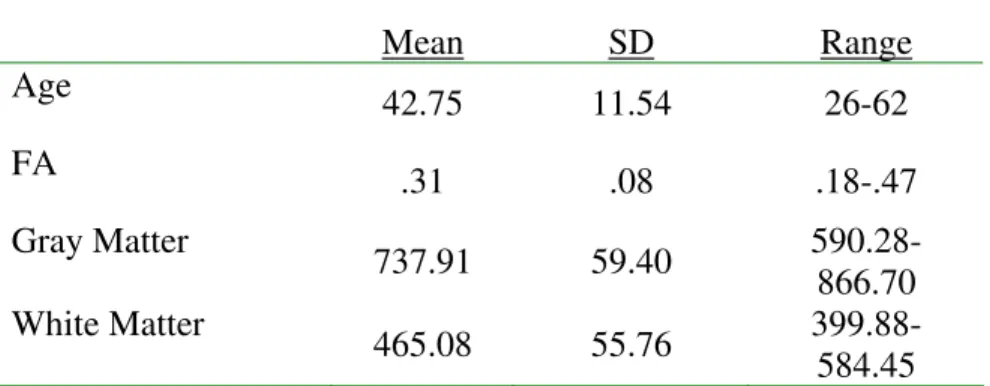
Table 1 provides descriptive statistics on age, FA, and tissue compartment volumes. Partial correlations, controlling for age and sex, were obtained for relationships between segmented overall tissue volumes and FA. We found a significant correlation between total FA and white matter volume (r = .53, p = .025) and a trend toward a significant relationship between FA and total gray matter volume (r = .43, p = .079). A total of eight VBM analyses were performed. In the first four, VBM analyses examined positive and negative relationships of FA with gray and white matter volumes, and age and sex were treated as covariates. The second four analyses added another covariate, either total gray matter volume for the gray matter analyses or total white matter volume for the white matter analyses. As our results below suggest, treating total tissue volume as a covariate reduces statistical power for detecting significantly increased or decreased regions related to FA, yet serves to highlight those regions which are most strongly linked to FA.
Table 1. Descriptive statistics on age, fluctuating asymmetry (FA), and tissue compartment volumes (in cubic centimeters).
Mean SD Range
Age
42.75 11.54 26-62
FA
.31 .08 .18-.47
Gray Matter
737.91 59.40 590.28-866.70 White Matter
465.08 55.76 399.88-584.45
1. Positive gray matter relationships with FA (sex and age as covariates).
Table 2. VBM analysis of gray matter clusters demonstrating significant positive covariation with total FA, with age, and sex as covariates.
Positive (p < .0001)
X Y Z Cluster Size t
Right Middle Frontal gyrus
40 36 48 501 5.82
Left Medial Frontal gyrus
-10 29 41 2154 5.48
Right Inferior Temporal gyrus
52 -21 -36 1152 4.94
Left Inferior Temporal gyrus
-69 -18 -28 792 4.92
Right Medial Frontal gyrus
17 31 31 497 4.89
Right Angular gyrus
43 -59 20 2928 4.88
Right Middle Frontal gyrus
44 31 29 1664 4.79
Right Precentral gyrus
51 0 7 2811 4.70
Left Inferior Frontal gyrus
-51 26 21 1897 4.65
Right Inferior Temporal gyrus
69 -17 -26 618 4.45
Left Anterior Cingulate gyrus
-8 14 26 188 4.34
Left Uncus -17 10 -45 184 4.34
Right Superior Frontal gyrus
15 27 60 471 4.30
Left Superior Frontal gyrus
-9 28 58 134 4.10
2. Negative gray matter relationships with FA (sex and age as covariates). No
significant clusters were identified.
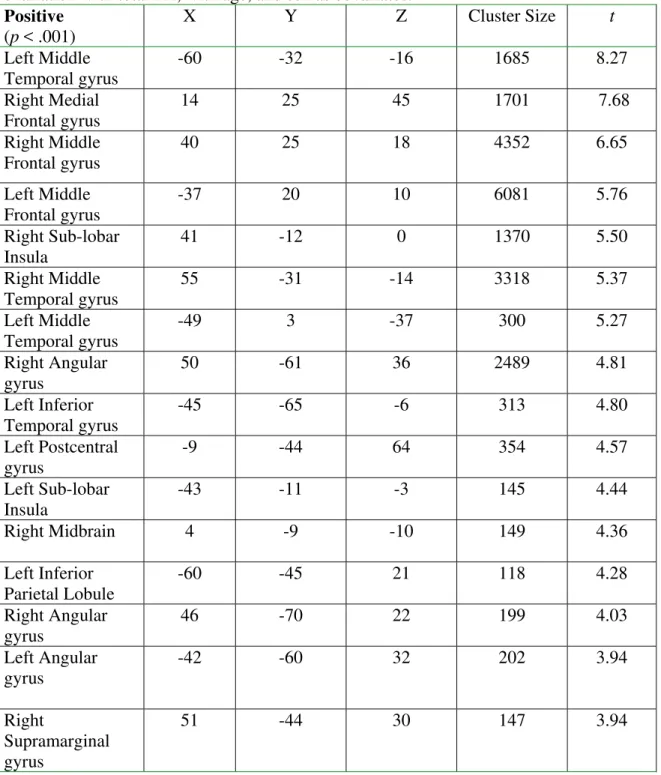
angular gyrus, and right insula. All of these regions contained greater than 1000 contiguous voxels. Other significant white matter regions were found underlying the left middle temporal gyrus, left inferior temporal gyrus, left postcentral gyrus, left insula, right midbrain, left inferior parietal lobule, right supramarginal gyrus, and left and right angular gyri. Table 3 lists the size, location, and statistical value for each significant region and Figure 2 shows the anatomic location of some of these clusters.
Figure 1. Anatomic representation of gray matter clusters demonstrating significant (p < 0.001) positive covariation with total FA (with age, and sex as covariates) in VBM. The crosshairs are located in the right hemisphere. Only those clusters located in the planes defined by the crosshairs are shown. The color bar denotes value of t-statistics.
4. Negative white matter relationships with FA (sex and as covariates). No significant clusters were identified.
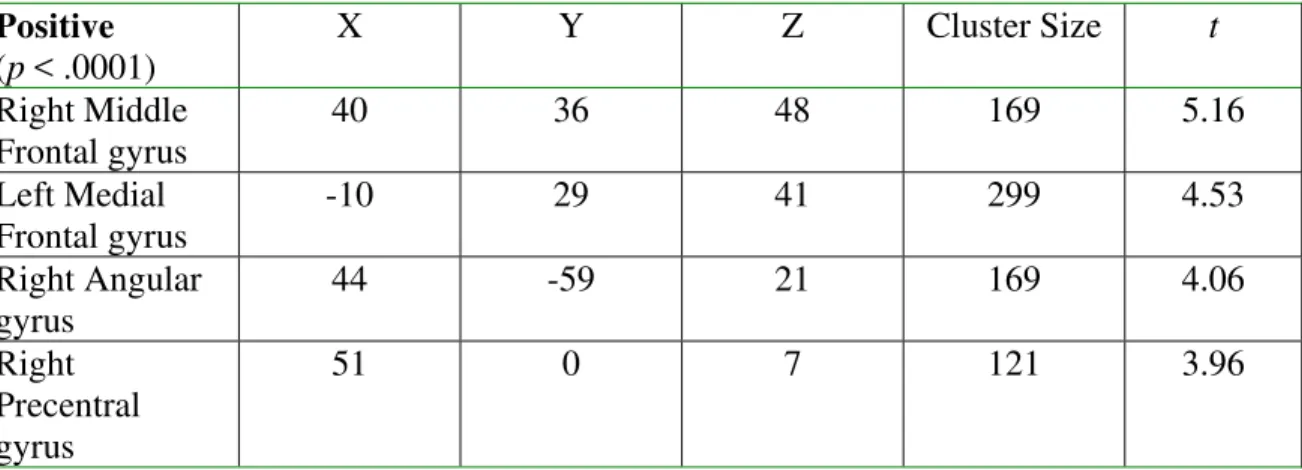
skeletal FA were found in the right middle frontal gyrus (Figure 1B), left medial frontal gyrus, right angular gyrus, and right precentral gyrus. Table 4 lists the size, location, and statistical value for each significant region.
Table 3. VBM analysis of white matter clusters demonstrating significant positive covariation with total FA, with age, and sex as covariates.
Positive
(p < .001)
X Y Z Cluster Size t
Left Middle Temporal gyrus
-60 -32 -16 1685 8.27
Right Medial Frontal gyrus
14 25 45 1701 7.68
Right Middle Frontal gyrus
40 25 18 4352 6.65
Left Middle Frontal gyrus
-37 20 10 6081 5.76
Right Sub-lobar Insula
41 -12 0 1370 5.50
Right Middle Temporal gyrus
55 -31 -14 3318 5.37
Left Middle Temporal gyrus
-49 3 -37 300 5.27
Right Angular gyrus
50 -61 36 2489 4.81
Left Inferior Temporal gyrus
-45 -65 -6 313 4.80
Left Postcentral gyrus
-9 -44 64 354 4.57
Left Sub-lobar Insula
-43 -11 -3 145 4.44
Right Midbrain 4 -9 -10 149 4.36
Left Inferior Parietal Lobule
-60 -45 21 118 4.28
Right Angular gyrus
46 -70 22 199 4.03
Left Angular gyrus
-42 -60 32 202 3.94
Right
Supramarginal gyrus
Figure 2. Anatomic representation of white matter clusters demonstrating significant (p < 0.001) positive covariation with total FA (with age, and sex as covariates) in Voxel Based Morphometry. The crosshairs are located in the right hemisphere. Only those clusters located in these planes are revealed. The color bar denotes value of t-statistics.
6. Negative gray matter relationships with FA (sex, age, and total gray matter volume as covariates). No significant clusters were identified.
Table 4. Voxel Based Morphometry (VBM) analysis of gray matter clusters demonstrating significant positive covariation with total FA, with age, sex, and total gray matter volume as covariates.
Positive (p < .0001)
X Y Z Cluster Size t
Right Middle Frontal gyrus
40 36 48 169 5.16
Left Medial Frontal gyrus
-10 29 41 299 4.53
Right Angular gyrus
44 -59 21 169 4.06
Right Precentral gyrus
51 0 7 121 3.96
Significant clusters of increased white matter in relation to skeletal FA were detected in regions underlying the left middle temporal gyrus, right medial frontal gyrus, left and right middle frontal gyri, and right insula. Notably, all five of these regions were among the most significant regions detected in the prior white matter analysis that did not control total white matter volume. The size, location, and statistical value for each significant region are summarized in Table 5.
Table 5. VBM analysis of white matter clusters demonstrating significant positive covariation with total FA, with age, sex, and total white matter volume as covariates.
Positive
(p < .001)
X Y Z Cluster Size t
Left Middle Temporal gyrus
-60 -33 -16 482 6.90
Right Middle Frontal gyrus
43 26 19 1864 6.27
Right Medial Frontal gyrus
14 25 45 465 5.98
Right Sub-lobar Insula
43 -14 -1 394 4.61
Left Middle Frontal gyrus
-35 20 12 150 4.38
8. Negative white matter relationships with FA (sex, age, and total white matter
volume as covariates). Decreased white matter concentration was associated
Table 6. VBM analysis of white matter clusters demonstrating significant negative covariation with total FA, with age, sex, and total white matter volume as covariates.
Negative
(p < .001)
X Y Z Cluster Size t
Right Superior Parietal lobule
33 -50 62 339 4.92
Left
Parahippocampal gyrus
-26 -27 -26 130 4.63
Right Inferior Temporal
47 -52 -13 235 4.43
Right Cingulate gyrus
9 -11 35 1415 4.42
Discussion
VBM analyses of gray and white matter revealed a number of regions demonstrating that positively correlated with FA. In contrast, no gray matter regions and very few white matter regions showed negative covariation with FA. Prior to discussing the implications of these results, several methodological issues should be considered. First, in two prior studies (Thoma et al., 2002; Thoma et al., 2005) with small samples using a different, operator-defined segmentation analysis, we found no significant univariate correlations between overall gray matter or white matter volumes and FA. In contrast, the current study found a significant positive correlation between total white matter volume and FA and a trend in the same direction for gray matter. Given that the current sample was somewhat older and had slightly greater FA than our prior samples, these differences across studies could reflect either methodological or sampling variance, or both. Second, FA measures are known to be imperfectly related to the latent variable of interest, developmental instability. A biometric analysis of FA (Gangestad, Bennett, and Thornhill, 2001) demonstrated that a composite measure, such as was used in the present study, has a validity coefficient of approximately .68 (see also Prokosch, Yeo, and Miller, 2005). Thus, the true magnitude of FA-brain relationships in the current sample is underestimated unless one corrects for attenuation, which we have not done and replication of the current findings is necessary in a larger sample.
method adversely impacts statistical power. Given our reliance upon the less conservative approach, the current results should be considered preliminary.
Our results indicate that gray and white matter regions linked with FA were not randomly scattered throughout the cortex. Rather, significant clusters were more apt to be found in the frontal lobes and in the right cerebral hemisphere. Thus, although the frontal lobes comprise only about one third of total brain volume, 62% of gray matter voxels described in Table 2 and 53% of the white matter voxels described in Table 3 were from the frontal lobes. Similarly, 67% of these same gray matter voxels were in the right hemisphere, as were 60% of the white matter voxels. Notably absent were any voxels from the occipital lobes. Very few voxels were identified in left-hemisphere peri-sylvian regions associated with language functioning. The regional specificity of these results demonstrates the advantage of VBM over simple correlational analyses of total tissue compartment volumes.
Why would FA be related to greater gray and white matter volumes? As distinct maturational processes contribute to variation in volume at different ages, developmental studies are needed to elucidate the mechanisms underlying the observed neuroanatomic variation. In general, gray matter volume increases during gestation and early childhood and decreases during adolescence and early adulthood, whereas white matter volume tends to show a linear increase over this time frame (Toga, Thompson, and Sowell, 2006). Greater gray matter volume could reflect more robust early neurogenesis or less robust developmental pruning. It is well established that early brain growth increases head circumference; however, since FA is not associated with greater brain circumference (Furlow et al., 1997), it appears that a reduced rate of pruning may be the more likely process. Interestingly, recent data suggests that gray matter pruning may be under the control of the innate immune system (Stevens et al., 2007), perhaps providing a link to observations of greater rates of certain types of infection in individuals with higher FA (e.g., Thornhill and Gangestad, 2006).
As mentioned above, FA has been previously linked with a variety of behavioral traits in humans. Unfortunately, in this study we were not able to evaluate potential relationships between anatomic variations and behavioral traits. The identified sites are involved in distributed neural circuits underlying a diverse set of functions; moreover, they likely comprise only one component of the total set of brain variables linked with FA, such as atypical laterality (Yeo et al., 1997) and variation in neurometabolite concentrations (Yeo, Hill, Campbell, Vigil, and Brooks, 2000). Nonetheless, the identified regions represent possible substrates for FA-related behavioral variation. For example, one site prominently linked with FA in our VBM analysis was the right dorsolateral frontal region. Zaatari and Trivers (2007) reported that low FA individuals are less likely to make “fair” offers in the ultimatum game. Right frontal fMRI activation occurs during performance of this game (Sanfey, Rilling, Aronson, Nystrom, and Cohen, 2003) and transcranial magnetic stimulation of this same region, creating a “temporary lesion,” specifically diminished behaviors reflecting reciprocal fairness (Knoch, Pascual-Leone, Meyer, Treyer, and Fehr, 2006). Hence, gray and white matter variation in the right dorsolateral frontal region may be related to behavioral variation linked with FA in the ultimatum game.
white matter that connects them. Linking this cortical variability with individual differences in behavioral and psychological factors remains to be done in a larger sample. Assessment of these variables in a longitudinal developmental study would optimally address this issue. Investigation of the role of FA in cortical variability in subjects with developmental disorders may also further our understanding of the contribution of DI to abnormal neurodevelopment and psychopathology.
Submitted 4 June 2008; Revisions submitted 8 November 2008 and 17 November 2008; Accepted 18 November 2008
References
Ashburner, J. and Friston, K.J. (2000). Voxel-based morphometry - The methods. NeuroImage, 11, 805-821.
Ashburner, J. and Friston, K.J. (2001). Why voxel-based morphometry should be used. NeuroImage, 14, 1238-1243.
Bates, T.C. (2007). Fluctuating asymmetry and intelligence. Intelligence, 35, 41-46. Brown, W.M., and Moore, C. (2003). Fluctuating asymmetry and romantic jealousy.
Evolution and Human Behavior, 24, 113-117.
Cui X., Jeter C.B., Yang D., Montague P.R., and Eagleman D.M. (2007). Vividness of mental imagery: Individual variability can be measured objectively. Vision Research, 47, 474-8
Edgar, C., Yeo, R.A., Gangestad, S.W., Blake, M.B., Davis, J.T., Lewine, J.D., and Canive, J.M. (2006). Reduced auditory M100 Asymmetry in schizophrenia and dyslexia: Applying a developmental instability approach to assess atypical brain asymmetry. Neuropsychologia, 44, 289-299.
First, M.B., Spitzer, R.L., Gibbon, M., and Williams, J.B.W. (1996). Structured clinical interview for DSM-IV Axis I Disorders (SCID), clinician version. Washington, DC, American Psychiatric Press.
Furlow, B., Armijo-Prewitt, T., Gangestad, S.W., and Thornhill, R. (1997). Fluctuating asymmetry and psychometric intelligence. Proceedings of the Royal Society of London: B, 264, 823-829.
Furlow, B. Gangestad, S.W. and Armijo-Prewitt, T. (1998). Developmental stability and human violence. Proceedings of the Royal Society of London Series B-Biological Sciences, 265, 1-6.
Gangestad, S.W., Bennett, K.L., and Thornhill, R. (2001). A latent variable model of developmental instability in relation to men’s sexual behavior. Proceedings of the Royal Society B, London, 268, 1677-1684.
Gangestad, S.W., and Simpson, J.A. (2000). Trade-offs, the allocation of reproductive effort, and the evolutionary psychology of human mating. Brain and Behavioral Sciences, 23, 624-644.
Gangestad, S.W., and Thornhill, R. (1999). Individual differences in developmental precision and fluctuating asymmetry: A model and its implications. Journal of Evolutionary Biology, 12, 402-416.
structure: a voxel-based morphometric analysis of 465 normal adult human brains. NeuroImage, 14, 685-700.
Good, C.D., Scahill, R.I., Fox, N.C., Ashburner, J., Friston, K.J., Chan, D.C., Crum, W.R., Rossor, M.N., and Frackowiak, R.S.J. (2002). Automatic differentiation of anatomical patterns in the human brain: Validation studies of degenerative dementias. NeuroImage, 17, 29-46.
Giuliani N., Calhoun, V., Pearlson, G., Francis, A., and Buchanan, R. (2005). Voxel-based morphometry versus region of interest: A comparison of two methods for analyzing grey matter. Schizophrenia Research, 74, 135-147.
Haier, R.J., Jung, R.E., Yeo, R.A., Head, K., Alkire, M.T. (2004). Structural brain variation and general intelligence. NeuroImage, 23, 425-433.
Johnson, W., Segal, N.L., Bouchard, T.J. (2008). Fluctuating asymmetry and general intelligence: No genetic or phenotypic association. Intelligence, 36, 279-288.
Johnstone, R.A., (1995). Sexual selection, honest advertisement and the handicap principle. Biological Reviews, 70, 1-65.
Knoch, D., Pascual-Leone, Meyer, Treyer, and Fehr, E. (2006). Diminishing reciprocal fairness by disrupting the right prefrontal cortex. Science, 314, 829-832.
Koutsouleris, N., Gaser, C., Kager, M., Bottlender. R. Frodl, T., et al. (2008). Structural correlates of psychopathological symptom dimensions in schizophrenia: A voxel-based morphometry study. NeuroImage, 39, 1600-1612.
Kowner, R. (2001). Psychological perspective on human developmental stability and fluctuating asymmetry: Sources, applications, and implications. British Journal of Psychology, 92, 447-469.
Leung, B., and Forbes, M.R. (1997). Modelling fluctuating asymmetry in relation to stress and fitness. Oikos, 78, 397-405.
Luxen, M.F., and Buunk, B.P. (2006). Human intelligence, fluctuating asymmetry, and the peackock’s tail -- General intelligence (g) as an honest signal of fitness. Personality and Individual Differences, 41, 897-902.
Møller, A.P., and Swaddle, J.P. (1997). Developmental stability and evolution. Oxford: Oxford University Press.
Prokosch, M.D., Yeo, R.A., and Miller G.F. (2005). Intelligence tests with higher g-loadings show higher correlations with body symmetry: Evidence for a general fitness factor mediated by developmental stability. Intelligence, 33, 203-213.
Rotzer, S., Kucian, K., Martin, E., von Aster, M., Klaver, P., and Loenneker, T. (2008). Optimized voxel-based morphometry in children with developmental dyscalculia. NeuroImage, 39, 417-422.
Sanfey, A.G., Rilling, K.K., Aronson, J.A., Nystrom, L.E., and Cohen, J.D. (2003). The neural basis of economic decision-making in the ultimatum game. Science, 300, 1755-1758.
Smith, C.D., Chebrolu, H., Welstein, D.R., Schmitt, F.A., and Markesbery, W.R. (2007). Age and gender effects on human brain anatomy: A voxel-based morphometric study in healthy elderly. Neurobiology of Aging, 28, 1075-1087.
classical complement cascade mediates CNS synapse elimination. Cell, 131, 1164-1178.
Thoma, R.J., Yeo, R.A., Gangestad, S.W., Halgren, E., Sanchez, N., and Levine, J. (2005). Cortical volume and developmental instability are independent predictors of
general intellectual ability. Intelligence, 33, 27-38.
Thoma, R.J., Yeo, R.A. , Gangestad, S.W., Lewine, J., and Davis, J.T.. (2002). Fluctuating asymmetry and the human brain. Laterality, 7, 45-58.
Thornhill, R. and Gangestad, S.W. (2006). Facial sexual dimorphism, developmental stability, and susceptibility to disease in men and women. Evolution and Human Behavior, 27, 131-144.
Thornhill, R., and Møller, A.P. (1997). Developmental stability, disease, and medicine. Biological Reviews, 72, 497-548.
Toga, A.W., Thompson, P.M., and Sowell, E.R. (2006). Mapping brain maturation. Trends in Neurosciences, 29, 148-159.
Yeo, R.A., Gangestad, S.W., Thoma, R.A., Shaw, P., and Repa, K. (1997). Developmental instability and cerebral lateralization. Neuropsychology, 11, 552-561.
Yeo, R. A., Gangestad, S.G., and Thoma, R.J. (2007). Developmental instability and individual variation in brain development: Implications for the etiology of neurodevelopmental disorders. Current Directions in Psychological Science, 15, 245-249.
Yeo, R.A., Hill, D.E., Campbell, R., Vigil, J., and Brooks, W.M. (2000) Developmental instability and working memory ability in children: A magnetic resonance spectroscopy investigation. Developmental Neuropsychology, 17, 143-159.
Zaatari, D., and Trivers, R. (2007). Fluctuating asymmetry and behavior in the ultimatum game in Jamaica. Evolution and Human Behavior, 28, 223-227.