Skeletal Muscle Ryanodine Receptor (RyR1)
Srinivas Ramachandran1,2, Adrian W. R. Serohijos1,2,3, Le Xu1, Gerhard Meissner1,2, Nikolay V. Dokholyan1,2*
1Department of Biochemistry and Biophysics, University of North Carolina Chapel Hill, Chapel Hill, North Carolina, United States of America,2Molecular and Cellular Biophysics Program, University of North Carolina Chapel Hill, Chapel Hill, North Carolina, United States of America,3Department of Physics and Astronomy, University of North Carolina Chapel Hill, Chapel Hill, North Carolina, United States of America
Abstract
Ryanodine receptors (RyRs) are ion channels that regulate muscle contraction by releasing calcium ions from intracellular stores into the cytoplasm. Mutations in skeletal muscle RyR (RyR1) give rise to congenital diseases such as central core disease. The absence of high-resolution structures of RyR1 has limited our understanding of channel function and disease mechanisms at the molecular level. Here, we report a structural model of the pore-forming region of RyR1. Molecular dynamics simulations show high ion binding to putative pore residues D4899, E4900, D4938, and D4945, which are experimentally known to be critical for channel conductance and selectivity. We also observe preferential localization of Ca2+over K+in the selectivity filter of RyR1. Simulations of RyR1-D4899Q mutant show a loss of preference to Ca2+in the selectivity filter as seen experimentally. Electrophysiological experiments on a central core disease mutant, RyR1-G4898R, show constitutively open channels that conduct K+but not Ca2+. Our simulations with G4898R likewise show a decrease in the preference of Ca2+over K+in the selectivity filter. Together, the computational and experimental results shed light on ion conductance and selectivity of RyR1 at an atomistic level.
Citation:Ramachandran S, Serohijos AWR, Xu L, Meissner G, Dokholyan NV (2009) A Structural Model of the Pore-Forming Region of the Skeletal Muscle Ryanodine Receptor (RyR1). PLoS Comput Biol 5(4): e1000367. doi:10.1371/journal.pcbi.1000367
Editor:Vijay S. Pande, Stanford University, United States of America ReceivedJuly 30, 2008;AcceptedMarch 19, 2009;PublishedApril 24, 2009
Copyright:ß2009 Ramachandran et al. This is an open-access article distributed under the terms of the Creative Commons Attribution License, which permits unrestricted use, distribution, and reproduction in any medium, provided the original author and source are credited.
Funding:This work was supported by grants AR 018687 and HL 073051 from the National Institutes of Health (to GM), grants GM080742 from the National Institutes of Health and 0665361U from the American Heart Association (to NVD), and predoctoral fellowship 0715215U from the American Heart Association (to AWRS). The funders had no role in study design, data collection and analysis, decision to publish, or preparation of the manuscript.
Competing Interests:The authors have declared that no competing interests exist. * E-mail: [email protected]
Introduction
Muscle contraction upon excitation by nerve impulse is initiated by a rapid rise in cytoplasmic Ca2+
. In skeletal muscle, the rise in cytoplasmic Ca2+
is brought about by the opening of the ryanodine receptor (RyR1), which releases Ca2+ from
intracellular stores [1,2]. RyRs are large tetrameric ion channels (molecular weight of 2.26 MDa) present in the membranes of endoplasmic/sarcoplasmic reticulum. They have high con-ductance for monovalent (,800 pS with 250 mM K+ as conducting ion) and divalent cations (,150 pS with 50 mM Ca2+
), while being selective for divalent cations (PCa/PK,7) [3].
RyRs are important mediators of excitation-contraction coupling and congenital mutations of RyRs result in neuromuscular diseases such as malignant hypothermia and central core disease (CCD) [4].
Although RyRs are physiologically important, the molecular basis of their function is poorly understood. RyRs have unique properties such as their modes of selectivity and permeation not seen in other ion channels with known structures. Next to the putative selectivity filter (4894GGGIG), there are two negatively charged residues (D4899 and E4900) in RyR1 that are essential for normal selectivity and conductance [5]. K+
channels have an analogous selectivity filter, but in contrast to RyR1, have only one adjacent negative residue that is not even conserved while other Ca2+
channels have only one conserved negative residue in the
equivalent position [6]. In the selectivity filter, mutations result in non-functional channels [4] leading to CCD. A structural model of the pore region that would reveal the location and function of these residues will be useful in understanding the role of these residues in channel function.
An early model of RyR ion permeation postulated potential barriers within the pore corresponding to three putative binding sites [7]. Without any knowledge of the structure of the pore, the model was able to quantitatively reproduce conductance data of various ions. A PNP-DFT (Poisson Nernst Planck-Density Functional Theory) model [8] accurately modeled the role of residues D4899 and E4900 in RyR1 in generating the high ion conductances of RyRs established by mutagenesis [5,9]. Selectivity was attributed to charge-space competition, as Ca2+ could
accommodate the most charge in least space compared to K+
. However, since the channel model used in these simulations relied on a fixed structure, it could not predict changes due to mutations that potentially alter the structure of the channel.
Additionally, there are two homology models of the RyR pore region [10,11] based on KcsA, a bacterial K+
channel whose solution structure is known [12]. Shahet al. [11] used
I4897, G4898, D4899 and E4900 are important for channel conductance and selectivity, which suggests that they are part of the conduction pathway of RyR1 resulting in the predicted selectivity filter being 4894GGGIGDE. Welch et al. also
constructed a homology model for the cardiac ryanodine receptor (RyR2) using the structure of the KcsA channel [10] and performed simulations to identify residues important for channel function. Their simulations failed to identify D4899 as an important residue for ion permeation contrary to what has been shown experimentally [5]. Furthermore, cryo-electron microscopy (cryo-EM) of RyR1 (which has revealed the pore structure at highest resolution yet) revealed significant differences between the pore region of KcsA and RyR1 [13].
Experimental structure determinations of the RyRs have been mainly performed by cryo-EM [14–17]. These studies revealed conformational changes that accompany channel opening [18] and the binding sites of various effectors of RyRs [19–21]. Cryo-EM has a resolution of,10–25 A˚ and thus is able to provide only limited structural information regarding the pore structure. Samso
et al. [22] manually docked the KcsA pore structure into the
transmembrane region of their cryoEM map of the intact closed RyR1. Furthermore, they predicted the presence of at least 6 transmembrane helices from simple volumetric constraints. Ludtke
et al.[13] identified several secondary structure elements in their
,10 A˚ resolution cryo-EM map of the closed RyR1. The pore-forming region as visualized by Ludtkeet al.consists of a long inner
helix made up of 31 residues and a pore helix made up of 15 residues that are presumably connected by a long luminal loop made up of 24 residues. Since the structure is derived from cryo-EM, the positions of pore residues’ side chains and the structure of loops connecting the helices are unknown. We build a molecular model of the pore region of RyR1 based on their cryo-EM study by adding the luminal loop and the missing side chains of residues forming the helices of the pore. Furthermore, in our molecular dynamics simulations we examine the interactions of the pore region with mono- and divalent cations known to permeate the channel (Table 1).
Results
Model of the RyR1 pore region
We present in Figure 1 an atomistic model of the pore-forming region of the tetrameric RyR1 constructed from cryo-EM data [13]. Figure 1A shows two of the four inner helices and pore helices connected by a long luminal loop. Site-directed mutagen-esis [22,23] predicts that RyR1 has a selectivity filter Author Summary
Ryanodine receptors (RyRs) are ion channels present in the membranes of an intracellular calcium storage organelle, the sarcoplasmic reticulum. Nerve impulse triggers the opening of RyR channels, thus increasing the cytoplasmic calcium levels, which subsequently leads to muscle contraction. Congenital mutations in a specific type of RyR that is present in skeletal muscles, RyR1, lead to central core disease (CCD), which leads to weakened muscle. RyR1 mutations also render patients to be highly susceptible to malignant hyperthermia, an adverse reaction to general anesthesia. Although it is generally known that CCD mutations abort RyR1 function, the molecular basis of RyR1 dysfunction remains largely unknown because of the lack of atomic-level structure. Here, we present a structural model of the RyR1 pore region, where many of the CCD mutations are located. Molecular dynamics simulations of the pore region confirm the positions of residues experimentally known to be relevant for function. Further-more, electrophysiological experiments and simulations shed light on the loss of function of CCD mutant channels. The combined theoretical and experimental studies on RyR1 elucidate the ion conduction pathway of RyR1 and a potential molecular origin of muscle diseases.
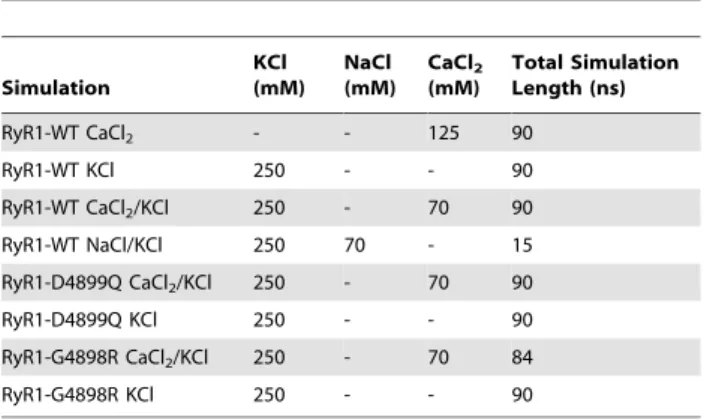
Table 1.Concentrations of ions used in different simulations.
Simulation
KCl (mM)
NaCl (mM)
CaCl2
(mM)
Total Simulation Length (ns)
RyR1-WT CaCl2 - - 125 90
RyR1-WT KCl 250 - - 90
RyR1-WT CaCl2/KCl 250 - 70 90
RyR1-WT NaCl/KCl 250 70 - 15
RyR1-D4899Q CaCl2/KCl 250 - 70 90
RyR1-D4899Q KCl 250 - - 90
RyR1-G4898R CaCl2/KCl 250 - 70 84
RyR1-G4898R KCl 250 - - 90
doi:10.1371/journal.pcbi.1000367.t001
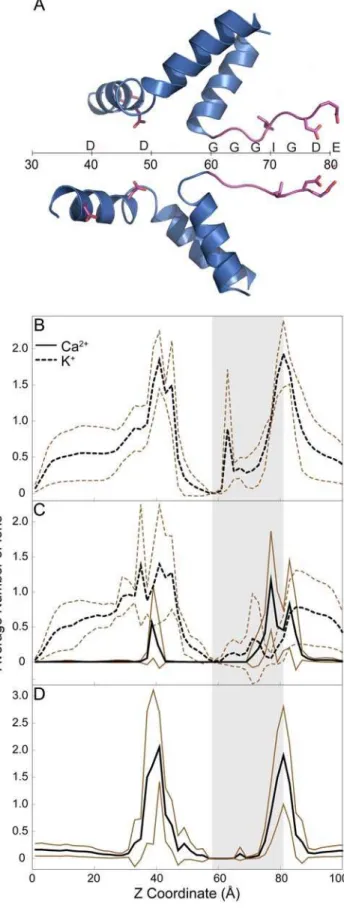
Figure 1. The pore model.(A) Two opposing RyR1 monomers shown in cartoon representation. The selectivity filter (the motif 4894GGGIGDE) is shown in yellow. (B) Selectivity filter region of two opposing RyR1 monomers shown in stick representation. The sequence of the fragment is shown along the path of the ions. The molecular surface of the luminal face (C) and the cytoplasmic face (D) of RyR1 pore tetramer. Negative residues are shown in red while positive residues are shown in blue and the neutral residues are shown in white. This figure was created using PyMOL (http://pymol.sourceforge.net/).
(4894GGGIGD), which is analogous to K+
channels (Figure 1B). Since the pore helix immediately precedes the selectivity filter, we assign M4879-A4893 to the 15-residue pore helix. In K+
channels, the sequence GXXXXA in the inner membrane-spanning helix has been proposed to form the gating hinge [24]. The analogous glycine in RyR1 occurs in the 4934 position, which determines the sequence of the 40-residue inner helix as I4918-E4948. Thus, the pore corresponds to residues M4879-E4948 [13], which includes the putative selectivity filter. We construct the luminal loop by constraining the diameter of the selectivity filter at its luminal edge to 7 A˚ [25] (Figure 1B). In this model, the acidic residues important for channel function, D4899 and E4900 are located at the mouth of the pore and at the beginning of the selectivity filter. Both the cytoplasmic and luminal faces of the pore are highly negatively charged (as seen in the surface representation in Figure 1C and 1D), which may allow cations to concentrate around the mouths of the pore. We also predict the negatively charged faces to exclude anions, which RyR1 is known not to conduct. Interestingly, with the exception of L4935 and L4943, the hydrophobic residues lining the helices face away from the water filled pore. In K+
channels, hydrophobic residues facing the pore are known to perform important functional roles (like stabilization of the inactivation gate [26]). The model exhibits structural similarities with the K+
channel MthK such as the positioning of the pore helix and the inner helix and the bending of the inner helix [27], although in RyR1 the pore is significantly wider. To model the interactions of RyR1 pore with ions and elucidate sites of high ion occupancy along the pore, we perform molecular dynamics simulations of RyR1 (see below).
Experimental characterization of wild type and mutant channels
We describe here some of the experimental characteristics of RyR1 mutants D4899Q and G4898R, which are both present in the selectivity filter. We compare in Figure 2 the ion permeation properties of wild type RyR1-WT [5] with RyR1-D4899Q [5] and CCD associated RyR1-G4898R [28] mutant channels. Proteoli-posomes containing purified 30S channel complexes were fused with planar lipid bilayers and single channel currents were recorded in 250 mM KCl on both sides of the bilayer. Figure 2 shows representative single channel traces in presence of 2mM cis (SR cytosolic) Ca2+ (left, upper traces) and following the
subsequent addition of 10 mM trans (SR luminal) Ca2+
(left, lower traces). In presence of 2mM Ca2+
, WT and the two mutant channels showed rapid transitions between open and closed channel states. Reduction in cis Ca2+
from 2mM to 0.01mM reduced channel open probability for WT and D4899Q close to background levels (data not shown). In contrast, single channel activities of RyR1-G4898R did not respond to a change in cytosolic Ca2+
concentration from 2mM to 0.01mM (not shown). Ion currents through WT and mutant channels showed a linear voltage-dependence but differed in their magnitude (Figure 3, right panel). Averaged single channel conductances were 801 pS for WT, 164 pS for D4899Q, and 352 pS for RyR1-G4898R. The Ca2+selectivity of WT and the two RyR1 mutants
was determined by recording current-voltage curves in 250 mM symmetrical KCl with 10 mM Ca2+
in the trans bilayer chamber. At 0 mV in presence of 10 mM trans Ca2+
, WT exhibited averaged unitary Ca2+ current of
22.4 pA compared with 20.4 pA for RyR1-D4899Q and ,0 pA for RyR1-G4898R. Addition of 10 mM Ca2+
to the trans chamber reduced single channel currents of WT and D4899Q at negative and positive potentials and the averaged reversal potentials (Erev) for WT and
D4899Q were shifted by +9.5 mV and +1.9 mV, respectively
(Figure 2, right panel). Applying constant field theory, a permeability ratio of Ca2+
over K+
(PCa/PK) of 7.0 and 1.0 is
calculated for WT and D4899Q, respectively (Table 2). In contrast, addition of 10 mM trans Ca2+ did not generate a
noticeable unitary Ca2+
current at 0 mV, and had no effect on ion currents or reversal potential of RyR1-G4898R. Taken together, the single channel data of Figure 2 indicate that the D4899Q mutation decreases K+conductance and ion selectivity for Ca2+
over K+
compared to WT, without eliminating Ca2+
responsive-ness. In contrast, the CCD associated G4898R mutation abolished Ca2+responsiveness, Ca2+permeation, and reduced ion
conduc-tance demonstrating that the G4898R mutation introduced major global conformational changes in RyR1.
Acidic residues lining the pore of the RyR channel have been assumed to be deprotonated at physiological pH. In support of this, site directed mutagenesis resulting in charge neutralization of acidic residues reduced ion conduction and selectivity [5]. Single channel experiments in the pH range of 6.5–9.4 (on the luminal side) on RyR1-WT were performed to probe the protonation status of luminal residues D4899 and E4900. Lack of a significant effect of a change of pH on K+ ion conductance and the
permeability ratio of Ca2+
over K+
(Xu and Meissner, unpublished studies) indicate that the protonation status of D4899 and E4900 remained unchanged. Hence we assume in our MD simulations that these residues are deprotonated.
Molecular dynamics simulations of the pore model
To model the interactions of RyR1 pore with ions, we perform molecular dynamics simulations of the RyR1 pore tetramer with 70 mM CaCl2and 250 mM KCl. Ca
2+is present in the solution
only on the luminal side. We plot the histogram of ion occupancies in the pore against the pore axis in Figure 3. Ca2+
shows highest occupancy at 77 A˚ along the axis of the channel, which corresponds to the position of D4899 in the selectivity filter (Figure 3C). We find the preferential occupancy ratio, R for the CaCl/KCl simulations to be 11.365.6 (Table 3). These results show a clear preference of Ca2+over K+in the selectivity filter. We
hypothesize that this preferential localization of Ca2+
in the first binding site along the path from luminal to cytosolic side may play an important role in channel selectivity. To ensure that this preferential localization of Ca2+is not due to selective exclusion of
K+
ions in the filter, we perform simulations of the pore with only KCl present. These simulations show K+
occupancy to be highest at 81 A˚ (Figure 3B) and the total charge of the ions in the selectivity filter (Table 3) to be similar to simulations with CaCl/ KCl, which shows that the binding sites are amenable to K+
in absence of Ca2+
. As a control, we perform simulations with NaCl/ KCl with the same starting configuration as the CaCl2/KCl
simulations. We observe a decreased occupancy of Na+ when
compared to Ca2+
. Na+
is still preferred over K+
in the selectivity filter, if we take relative concentration of NaCl and KCl into consideration with R = 2.2 (Figure S1). Simulations with only CaCl2 show similar results (Figure 3D). The occupancy data
qualitatively reflects the selectivity of RyR1 pore, which is in the order of Ca2+
being much greater than Na+
which is slightly greater than K+[7].
Radial distribution functions (RDF) of the ions around the carboxyl oxygens of D4899 and E4900 reflect the affinities of various ions to the binding site. We plot the number of ions found at a distancerfrom the carboxyl oxygens of D4899 and E4900, to
confirm that the peaks that we observe in ion occupancy plots is due to localization of the ions near these residues. From the RDFs, we find that Ca2+
ions exhibit the highest affinity for D4899 and E4900 followed by Na+
and then K+
experimentally observed that the conductance of the channel is highest for K+
, followed by Na+
and then Ca2+
[7]. These two observations lead us to postulate that that tighter binding results in ions spending more time in the channel, thus giving rise to lower ion currents.
The higher occupancy of Ca2+
compared to K+
can be either primarily attributed to electrostatics (due to the presence of 8 acidic residues in the vicinity) or to electrostatics combined with the structure formed by the selectivity filter. By calculating the occupancy of ions inside the pore region corresponding to the selectivity filter (formed by 4894GGGIGDE of the tetramer, as shown in Figure 1B), we also consider if the pore structure contributes in concentrating the ions inside the pore. Although eight negative charges in a confined space would be more selective for Ca2+than K+as determined by a charge/space model [29], we
find that in an all-atom model of RyR1 pore region, the selectivity filter is able to sample structures that support preferential localization of Ca2+inside the pore (in the region corresponding
to the selectivity filter). Thus, the preferential localization of Ca2+
over K+is due to both the pore structure and electrostatics.
Molecular dynamics simulations of RyR1-G4898R and RyR1-D4899Q
To confirm the preferential Ca2+
binding in the selectivity filter, we perform MD simulations on two experimentally characterized RyR1 mutants, D4899Q [5] and G4898R [28]. In single channel experiments, the RyR1-D4899Q exhibits a decreased selectivity for Ca2+
and lower K+
conductance (Table 2). The experimentally observed decreased selectivity of Ca2+
over K+
in RyR1-D4899Q can be rationalized from our simulations. In simulations involving D4899Q, the ion occupancy histograms show that the peaks for K+
and Ca2+
are outside the selectivity filter compared to that of the RyR1-WT (Figure 5D). We observe that the preference for Ca2+
over K+
in the selectivity filter decreases to R = 3.161.6 from R = 11.365.6 in RyR1-WT. Further, the total ionic charge in the selectivity filter is reduced (4.3 on an average compared to 7 in RyR1-WT). RDF of ions around Q4899 (Figure 4C) strongly suggests that there is no binding of K+ and Ca2+at the site of
mutation, as also seen in Figure 5D. In simulations of RyR1-D4899Q, the RDFs and ion histogram taken together prove that Ca2+and K+bind only at the end of the selectivity filter especially
near E4900.
Transition of an ion from a fully hydrated state to inside the channel where hydration is low is facilitated by presence of high affinity binding sites near the entrance of the channel. According to our structural model of the RyR1 pore, D4899 and E4900 residues are present at the entrance of the channel and form the first binding site of ions as they traverse from the luminal side to the cytosolic side. Hence, mutation of glutamic acid to asparagine resulting in a net loss of 4 negative charges weakens the initial binding event of cations as they enter the pore, which would result in the decrease of overall conductance of cations. Another important observation is that when just one of the two acidic residues in the selectivity filter is neutralized, Ca2+
binding is affected much more than K+
, whose binding remains the same as RyR1-WT (Table 3). These results suggest the requirement of higher magnitude of negative charges in the selectivity filter to bind Ca2+
efficiently.
Simulations with RyR1-G4898R show a decrease in preference of Ca2+
in the selectivity filter (Figure 5B). The preferential occupancy ratio of Ca2+over K+ions (R = 4.5
60.9) is lesser than RyR1-WT (R = 11.365.6). The highest occupancy of Ca2+ions
occurs near the edge of the selectivity filter similar to that of RyR1-D4899Q, which implies an exclusion of ions from the selectivity filter. The exclusion of Ca2+
ions is likewise seen from the RDF of ions around D4899 in RyR1-G4898R that shows decreased affinity of Ca2+ to D4899 compared to wild type (Figure 4D).
Thus, the introduction of a basic residue next to the acidic residues of the selectivity filter decreases ion binding in the selectivity filter, with the effect on Ca2+
being greater than on K+
.
Discussion
Elucidation of the structure-function relationship in RyR1 necessitates an atomistic model of its pore region. We constructed a model of the pore region that identifies the positions of residues critical to channel function. Furthermore, molecular dynamics simulations help us confirm the potential binding sites of ions along the pore. Considering the permeation time for different ions in RyR, our molecular dynamics simulations cannot sample statistically significant number of permeation events. However, the correlation between preferential ion occupancies seen in our simulations and experimentally measured selectivity both in RyR1-WT and its mutants suggests that preferential Ca2+
binding to the selectivity filter is a necessary but not a sufficient condition for selectivity. The charge space competition (CSC) model [30–32] provides one explanation for the selectivity for Ca2+over K+and
Na+
. The model attributes Ca2+
selectivity to the ability of Ca2+
(with a higher charge) to neutralize the carboxylate rich selectivity filter of Ca2+
channels by occupying the same space as Na+
(or lesser space than K+
). The ion occupancies seen in the selectivity filter in our simulations agree well with the CSC model for RyR1 [8,29]. An important consequence of both models is the identification of sites on the pore (4899D and 4900E) that have preferential affinity for Ca2+
compared to K+
and are experimen-tally shown to be sensitive to mutations.
Even though the cryoEM studies of Ludtkeet al. [13] provide
strong evidence for the structure and the orientation of helices forming the pore region, assigning the right sequence to this structure is essential for our simulations. Several biochemical and bioinformatics studies have predicted the pore-forming region of RyR1 with good agreement between each other. Balshawet al.
[33] first proposed that the pore forming region in RyR1 is located around 4894GGGIGD due to the striking similarity between this sequence and the selectivity filter of K+
channels including KcsA. Zhao et al. [22] performed several mutations on this highly
conserved region in RyR2 and observed dramatic effects on ion conduction properties. Gaoet al.[23] performed functional studies
on similar mutants in RyR1 that also highlighted the importance of these residues in ion conduction. Using the putative selectivity filter as an anchor and the predicted positions of the membrane spanning helix from hydrophathy plots, Welchet al.constructed a
homology model of the RyR2 pore region from KcsA [10]. In K+
channels, the sequence GXXXXA in the inner membrane spanning helix has been proposed to form the gating hinge [24]. The analogous glycine in RyR1 occurs in the 4934 position, in center of the inner helix predicted by hydropathy plots [34]. Figure 2. Ion permeation properties of RyR1-WT (top), RyR1-D4899Q (middle), and RyR1-G4898R (bottom) ion channels.Upper traces represent single channel currents (openings shown as downward deflections from the closed state (c–) recorded in symmetrical 250 mM KCl and 5mM free Ca2+
cis. Bottom traces represent single channel currents recorded at 0 mV following the addition of 10 mM trans Ca2+
Studies on triadin (a transmembrane protein known to interact with RyRs [35]) indicate that three of the acidic residues of RyR1 namely, D4878, D4907 and E4908 are essential for binding of triadin to RyR1 [36]. D4878 is located in the luminal loop that connects the pore helix to the rest of the transmembrane region of RyR1. D4907 and E4908 occur in the luminal loop connecting the pore helix to inner helix and are positioned after the selectivity filter. Binding of triadin in the luminal region of RyRs inhibits channel function experimentally, which can be inferred from our model too with respect to the positions of D4907 and E4908. Thus, the sequence assignments in our model are in good agreement with results of biochemical studies.
Although the cryo-EM data for the pore-region of RyR1 is obtained from the closed state of the channel, the inner helices of RyR1 resembles that of the potassium channels in the open state (MthK). The similarity in the inner helices of RyR1 and MthK implies that the inner helices of RyR1 need not undergo major conformational change during transitions from closed to open state. The structure of the selectivity filters of the closed and open states of potassium channels (MthK and KcsA) are essentially the same, which suggests that RyR1 selectivity filter may be modeled even from its overall closed state. Moreover, the results of our simulations are in good agreement with experimental data despite modeling the pore-structure from an overall closed state of the channel.
The residues forming the selectivity filter (GGGIGDE motif) are not the only determinants for selectivity and high conductance. There are acidic residues present in the inner helix, towards the cytosolic side, D4938 and D4945 whose mutation as predicted by PNP/DFT is experimentally shown to reduce K+ conductance
and selectivity [8,9]. The peaks in the K+
and Ca2+
occupancies in the cytosolic vestibule are found near the positions of these residues (Figure 4). Thus there are two regions in the pore that have high affinity for ions and are known to determine selectivity. One region is present in the luminal side along the selectivity filter, while the other is present in the cytoplasmic side of the pore. The presence of negatively charged sites on either side of the channel seen in our structural model is comparable to nicotinic acetylcholine receptor ion channel [37].
RyR1-G4898R is not responsive to Ca2+
and caffeine and does not bind ryanodine unlike RyR1-WT which points to major altered protein conformation of the mutant channel [28]. In single
Figure 3. Histogram of ion occupancies along the axis of the channel.(A) Schematic of the pore axis and the positions of residues along the pore axis. (B) RyR1-WT in 250 mM KCl. (C) RyR1-WT in 250 mM KCl and 70 mM CaCl2. (D) RyR1-WT with 125 mM CaCl2. The region
corresponding to selectivity filter is shaded in the plots. This region was determined from the distribution of z coordinates of Caof G4894 and
the carboxyl group of E4900 from each of the simulations. The average occupancy from 4 simulations is plotted in black, while lines corresponding to61 SD are plotted in brown.
doi:10.1371/journal.pcbi.1000367.g003
Table 2.Experimental characteristics of WT, RyR1-G4898R and RyR1-D4899Q.
K+
Conductivity
(pS)1 I
Ca(pA)2 PCa/K3 Caffeine4 Ryanodine5
Wild Type 801 22.8 7 + +
D4899Q 164 20.4 1 + +
G4898R 197 ,0.1 2 2 2
1K+conductivity in pS with 250 mM KCl.
2Ca2+
current recorded at 0 mV in symmetrical 250 mM KCl, 5mM free Ca2+ cis and 10 mM trans Ca2+.
3Selectivity of Ca2+over K+.
4Ca2+
release in response to caffeine.
5Ca2+
channel measurements, RyR1-G4898R mutant is constitutively open to K+ and it loses Ca2+ conductance and regulation by
pharmacological agents. Since we model only the pore region, the present study cannot predict the global structural changes that occur due to G4898R mutation. However, the local structural changes in the selectivity filter and the consequent loss of ion binding as seen in our simulations could account for our experimental observations on RyR1 mutants. The selectivity filters of ion channels are highly dynamic as evinced experimen-tally by the flickering of ion currents in single-channel measure-ments and structurally by the preponderance of glycines. The long, polar side chain of arginine in the selectivity filter could interact with other regions of the channel resulting in a selectivity filter that is structurally different from RyR1-WT This distortion may render the selectivity filter in a conformation that does not allow
Ca2+
conduction. In contrast to RyR1-G4898R, RyR1-D4899Q shows Ca2+
and caffeine dependent Ca2+
release and ryanodine binding comparable to RyR1-WT [5]. Maintenance of activity suggests that changes upon mutation are localized to the selectivity filter and our simulations can identify these changes.
Our simulations identifyab initiothe preferential localization of
Ca2+
ions near the side chain carboxyl groups of D4899, E4900, D4938 and D4945. This result is achieved without any prior knowledge of the ion positions with respect to the selectivity filter since the initial positions of ions in the simulations are all random. Without prior bias, we are able to reproduce Ca2+occupancies up
to 11.3 times higher than that of K+, which supports the accuracy
of the model of a Ca2+selective channel. RyRs are important
players in excitation-contraction coupling, which is fundamental to muscle contraction for movement and heart function. A mechanistic model of RyR1 will help us understand not only a functionally unique ion channel, but also shed light on an important physiological process.
Materials and Methods
Structural model for the pore-forming region
Our model is confined to the pore-forming region of the homotetrameric RyR1 channel. Both site directed mutagenesis and cryo electron microscopy (cryoEM) [13] have suggested that the RyRs have a pore architecture similar to K+
channels whose structure has been determined. Single particle cryo-EM studies on RyR1 detected several helix-like densities using the program SSEhunter [38,39]. SSEhunter quantitatively identifies densities in a cryoEM map that may represent secondary structure elements and outputs the length and orientation of the secondary structures that can be unambiguously identified from the cryoEM map. This tool has been validated in many studies [40–42]. Two of these helices in each subunit, a long membrane spanning helix kinked in the middle (inner helix) and a short helix in the luminal side of the membrane (pore helix) face each other and form the backbone of the channel pore. At the resolution of the cryo-EM densities the side chains of the helices could not be resolved. The coordinates of the backbone atoms of the pore helix and the inner helix were obtained from the cryo-EM studies [13]. The kink in the middle of the inner helix (G4934) was proposed to be analogous to the gating hinge of MthK channel [27]. Sequence comparison indicates that 4894GGGIG motif is analogous to selectivity filter motif Figure 4. Radial distribution function (RDF) of ions around the
carbonyl oxygens of 4899 and 4900.(A) RyR1-WT in 250 mM KCl and 70 mM CaCl2. (B) RyR1-WT in 250 mM KCl and 70 mM NaCl. (C)
RyR1-D4899Q in 250 mM KCl and 70 mM CaCl2. (D) RyR1-G4898R in
250 mM KCl and 70 mM CaCl2. The plots represent distribution of the
number of ions at a distance r from the centre of the carboxyl groups (amide group in Q) of D4899 and E4900. The graph axis starts at 2 A˚ and the peak occurs at the sum of van der Waal’s radii of oxygen and the ion. The average occupancy from 4 simulations is plotted. doi:10.1371/journal.pcbi.1000367.g004
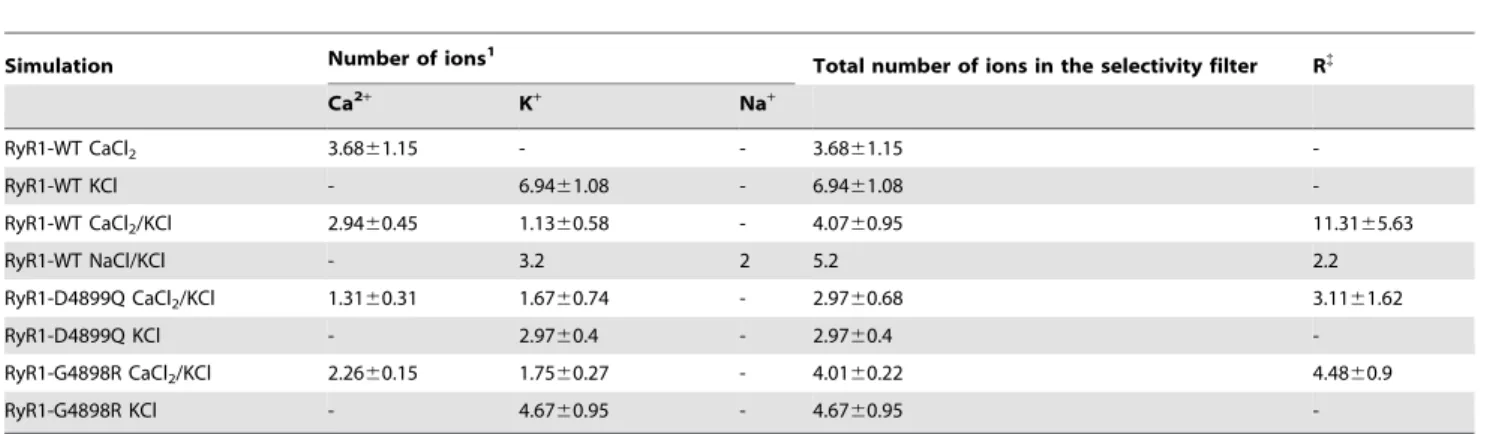
Table 3.Ion occupancy in the selectivity filter in different simulations.
Simulation Number of ions1 Total number of ions in the selectivity filter R{
Ca2+ K+ Na+
RyR1-WT CaCl2 3.6861.15 - - 3.6861.15
-RyR1-WT KCl - 6.9461.08 - 6.9461.08
-RyR1-WT CaCl2/KCl 2.9460.45 1.1360.58 - 4.0760.95 11.3165.63
RyR1-WT NaCl/KCl - 3.2 2 5.2 2.2
RyR1-D4899Q CaCl2/KCl 1.3160.31 1.6760.74 - 2.9760.68 3.1161.62
RyR1-D4899Q KCl - 2.9760.4 - 2.9760.4
-RyR1-G4898R CaCl2/KCl 2.2660.15 1.7560.27 - 4.0160.22 4.4860.9
RyR1-G4898R KCl - 4.6760.95 - 4.6760.95
-1In the selectivity filter, which is the shaded region shown in Figure 4 and Figure 5.
{
T[VI]GYG of K+
channels. Site directed mutagenesis suggests that 4899DE motif is also part of the selectivity filter of the RyRs. The sequence used in constructing the pore region corresponds to M4879–E4948 (Swissprot ID: P11716) [13]. The amino acid sequence corresponding to M4879-A4893 is assigned to the pore
helix while the sequence I4918-E4948 is assigned to the inner helix. In this sequence assignment, RyR1 has a long, 24-residue luminal loop (G4894-D4917), which is not visible in the cryo-EM reconstruction. Initial structure of the luminal loop is obtained by searching a database of loop structures found in SYBYL (Tripos, CA). To remove steric clashes between the loop and the helices, we further refine the loop conformation using the MODLOOP server [43], which predicts the loop conformations by satisfying spatial restraints. Using constrained all atom discrete molecular dynamics (DMD) [44], we perform simulations on the whole pore-forming region to constrain the distance between carboxyl oxygens of D4899 in the opposite monomers around 7 A˚ [25]. Finally, we optimize the rotamer states of all side chains using MEDUSA [45], a molecular modeling and design toolkit. Thus, we have directly used the structure of the helices identified by SSEhunter and the loop structure created using molecular modeling and low-resolution experimental constraints to create the final model of the pore structure of RyR1.
Molecular dynamics simulations
We perform molecular dynamics simulations using GROMACS [46,47] with the OPLSAA force field [48] modified with additional parameters for lipids [49] and ion parameters of Aqvist [50]. The RyR1 pore is placed in a pre-equilibrated DPPC bilayer with explicit solvation using genbox program in GROMACS, which removes all the water and DPPC molecules that have clashes with the pore as it is placed in the bilayer. We use the SPC model for water [51]. The simulation system shown in Figure S2A consists of the pore-forming tetramer, 405 DPPC molecules,,14000 water molecules and ions to make a neutral system. The concentrations of K+and Ca2+used in different simulations are shown in Table 1.
Berendsen weak temperature coupling [52] is used with a relaxation constant of 0.5 ps. A cut-off of 10 A˚ is used for Van der Waals interactions and long range electrostatics is treated with Particle Mesh Ewald [53] with a grid-spacing of 12 A˚ and a cutoff of 10 A˚. We perform the simulations at constant volume, with a vacuum of 2 nm thickness at the top and bottom of the simulation box, to maintain asymmetry of ion concentrations at the cytoplasmic and luminal side even in the presence of periodic boundary conditions [54]. In order to ensure that the introduction of a 2 nm slab of vacuum above and below our simulation system will not affect our results, we perform one set of simulations of RyR1-WT with KCl and CaCl2 by replacing the 2 nm slabs of vacuum with water
molecules. We calculate the ion occupancy ratios and the histogram of ion occupation along the channel axis (Table S1 and Figure S3). These results do not change the primary conclusions of this study. We observe a preferential occupation of Ca2+
over K+
in the selectivity filter with a ratio of 6.9 (within 1 SD of simulations with the vacuum slabs). However, due to the periodic boundary conditions, replacing the vacuum slab with water eliminates the partition between the cytosolic and luminal compartments, which then removes the partition between what was originally two compartments, and hence the concentration gradient.
Since the pore forming region is a small part of the entire membrane-spanning domain, the dynamics of the helices would depend on interactions with other regions of the membrane-spanning domain, which is not included in the present model. Hence, we focus on studying the interactions of the ions with the luminal loop and also the dynamics of the selectivity filter and the luminal loop. Therefore, harmonic restraints with force constants of 1000 kJmol21nm22 are imposed on the C, Ca, N, and O
atoms of the pore lining helices and the pore forming helices during the simulations. In the complete channel, the pore forming helix may not be in direct contact with the membrane, but to Figure 5. Histogram of ion occupancies along the axis of the
mutant channels.(A) RyR1-G4898R in 250 mM KCl. (B) RyR1-G4898R in 250 mM KCl and 70 mM CaCl2. (C) RyR1-D4899Q in 250 mM KCl. (D)
RyR1-D4899Q in 250 mM KCl and 70 mM CaCl2. The shaded region in
ensure minimal contact of water with the membrane spanning, pore forming helix, we surround the pore forming helix with lipids. Applying harmonic constraints on pore forming region can have dramatic effects on observed ion binding events [55]. However, in our simulations, the harmonic restraints is placed only on the pore helix and the inner helix, while the luminal loop (containing the selectivity filter) is unrestrained. The narrowest region of the pore is formed by the luminal loop, which is flexible in our simulations. The cytoplasmic side of the pore, like MthK has a much bigger volume and we predict the movement of the helix to be minimal in the time scale of our simulations and hence potential artifacts on ion binding due to the restraints on the protein should be minimal.
Simulation methodology
The simulation system is first subjected to 1000 steps of steepest descent energy minimization. We then perform an equilibration run for 5 ns where the protein is restrained, while the lipids, water molecules and the ions are allowed to equilibrate around the protein. A 15 (or 25) ns production run is initiated after the equilibration run. The trajectory used for analysis corresponds to 5–15 (or 5–25) ns of the production run. We carry out simulations in many ionic conditions, namely CaCl2, KCl, NaCl, CaCl2+KCl,
NaCl+KCl. The concentrations of ions used are shown in Table 1. Simulations are also performed on two pore mutants: RyR1-G4898R, RyR1-D4899Q.
Analysis
We calculate ion occupancy as a function of z coordinate (along the axis of the pore) by counting the number of ions in the shaded region shown in Figure S1B. We calculate the histogram of ion occupancy with a bin width of 1 A˚ , which provides a picture of the ion binding sites and ion occupancies along the axis of the channel. To quantify the preferential localization of the ions, we calculate the ratio of number of each type of ion in the selectivity filter, while accounting for the differential concentration of each ionic species. We denote this ratio as R:
Ri=j~
nsi=nti
ð Þ
nsj
nttj
wherensiis the number of ions of typeipresent in the selectivity
filter,ntiis the total number of ions of typeipresent in the luminal
side. Since there are no ion translocation events during our simulations,ntremains constant throughout the simulation time.ns
is calculated from the area under the curves shown in Figures 3 and 5, for each corresponding simulation.
To determine the specific binding locations of the ions, we calculate radial distribution functions (RDFs) of the ions around the side chain carboxyl oxygens of D4899 and E4900 of the selectivity filter.
To confirm that the system is equilibrated, we perform our analysis on shorter stretches (5 ns) of our trajectories and them with analysis performed over the whole length of the trajectories. The ion-occupancy histograms and the RDFs of the shorter stretches of the trajectory are similar to the longer complete trajectory, which confirms that the simulations are well equili-brated (data not shown).
Single channel recordings
Single channel measurements are performed using planar lipid bilayer method [5]. Proteoliposomes containing the purified recombinant RyR1s are added to the cis (SR cytosolic side)
chamber of a bilayer apparatus and fused in the presence of an osmotic gradient (250 mM cis KCl/20 mM trans KCl in 20 mM KHepes, pH 7.4, 2mM Ca2+
). After the appearance of channel activity, trans (SR lumenal) KCl concentration is increased to 250 mM. A strong dependence of single channel activities on cis Ca2+
concentration indicates that the large cytosolic ‘‘foot’’ region faces the cis chamber of the bilayers. The trans side of the bilayer is defined as ground. Electrical signals are filtered at 2 kHz (0.5 kHz for Ca2+
currents at 0 mV), digitized at 10 kHz, and analyzed as described [5].
Supporting Information
Figure S1 Histogram of ion occupancies along the axis of the channel. The distribution of ion occupancies along the axis of the channel is shown for simulation of RyR1-WT with 250 mM KCl and 70 mM NaCl. The region corresponding to selectivity filter is shaded in the plots. This region was determined from the distribution of z coordinates of Ca of G4894 and the carboxyl
group of E4900 from each of the simulations.
Found at: doi:10.1371/journal.pcbi.1000367.s001 (0.28 MB TIF)
Figure S2 The simulation system. (A) The simulation system consisting of the pore-forming tetramer (in blue), 405 DPPC molecules (in purple),,14000 water molecules (in red) and ions to make a neutral system with the concentration of K+
and Ca2+
fixed according to the simulation. Only two monomers are shown here for clarity. (B) Schematic for calculating ion occupancy as a function of the z co-ordinate (along the axis of the pore). We count the number of ions inside the pore (defined as the shaded region shown in the figure) as a function of the z co-ordinate and average it over the whole trajectory. This figure was created using PyMOL (http://pymol.sourceforge.net/).
Found at: doi:10.1371/journal.pcbi.1000367.s002 (5.96 MB TIF)
Figure S3 Histogram of ion occupancies along the axis of the channel from simulations with and without vacuum slabs. RyR1-WT in 250 mM KCl and 70 mM CaCl2. The shaded region in
the plot corresponds to the selectivity filter and this region was determined from the distribution of z component of the atomic coordinates of Caof G4894 and the carboxyl oxygen of E4900
from the simulation.
Found at: doi:10.1371/journal.pcbi.1000367.s003 (0.75 MB TIF)
Table S1 Ion occupancy in the selectivity filter from simulations with and without vacuum slabs.
Found at: doi:10.1371/journal.pcbi.1000367.s004 (0.01 MB PDF)
Author Contributions
Conceived and designed the experiments: SR AWRS LX GM NVD. Performed the experiments: SR AWRS LX GM NVD. Analyzed the data: SR AWRS LX GM NVD. Wrote the paper: SR AWRS LX GM NVD.
References
1. Fill M, Copello JA (2002) Ryanodine receptor calcium release channels. Physiol Rev 82: 893–922.
2. Franzini-Armstrong C, Protasi F (1997) Ryanodine receptors of striated muscles: a complex channel capable of multiple interactions. Physiol Rev 77: 699–729.
3. Liu QY, Lai FA, Rousseau E, Jones RV, Meissner G (1989) Multiple conductance states of the purified calcium release channel complex from skeletal sarcoplasmic reticulum. Biophys J 55: 415–424.
4. Dirksen RT, Avila G (2002) Altered ryanodine receptor function in central core disease: leaky or uncoupled Ca2+
5. Wang Y, Xu L, Pasek DA, Gillespie D, Meissner G (2005) Probing the role of negatively charged amino acid residues in ion permeation of skeletal muscle ryanodine receptor. Biophys J 89: 256–265.
6. Yang J, Ellinor PT, Sather WA, Zhang JF, Tsien RW (1993) Molecular determinants of Ca2+
selectivity and ion permeation in L-type Ca2+ channels. Nature 366: 158–161.
7. Tinker A, Lindsay AR, Williams AJ (1992) A model for ionic conduction in the ryanodine receptor channel of sheep cardiac muscle sarcoplasmic reticulum. J Gen Physiol 100: 495–517.
8. Gillespie D, Xu L, Wang Y, Meissner G (2005) (De)constructing the ryanodine receptor: modeling ion permeation and selectivity of the calcium release channel. J Phys Chem B 109: 15598–15610.
9. Xu L, Wang Y, Gillespie D, Meissner G (2006) Two rings of negative charges in the cytosolic vestibule of type-1 ryanodine receptor modulate ion fluxes. Biophys J 90: 443–453.
10. Welch W, Rheault S, West DJ, Williams AJ (2004) A model of the putative pore region of the cardiac ryanodine receptor channel 1. Biophys J 87: 2335–2351. 11. Shah PK, Sowdhamini R (2001) Structural understanding of the transmembrane domains of inositol triphosphate receptors and ryanodine receptors towards calcium channeling. Protein Eng 14: 867–874.
12. Doyle DA, Cabral J, Pfuetzner RA, Kuo A, Gulbis JM, et al. (1998) The structure of the potassium channel: molecular basis of K+
conduction and selectivity. Science 280: 69–77.
13. Ludtke SJ, Serysheva II, Hamilton SL, Chiu W (2005) The pore structure of the closed RyR1 channel. Structure 13: 1203–1211.
14. Radermacher M, Rao V, Grassucci R, Frank J, Timerman AP, et al. (1994) Cryo-electron microscopy and three-dimensional reconstruction of the calcium release channel/ryanodine receptor from skeletal muscle. J Cell Biol 127: 411–423.
15. Serysheva II, Hamilton SL, Chiu W, Ludtke SJ (2005) Structure of Ca2+ release channel at 14 A˚ resolution. J Mol Biol 345: 427–431.
16. Serysheva II, Orlova EV, Chiu W, Sherman MB, Hamilton SL, et al. (1995) Electron cryomicroscopy and angular reconstitution used to visualize the skeletal muscle calcium release channel. Nat Struct Biol 2: 18–24.
17. Yin CC, Han H, Wei R, Lai FA (2005) Two-dimensional crystallization of the ryanodine receptor Ca2+
release channel on lipid membranes. J Struct Biol 149: 219–224.
18. Orlova EV, Serysheva II, van Heel M, Hamilton SL, Chiu W (1996) Two structural configurations of the skeletal muscle calcium release channel. Nat Struct Biol 3: 547–552.
19. Liu Z, Zhang J, Wang R, Wayne Chen SR, Wagenknecht T (2004) Location of divergent region 2 on the three-dimensional structure of cardiac muscle ryanodine receptor/calcium release channel. J Mol Biol 338: 533–545. 20. Samso M, Wagenknecht T (2002) Apocalmodulin and Ca2+
-calmodulin bind to neighboring locations on the ryanodine receptor. J Biol Chem 277: 1349–1353. 21. Wagenknecht T, Radermacher M, Grassucci R, Berkowitz J, Xin HB, et al. (1997) Locations of calmodulin and FK506-binding protein on the three-dimensional architecture of the skeletal muscle ryanodine receptor. J Biol Chem 272: 32463–32471.
22. Zhao M, Li P, Li X, Zhang L, Winkfein RJ, et al. (1999) Molecular identification of the ryanodine receptor pore-forming segment. J Biol Chem 274: 25971–25974.
23. Gao L, Balshaw D, Xu L, Tripathy A, Xin C, et al. (2000) Evidence for a role of the lumenal M3-M4 loop in skeletal muscle Ca2+
release channel (ryanodine receptor) activity and conductance. Biophys J 79: 828–840.
24. Jiang Y, Lee A, Chen J, Cadene M, Chait BT, et al. (2002) The open pore conformation of potassium channels 1. Nature 417: 523–526.
25. Tinker A, Williams AJ (1993) Probing the structure of the conduction pathway of the sheep cardiac sarcoplasmic reticulum calcium-release channel with permeant and impermeant organic cations. J Gen Physiol 102: 1107–1129.
26. Zhou M, Morais-Cabral JH, Mann S, MacKinnon R (2001) Potassium channel receptor site for the inactivation gate and quaternary amine inhibitors. Nature 411: 657–661.
27. Jiang Y, Lee A, Chen J, Cadene M, Chait BT, et al. (2002) Crystal structure and mechanism of a calcium-gated potassium channel. Nature 417: 515–522. 28. Xu L, Wang Y, Yamaguchi N, Pasek DA, Meissner G (2008) Single channel
properties of heterotetrameric mutant RyR1 ion channels linked to core myopathies. J Biol Chem 283: 6321–6329.
29. Gillespie D (2008) Energetics of divalent selectivity in a calcium channel: the ryanodine receptor case study. Biophys J 94: 1169–1184.
30. Boda D, Valisko M, Eisenberg B, Nonner W, Henderson D, et al. (2007) Combined effect of pore radius and protein dielectric coefficient on the selectivity of a calcium channel. Phys Rev Lett 98: 168102.
31. Nonner W, Catacuzzeno L, Eisenberg B (2000) Binding and selectivity in L-type calcium channels: a mean spherical approximation. Biophys J 79: 1976–1992. 32. Nonner W, Eisenberg B (1998) Ion permeation and glutamate residues linked by
Poisson-Nernst-Planck theory in L-type calcium channels. Biophys J 75: 1287–1305.
33. Balshaw D, Gao L, Meissner G (1999) Luminal loop of the ryanodine receptor: a pore-forming segment? Proc Natl Acad Sci U S A 96: 3345–3347.
34. Williams AJ, West DJ, Sitsapesan R (2001) Light at the end of the Ca2+ -release channel tunnel: structures and mechanisms involved in ion translocation in ryanodine receptor channels. Q Rev Biophys 34: 61–104.
35. Guo W, Campbell KP (1995) Association of triadin with the ryanodine receptor and calsequestrin in the lumen of the sarcoplasmic reticulum. J Biol Chem 270: 9027–9030.
36. Lee JM, Rho SH, Shin DW, Cho C, Park WJ, et al. (2004) Negatively charged amino acids within the intraluminal loop of ryanodine receptor are involved in the interaction with triadin. J Biol Chem 279: 6994–7000.
37. Westbrook GL (2001) Ligand-gated ion channels. In: Sperelakis N, ed. Cell Physiology Source Book. 3rd ed. San Diego, CA: Academic Press. pp 675–687. 38. Baker ML, Ju T, Chiu W (2007) Identification of secondary structure elements in
intermediate-resolution density maps. Structure 15: 7–19.
39. Jiang W, Baker ML, Ludtke SJ, Chiu W (2001) Bridging the information gap: computational tools for intermediate resolution structure interpretation. J Mol Biol 308: 1033–1044.
40. Jiang W, Li Z, Zhang Z, Baker ML, Prevelige PE Jr, et al. (2003) Coat protein fold and maturation transition of bacteriophage P22 seen at subnanometer resolutions. Nat Struct Biol 10: 131–135.
41. Schmid MF, Sherman MB, Matsudaira P, Chiu W (2004) Structure of the acrosomal bundle. Nature 431: 104–107.
42. Zhou ZH, Baker ML, Jiang W, Dougherty M, Jakana J, et al. (2001) Electron cryomicroscopy and bioinformatics suggest protein fold models for rice dwarf virus. Nat Struct Biol 8: 868–873.
43. Fiser A, Sali A (2003) ModLoop: automated modeling of loops in protein structures. Bioinformatics 19: 2500–2501.
44. Dokholyan NV, Buldyrev SV, Stanley HE, Shakhnovich EI (1998) Discrete molecular dynamics studies of the folding of a protein-like model. Fold Des 3: 577–587.
45. Ding F, Dokholyan NV (2006) Emergence of protein fold families through rational design. PLoS Comput Biol 2: e85. doi:10.1371/journal.pcbi.0020085. 46. Berendsen HJC, van der Spoel D, Vandrunen R (1995) GROMACS: a
message-passing parallel molecular-dynamics implementation. Comput Phys Commun 91: 43–56.
47. Lindahl E, Hess B, van der Spoel D (2001) GROMACS 3.0: a package for molecular simulation and trajectory analysis. J Mol Model 7: 306–317. 48. Jorgensen WL, Tirado-Rives J (1988) The OPLS [optimized potentials for liquid
simulations] potential functions for proteins, energy minimizations for crystals of cyclic peptides and crambin. J Am Chem Soc 110: 1657–1666.
49. Tieleman DP, MacCallum JL, Ash WL, Kandt C, Xu ZT, et al. (2006) Membrane protein simulations with a united-atom lipid and all-atom protein model: lipid-protein interactions, side chain transfer free energies and model proteins. J Phys: Condens Matter 18: S1221–S1234.
50. Aaqvist J (1990) Ion-water interaction potentials derived from free energy perturbation simulations. The Journal of Physical Chemistry 94: 8021–8024. 51. Berendsen HJC, Postma JPM, van Gusteren WF, Hermans J (1981) Interaction
models for water in relation to protein hydration. In: Pullman B, ed. Intermolecular Forces. Dordrecht, The Netherlands: Reidel. pp 331–342. 52. Berendsen HJC, Postma JPM, Vangunsteren WF, Dinola A, Haak JR (1984)
Molecular-dynamics with coupling to an external bath. J Chem Phys 81: 3684–3690.
53. Essmann U, Perera L, Berkowitz ML, Darden T, Lee H, et al. (1995) A smooth particle mesh Ewald method. J Chem Phys 103: 8577–8593.
54. Bostick D, Berkowitz ML (2003) The implementation of slab geometry for membrane-channel molecular dynamics simulations. Biophys J 85: 97–107. 55. Allen TW, Andersen OS, Roux B (2004) On the importance of atomic