Vol.54, n. 6: pp.1335-1342, November-December 2011
ISSN 1516-8913 Printed in Brazil BRAZILIAN ARCHIVES OF
BIOLOGY AND TECHNOLOGY
A N I N T E R N A T I O N A L J O U R N A L
Beer Clarification with Polysulfone Membrane and Study on
Fouling Mechanism
Ricardo Cardoso de Oliveira
*and
Sueli Teresa Davantel de Barros
Departamento de Engenharia Química; Universidade Estadual de Maringá; Av. Colombo 5790; Bloco D90; 87020-230; Zona 7; Maringá - PR - Brasil
ABSTRACT
The aims of the present work were to study the relationship between the fluxes, permeate quality, and fouling mechanism. A polysulfone membrane with 100 KDa and 0.12 m2 of surface area was used. Permeate fluxes were measured for different pressures (0.5, 1.0, 1.5, and 2.0 bar) at the same temperature of 8 ºC. The fluxes measured for each pressure ranged from 22, 24, 27 and 30 kg h-1m-2at 0.5, 1.0, 1.5 and 2.0 bar, respectively. Samples of the feed and permeate were analyzed for pH, color, turbidity, sugar, bitterness, and proteins. The fouling mechanisms observed were cake filtration, partial pore blocking, and complete pore blocking.
Key words: Microfiltration, Polymer Membrane, Pore Blocking, Turbidity
*Author for correspondence: [email protected]
INTRODUCTION
Beer is the second most consumed beverage in the world after tea, and it continues to be a popular drink (Fillaudeau and Carrère, 2002). The conventional beer clarification process employs a filter press or pressure vessel filters, which are commonly pre-coated with porous particles of diatomaceous earth as filter aids (Gan, 2001). Environmental pressure on the use of diatomaceous earth has forced the industry to investigate new and alternative technologies. One such technology, crossflow filtration, has been studied in detail (Taylor et al., 2001). In the beer and wine industries, microfiltration, such as diatomaceous earth filtration, could be a promising alternative to the traditional clarification process, because it eliminates the residues generated by this kind of treatment and the need for filter aids. Microfiltration can also combine the clarification,
stabilization, and sterile filtration in one single continuous operation and can be used in all stages of beverage processing (Czekaj et al., 2000). The crossflow microfiltration technology has yet to become accepted by the industry because of the low flux caused by the fouling. The main reasons are the excessive fouling on the membrane surface with resulting low membrane fluxes, filtrate colloidal stability problems, and stripping of essential components (color and flavor) from the beer (Taylor et al., 2001).
The aim of the present work was to study the relationship between the fluxes, permeate quality, and fouling mechanism during beer clarification.
MATHEMATICAL MODEL OF FOULING MECHANISM
An important limitation in the performance of membrane processes is that the permeate flux is adversely affected by the transient build-up of a layer of rejected species at the membrane upstream interface. The general effect of these phenomena, known as concentration polarization, is a rapid permeate flux decay during the early period of filtration, followed by a long and gradual flux decline towards a steady, or nearly-steady-state limit value. However, a more important aspect of concentration polarization phenomena, which has to be considered, is related to the physicochemical
interactions of the accumulated material with the membrane. In this case, a fouling mechanism, such as adsorption on the membrane pore walls and pore plugging by the solute penetration occurs rather than the build-up of a particle cake layer at the interface.
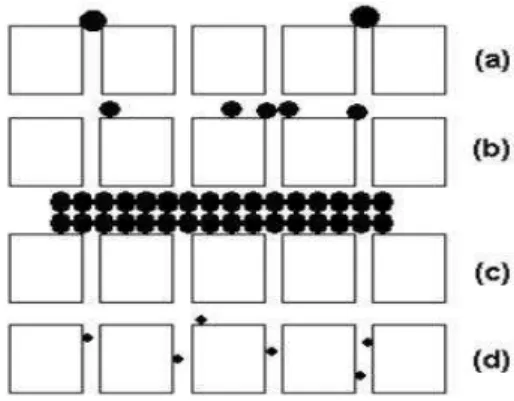
The various modes of pore blocking are a function of the solid/solute size and shape in relation to the membrane pore size distribution: complete pore blocking (the pore entrance is sealed); pore bridging (partial obstruction of the entrance) and internal pore blinding (material not rejected by the pore entrance is adsorbed or trapped on the pore wall or in the membrane support (Barros et al., 2003).
For process engineers designing systems it may be useful to classify the fouling as in-depth pore fouling, pore plugging and cake formation. The modes are illustrated in Figure 1.
Figure 1 - Mechanism for membrane fouling: (a) complete pore blocking; (b) partial pore blocking; (c) cake filtration; (d) internal pore blocking.
To account for the foulant removal mechanism from the membrane surface, a mathematical model able to describe the permeate flux decline
dt
dJ in cross-flow microfiltration has been
presented by Field et al. (1995) and Field et al. (1996). The model is based on classical constant pressure dead-end filtration equations (Hermia, 1982) that have been unified in the following general differential equation:
(
*)
2 n
J J k J dt dJ
− =
− − Eq.(1)
where J* can be considered a critical flux which
avoided.z In this work, J* was considered the limit value (Jlim)of the permeate flux attained in
the steady state conditions, in according to the reference (Giorgio et al, 1998);
k
andn
are phenomenological coefficient and general index, respectively, both depending on the fouling mechanism (Todisco et al, 1996).Complete Pore Blocking (
n
=2)When particles are larger than pore size, the membrane portion of the filtration area reached by the particles is blocked as a consequence of a complete pore obstruction by means of sealing (blocking). The resulting equation in this case is:
(
)
k tlim 0 lim 2 e J J J
J = + − − Eq.(2)
where
J
is the permeate flux, J0 is the initialpermeate flux (t=0)
The complete pore blocking reduces the membrane surface. Depending on the cross-flow velocity, permeate flux may be increased by increasing the applied transmembrane pressure (Todisco et al., 1996).
Partial Pore Blocking (
n
=1)As in the previous section, solid particles or macromolecules that at any time reach an open pore might seal it. Nevertheless, a dynamic situation of blocking/unblocking can occur. Also, particles may bridge a pore by obstructing the entrance without completely blocking it (Todisco et al., 1996). The equation is
− − = lim 0 lim 0 lim J J J J J J ln J 1 t σ Eq.(3)
where
σ
=
k
1.Cake Formation (
n
=0)Particles or macromolecules that do not enter the pores, form a cake on the membrane surface. The overall resistance consists of the cake resistance and the membrane resistance, which is assumed to remain, unchanged (Todisco et al., 1996). The resulting equation is
− − − − = 0 lim lim lim 0 0 2 lim J 1 J 1 J J J J J J J ln J 1 t
G Eq.(4) Eq.(4)
where
G
=
k
0.Internal Pore Blocking (
n
=1.5;J
lim=0)Particles enter the pores and are either deposited or adsorbed, thus reducing the pore volume. The irregularity of the pore passages causes the particles to become tightly fixed by blinding to the
pore. In this case, membrane resistance increases as a consequence of pore size reduction. Additionally, if internal pore blocking occurs, fouling becomes independent of crossflow velocity and no limiting value for the flux may be attained, that is,
J
lim = 0 (Todisco et al., 1996).t A ) 2 / K ( J 1 J
1 0.5
s 5 . 0 0 5 .
0 = + ′
Eq.(5)
where 1.5
5 . 0
s /2)A k
K
( ′ = , and A is the membrane area.
MATERIALS AND METHODS
Pilot plant and membrane
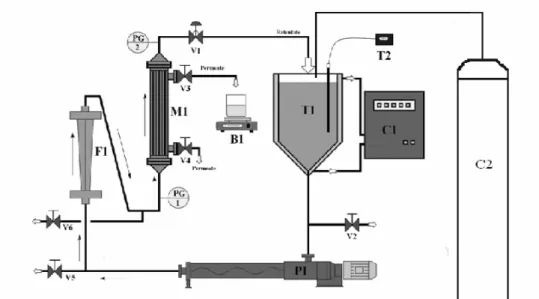
Experiments were carried out on a microfiltration unit (Fig. 2), which allowed to use a PVC module (M1) containing a polysulfone hollow fiber membrane, with a molecular weight cut-off of 100 KDa and 0.12 m2 of surface area. This module was connected by tri-clamp connections, allowing easy dismounting. The unit also contained a 5-L-capacity feed tank (T1), a pump (P1), a flowmeter (F1), two pressure gauges (PG1, PG2), one thermometer (T2), and gauges V1 to V6. The operating conditions were adjusted by the control of valves (V3 and V4) and of the pump motor rotation (P1) simultaneously. The beer temperature was maintained by water circulation in the tank jacket (C1). Gaseous nitrogen (C2) was injected into the feed tank (T1) to maintain the atmosphere free of O2.
Microfiltration procedure
Figure 2 - Schematic pilot plant.
The permeate mass control and the concentration factor (CF), are defined by the Eq.(6). When the CF reached the value of 1.4, the experiment was interrupted.
p f
f
V V
V CF
−
= Eq.(6)
where Vf and Vp are the total feed volume and permeate volume, respectively. Permeate flux was calculated according to Eq. (7), and the curve of J versus t was obtained for each run.
t
A
m
J
p.
=
Eq.(7)where mp is the permeate mass, A is the effective membrane area, and t is the time. To obtain the flux (J) as a volume ratio, J was divided by the beer density.
Physical and chemical analyses
Clarified and feed beer were analyzed for pH (at 25 ºC), color, turbidity, alcohol content, bitterness, protein, sugar reducer, real extract, primitive extract, apparent extract, and chill haze. The pH was measured by a Didimed DM20 pHmeter. Reducing sugar was estimated by the DNS – Berkeley method, modified by Zanin and de Moraes (1987). Protein was estimated by the Bradford method (1976). Alcohol content,
extract, and chill haze were measured according to AOAC methodology (1980). Color was measured by the absorbance at 430 nm. Turbidity was determined with a HACH DR/2010 portable data logging spectrophotometer. The analyses were made in triplicate and mean results have been shown in this work according to the membrane rejection coefficient (R), which was defined by:
− =
f
C C
R(%) 100 1 p Eq.(8)
where Cf is the concentration of solute in the feed stream and Cp is the concentration of solute in the permeate. This parameter is based on studies of how solute molecules are rejected by membranes. A solute will pass through a membrane if it is small enough to pass through a pore, if it does not significantly interact with the membrane, and if it does not interact with other (larger) solutes (Coulson et al., 1996).
RESULTS AND DISCUSSION
Flux comparison
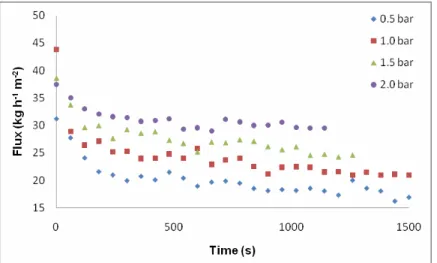
tangential microfiltration process curve. After a sharp initial flux decline due to membrane compaction and concentration polarization, the flux stabilized at about 150 min. The fluxes obtained at each pressure were 22, 24, 27 and 30 kg h-1 0.5, 1.0, 1.5 and 2.0 bar, respectively. The
permeate flux increased with the pressure increase, and with constant temperature. The pressure increase caused an increase in the permeate flux, 8.76% for the pressure of 1.0 bar, 22.6% for 1.50 bar, and of 36.2% for 2.0 bar, in relation to pressure of 0.50 bar.
Figure 3 - Polysulfone hollow fiber membrane performance in beer filtration at different pressures.
Gan (2001), using ceramic membranes with nominal pore diameter of 0.5
µ
m at 2.0±
0.7 ºC, 0.8 bar and a backflushing program, had reported flux around 20 kg h-1 m-2, but when he used reversed membrane under the same conditions, he reported a flux around 50 kg h-1 m-2. Eagles and Wakeman (2002), using a 0.2µ
m cellulose nitrate membrane at 20 ºC with crossflow velocity of 2 m/s, and transmembrane pressure of 19 bar, obtained a steady flux of 250 L h-1m-2. Fillaudeauand Carrère (2002) reported that the flux of ceramic membranes with nominal pore size of 0.1-0.8
µ
m was 15-35 L h-1 m-2 at 1 ºC and 1-2 bar of transmembrane pressure.Analysis comparison
The percentile rejection coefficients of all the physical and chemical analysis parameters investigated are shown in Table 1.
Table 1 - Percentile rejection of physical and chemical analyses.
R (%)
Parameters 0.5 bar 1.0 bar 1.5 bar 2.0 bar
Sugar 15.5 24.1 27.3 21.3
Alcohol 1.49 0.680 -1.87 -1.15
Bitterness 44.9 45.0 40.7 48.9
Protein 84.7 82.3 72.9 79.5
Primitive extract 8.00 10.1 10.9 11.3
Real extract 57.7 28.1 32.0 30.0
Apparent extract 31.9 44.1 50.8 48.3
Chill haze 97.5 95.2 92.6 94.8
Color 34.2 29.1 40.5 39.0
An irregular percentile of rejection of all physical and chemical parameters analyzed, except primitive extract, which increased with pressure rise, coul be observed. Gan et al. (2001) attributed this to fouling, which caused a gradual reduction in the effective pore size, further flux decline, and a membrane selectivity change. In the alcohol content, a low percentile rejection coefficient for the pressures of 0.50 and 1.0 bar was noticed, while for the pressures of 1.5 and 2.0 bar, the percentile rejection coefficient had a negative value as the alchohol content was higher, but the values of percentile of rejection were too small when they were compared to the other percentile of rejection coefficients, which allowed to infer that the alcohol content stayed practically constant during the tests.
The pH of all samples was 4.50 and it was constant in all tests. The transmission of alcohol and pH were little affected during the filtration, as the investigated beers were constituted by very small molecules, according to Gan et al. (2001). The transmission of protein was affected in all the tests. It was caused by the reduction in the effective pore size and because these molecules were bigger than the membrane “cut-off” pore size. Bitterness, real extract, and apparent extract transmission were affected too. According to Fillaudeau and Carrère (2001), the chemical diversity and large size range of the particles
responsible for the beer haze make achieving clarification with the membrane process difficult, but the reduction of chill haze in beer clarification with a polysulfone membrane was good in all the tests, and the most significant result were obtained at 0.50 bar.
Kuiper et al. (2002), using ceramic membranes at 5 ºC, reported a percentile of rejection for chill haze equal to 97.2% for a membrane of 0.8-
µ
m circle pores and 95.9% for a membrane of 1.5-µ
m circle pores.Study of fouling mechanism
To identify the mechanism of fouling during beer ultra-filtration, the model parameter
k
andn
estimation was carried out according to the nonlinear regression optimization procedure usedin the program MATLAB
. For each set J X tof experimental data, a series of four optimization runs were performed sequentially by assigning (
n
= 0, 1, 1.5, 2) and the corresponding steady state valueJ
lim already observed experimentally. The values of sum of the squares of the residuals (SSDD) between the numerical predictions and the experimental data was the criterion used to choose the optimum value ofn
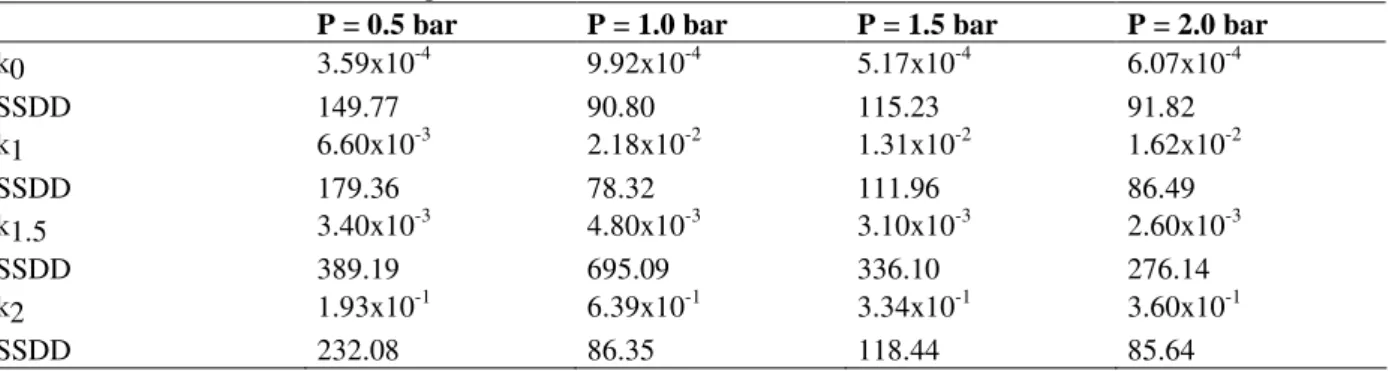
and establish the fouling mechanism, which as shown in Table 2.Table 2 - Values of the sum of the squares and coefficients of the residual criterion.
P = 0.5 bar P = 1.0 bar P = 1.5 bar P = 2.0 bar
k0 3.59x10⁻⁴ 9.92x10⁻⁴ 5.17x10⁻⁴ 6.07x10⁻⁴
SSDD 149.77 90.80 115.23 91.82
k1 6.60x10⁻³ 2.18x10⁻² 1.31x10⁻² 1.62x10⁻²
SSDD 179.36 78.32 111.96 86.49
k1.5 3.40x10⁻³ 4.80x10⁻³ 3.10x10⁻³ 2.60x10⁻³
SSDD 389.19 695.09 336.10 276.14
k2 1.93x10⁻¹ 6.39x10⁻¹ 3.34x10⁻¹ 3.60x10⁻¹
SSDD 232.08 86.35 118.44 85.64
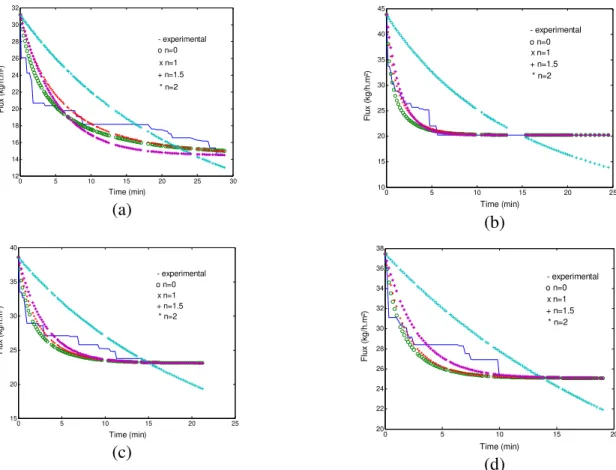
In agreement with Table 2, the fouling mechanisms that supplied the smallest SSDD values were pressure of 0.50 bar with n = 0, or cake filtration; pressure of 1.0 bar with n = 1, or partial pore blocking; pressure of 1.5 bar with n = 1 or partial pore blocking, and pressure of 2.0 bar with n = 2, or complete pore blocking. Therefore, for the smallest pressure, the experimental
0 5 10 15 20 25 30 12 14 16 18 20 22 24 26 28 30 32 Time (min) F lu x ( k g /h .m ²) - experimental o n=0 x n=1 + n=1.5 * n=2
(a)
0 5 10 15 20 25
10 15 20 25 30 35 40 45 Time (min) F lu x ( k g /h .m ²) - experimental o n=0 x n=1 + n=1.5 * n=2
(b)
0 5 10 15 20 25
15 20 25 30 35 40 Time (min) F lu x ( k g /h .m ²) - experimental o n=0 x n=1 + n=1.5 * n=2
(c)
0 5 10 15 20
20 22 24 26 28 30 32 34 36 38 Time (min) F lu x ( k g /h .m ²) - experimental o n=0 x n=1 + n=1.5 * n=2
(d)
Figure 4 - Fouling mechanism at different pressures for polysulfone fiber membrane: (a) 0.50 bar, (b) 1.0 bar, (c) 1.5 bar, (d) 2.0 bar.
CONCLUSION
In conclusion, this study showed the beer components that were responsible for the color, flavors, proteins, and bitterness and that give the aspect od “wholesome” beer were retained in beer clarification with a polysulfone membrane with a molecular weight cut-off of 100 KDa. The chill haze had an excellent reduction, which was very valued by the industry.
Increase in the transmembrane pressure, the permeate flow increased. The models showed that the decline in the permeate flow over time was caused by different types of pore blockage, such as cake formation at 0.50 bar, partial blocking at 1.0 and 1.5 bar, and internal blocking at 2.0 bar.
ACKNOWLEDGEMENTS
The authors would like to thank CNPq for the financial support given to this project.
REFERENCES
AOAC – Official Methods of Analysis of the Association of Official Analytical Chemists (1980), William Horwitz editor, 13th Edition, 162 – 170. Barros, S.T., Andrade, C.M.G., Mendes, E.S., Peres, L.
(2003), Study of fouling mechanism in pineapple juice clarification by ultrafiltration, J. memb. sci.,
215, 213-224.
Bradford, M. M. (1976), A rapid and sensitive method for the quantization of microgram quantities of protein utilizing the principle of protein-dye binding.
Anal. biochem.,72, 248-254.
Burrell, K.J. Reed, R.J.R. (1994), Crossflow microfiltration of beer: Laboratory-Scale studies on the effect of pore size. Filtr. sep.31, 399-405. Coulson, J.M., Richardson, J.F., Backhurst, J.R.;
Harker, J.H. (1996), Chemical Engineering – Particle Technology and Separation Processes, 4th edition, New York, pp 872.
Eagles, W.P., Wakeman, R.J. (2002), Interactions between dissolved material and the fouling layer during microfiltration of a model beer solution, J. memb. sci., 206, 253-264.
Field, R. W., Wu, D., Howell, J. A., Gupta, B. B. (1995), Critical flux concept for microfiltration fouling. J. memb. sci.,100, 250 – 272.
Field, R. W., Wu, D., Howell, J. A., Gupta, B. B. (1996), Mass transport and the design of membrane system, In: Scott, K. and Hughes, R., Industrial Membrane Separation Technology, Chapman and Hall, London, pp. 93.
Filladeau, L., Carrère, H. (2002), Yeast cells, beer composition and mean pore diameter impacts on fouling and retention during cross flow filtration of beer with ceramic membranes, J. memb. sci.,196, 39-57.
França Neta, L.S., Habert, A.C., Borges, C.P., Cerveja Microfiltrada: Processo e Qualidade. Braz. j. food technol., 5º SIPAL, 130-137.
Gan; Q. (2001), Beer clarification by crossflow microfiltration – effect of surface hydrodynamics and reversed membrane morphology, Chem Eng Process,
40, 413-419.
Gan, Q., Howell, J.A., Field, R.W., England, R., (2001), Beer clarification by microfiltration – Product quality control and fractionation of particles and macromolecules, J. memb. sci.,194, 185-191. Giorno, L., Todisco, S., Donato, L. E. D., Drioli,
E.(1998), Study of fouling phenomena in apple juice clarification by enzyme membrane reactor, Separ Sci Tech,33 (5), 739-756.
Hermia, J., (1982), Constant pressure blocking filtration laws. Applications to power – law non-Newtonian fluids. Trans Ichem. E.,60, 183-187.
Kuiper, S.; Rijn, C.V.; Nijdam, W.; Raspe, O.; Wolferen, H.V.; Krijnen, G.; Elwenspoek, M. (2002), Filtration of lager beer with microsieves: flux, permeate haze and in-line microscope observations”,
J. memb. sci.,196, 159-170.
Reed, R. (1998), Current and future roles of membrane in brewing. Memb. Tech.,101, 5-8.
Taylor, M.; Faraday, D.B.F; O’Shaughnessy; Underwood, B.O.; Reed, R. J.R. (2001), Quantitative determination of fouling layer composition in the microfiltration of beer”, Separ Purif Tech, 22-23, 133-142.
Todisco, S., Penã, L., Drioli, E., Tallarico, P. (1996), Analysis of the fouling mechanism in microfiltration of orange juice. J. Food Process. Preserv., 20, 453-466.
Zanin, G. M., Moraes, F. F. (1987), Tecnologia de imobilização de células e enzimas aplicada à produção de álcool de biomassas – Relatório de Pesquisa nº 2/UEM, p. 315 – 321, Maringá – PR.