Article
Printed in Brazil - ©2017 Sociedade Brasileira de Química0103 - 5053 $6.00+0.00
*e-mail: [email protected]
Effect of PVA
Concentration on Structure and Performance of Precipitated
Iron-Based Catalyst for Fischer-Tropsch Synthesis
Cailian Ma,a Guanghua Dong,a Xia Liua and Jiangang Chen*,b
aShanxi Institute of Energy, Jinzhong, 030600 Shanxi, P. R. China
bState Key Laboratory of Coal Conversion, Institute of Coal Chemistry,
Chinese Academy of Sciences, 030001 Taiyuan, P. R. China
Fe2O3 catalysts were prepared by co-precipitation method with the assistance of polyvinyl
alcohol (PVA) for Fischer-Tropsch synthesis. Effects of PVA concentration on structure and
performance of the catalyst were investigated in a fixed reactor at 230-310 °C, 1.5 MPa, 2000 h-1,
and syngas H2/CO = 2.0. The catalysts were characterized by N2 adsorption, scanning electron
microscopy (SEM), transmission electron microscopy (TEM), X-ray diffraction (XRD), H2 or CO
temperature-programmed reduction (TPR) and H2 temperature-programmed desorption (H2-TPD),
Fourier transform infrared (FTIR) spectra and thermogravimetric analysis (TGA). It was found that there was strong interaction between Fe and PVA, which controlled the structure of the catalyst. Among the catalysts investigated, the catalyst prepared with 15 wt.% PVA exhibited better catalytic performance due to the dispersion of iron oxides and the formation of the more active phase on the catalyst. Meanwhile, this catalyst showed the high selectivity to heavy hydrocarbons and satisfactory thermal stability.
Keywords: Fischer-Tropsch synthesis, iron-based catalyst, PVA concentration, structure,
stability
Introduction
Fischer-Tropsch synthesis (FTS), an efficient technology to convert syngas into liquid fuels and chemicals, has attracted great interest due to the shrinking of the petroleum resource in the past decades.1 Iron-based catalysts have
attracted considerable focus, thanks to their low cost, high activity and excellent water-gas-shift reactivity, which match coal gasification with low H2/CO ratio.2 Remarkably,
three principal challenges are posed for iron-based FTS catalyst: activity, selectivity and stability.3
It is well known that the activity, selectivity and stability of FTS catalysts rely strongly on the texture and surface properties of the resultant catalysts.4 Most
of all, the pore size of catalyst is one of the key factors, which has significant effect on the mass transfer of reactants and products,5 the re-adsorption of the α-alkene,
and the chemisorption ratio of H2 on the surface active
sites exposed.6 Therefore, these factors are vital for the
performance of catalyst in the FTS. For instance, smaller pore size of catalyst can afford high Brunauer, Emmett and
Teller (BET) surface area and dispersion of the catalyst. However, diffusion effects of products were limited, resulting in light hydrocarbons as the main product for excessive hydrogenation. In contrast, the larger pore size of catalyst can facilitate the diffusion of products, and thus products of heavy hydrocarbons are obtained.7 Tao et al.8
proposed that the FTS catalytic activity and product selectivity rely strongly on the pore size distribution of the catalysts. Xiong et al.9 found that CO conversion
increased and then decreased with the pore size in the range studied. Sun and co-workers10,11 reported that the
FTS catalytic performances were closely correlated to the pore sizes of the mesoporous zirconia.
In general, the preparation process has a significant effect on the physical property and catalytic performance of the catalyst. The iron-based catalysts were mainly prepared by the co-precipitation,4,9 fusion,3 sol-gel,12
microemulsions13 method and so on.14,15 However, the
microemulsions exhibit large surface areas, but have small pore size. In order to modulate pore size of resultant, co-precipitation with the assistance of surfactant method was adopted to prepare catalyst. In the preparation process, the size and shape of resultant can be controlled by adopting surfactants, as powerful agents, for the strong interaction between surfactants and crystal surfaces.16 In addition,
surfactants are attractive as template for controlling to growing new crystalline materials in the preparation process, which have shown potential applications in many fields such as catalysis,17 electrochemistry,18
and so on.19,20 Luo et al.17 investigated the CuO-CeO 2
catalysts prepared by a surfactant-templated method, and they found that the CuO-CeO2 catalysts showed high
catalytic activity for selective oxidation of CO in excess H2 at relatively low temperature. Fang and co-workers20
recently prepared the Cu/ZnO/Al2O3 (CZA) catalysts by
two-step precipitation method with the assistance of the surfactant. They found that the 2T-CZA catalyst, prepared with addition of 2 wt.% tetraethylammonium hydroxide (TEAH) in the course of the co-precipitation of Cu2+ and
Zn2+, exhibited satisfactory stability. However, to the best
of our knowledge, the effect of co-precipitation method with the assistance of surfactant on the FTS performance of iron catalyst was rarely reported.
In this work, a series of iron-based catalysts with different polyvinyl alcohol (PVA) concentrations were prepared by co-precipitation method with the assistance of PVA, and systematically investigated the effect of PVA concentrations on the structure, the catalytic activity and the stability.
Experimental
Catalyst preparation
Reagents were all of analytically pure (AR) grade. Water used in the synthesis and washing was deionized. The iron catalysts with different PVA concentrations were prepared by co-precipitation method. For a typical synthesis, 30 mmol Fe(NO3)3·9H2O was added into a solution of
PVA (0, 5, 15, 25 wt.%). After the mixture was stirred for 0.5 h, ammonium solution (20 wt.%) was simultaneously added into the precipitated vessel maintained at a constant pH value of 8.5 ± 0.1. The obtained precipitates were aged for 2 h and washed with deionized water. After that, the catalyst precursors were dried at 100 °C for 6 h, followed by calcination at 500 °C for 6 h in air. In this study, the catalysts prepared by co-precipitation with 0, 5, 15 and 25 wt.% of PVA were marked as Fe2O3, Fe2O3-PVA-1,
Fe2O3-PVA-2 and Fe2O3-PVA-3, respectively.
Catalyst characterization
Brunauer-Emmett-Teller (BET) surface area of the catalysts was measured by nitrogen sorption at –195.8 °C with a TriStar 3000 Gas Absorption Analyzer. The pore diameter was calculated by applying the Barret-Joyner-Halenda method (BJH) to the adsorption branches of the N2 isotherms. The samples were degassed at 200 °C and
6.7 Pa for 2 h prior to the measurement.
The morphology of catalysts was investigated by scanning electron microscopy (SEM) (JSM-6701F). The samples were prepared through anchoring on the surface of the conducting resin, and then needed to be treated with spray-gold before observing.
Transmission electron microscopy (TEM) images of the catalysts were obtained by using a JEM 2010 microscope operating at 200 kV. The catalysts were dispersed in ethanol and mounted on a carbon foil supported on a copper grid.
X-ray diffraction (XRD) measurements were carried out with a D/max-RA X-ray diffractometer (Rigaku), equipped with Cu Kα radiation (λ = 1.5406 Å) at 40 kV and 150 mA. The measurements were made at room temperature in the 2θ range of 10-80° with a scanning rate of 2 or 4° min-1.
H2 temperature-programmed reduction (H2-TPR)
experiment was performed in a conventional atmospheric quartz reactor (5 mm internal diameter, i.d.). A flow of 5:95 (v/v) H2/Ar, maintained at a flow of 50 mL min-1,
was used as the reduction gas, and the TPR profiles were recorded by using the response of the thermal conductivity detector (TCD) of the effluent gas. Typically, 50 mg samples were loaded and reduced by 5:95 (v/v) H2/Ar, from
the temperature rising from room temperature to 1000 °C at a rate of 10 °C min-1.
CO-TPR experiment was carried out in a Micromeritics AutoChem II 2920 analyzer. In CO-TPR experiment, about 50 mg of catalyst was loaded in an atmospheric quartz reactor (5 mm i.d.). The catalyst sample heated in a flow of 5:95 (v/v) CO/He from room temperature to 500 °C at a heating rate of 10 °C min-1, and the flow rate of gases
was 50 mL min-1. The reduction products were analyzed
by TCD.
H2-TPD experiments were performed with Ar as carrier
gas at a flow rate of 50 mL min-1. 200 mg of catalyst was
charged into the quartz reactor. The catalyst was at first reduced with H2 at 350 °C for 10 h. The catalyst sample
was purged with Ar and calcined in situ at 350 °C for 1 h
to remove the adsorbed species. In the following steps, H2
Subsequently, the TPD was started from room temperature to 900 °C at a heating rate of 10 °C min-1.
Fourier transform infrared (FTIR) spectra were recorded in the 400-4000 cm-1 range with a Bruker Vertex
70 FT-IR, using the KBr pellet technique. The pellets were prepared by a KBr/sample weight ratio of 200/1.
Thermogravimetric analysis (TGA) was conducted on a thermogravimetric analyzer of Setsys Evolution TGA 16/18 in nitrogen atmosphere from ambient temperature to 650 °C with a heating rate of 10 °C min-1.
Catalytic activity
The FTS performance of the catalysts was tested in a stainless steel fixed-bed reactor with inner diameter of 12 mm. A 2 mL of catalyst (60-80 mesh) was diluted with 4 mL of quartz granules (60-80 mesh) and then loaded into the reactor for all the reaction tests. The mass of catalyst is listed in Table 1. The remaining volume of the reactor tube was filled with quartz granules. All the catalysts were activated with syngas (H2/CO = 2.0) at 280 °C,
0.30 MPa, and 1000 h-1 for 24 h. The reaction conditions
were maintained at 1.5 MPa, 2000 h-1, and H
2/CO = 2.0.
Wax was collected with a hot trap and the liquid products were collected in a cold trap. The gas effluents were analyzed on-line by using Carbosieve-packed column with TCD. The gas hydrocarbons were analyzed on-line using Porapack-Q column with FID. Oil and wax were analyzed offline in OV-101 capillary columns. 5% N2 was
added to syngas as an internal standard. After reaction, used catalysts were cooled down in Ar and passivated by CO2 for 1.5 h at room temperature, and the flow rate
of gases was 30 mL min-1. The carbon balance and mass
balance were 100 ± 5%.
Results and Discussion
Textural properties of catalysts
The N2 physisorption was carried out to evaluate the
textural properties of the Fe2O3, Fe2O3-PVA-1, Fe2O3-PVA-2
and Fe2O3-PVA-3 catalysts. The N2 adsorption-desorption
for the Fe2O3 catalyst (Figure 1) shows a typical type-IV
isotherm with type H1 hysteresis loop, demonstrating mesoporous characteristics for Fe2O3 material. Moreover,
the mesoporous Fe2O3 exhibits a narrow pore size
distribution centered at 11.8 nm calculated from BJH method (inset of Figure 1). It is worth noting that the Fe2O3-PVA catalyst shows a type-IV isotherms with type
H3 hysteresis loop (Figure 1), indicating that the retention of well-defined slit-like mesostructure. In addition, the pore size of Fe2O3-PVA catalyst is much larger than that of the
Fe2O3 catalyst (inset of Figure 1 and Table 1). According to
the data in Table 1, the BET surface area of Fe2O3-PVA-1,
Fe2O3-PVA-2 and Fe2O3-PVA-3 catalysts suffer from an
evidently decrease compared with that of the Fe2O3 catalyst,
probably owing to the FeOOH precursors could self-assemble with the assistance of PVA,21,22 but they possess
larger pore size, which helps the diffusion of products.
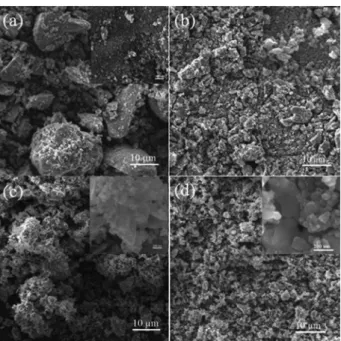
SEM and TEM results
The SEM images of the catalysts as-prepared are shown in Figure 2. For the Fe2O3 catalyst (Figure 2a), the samples
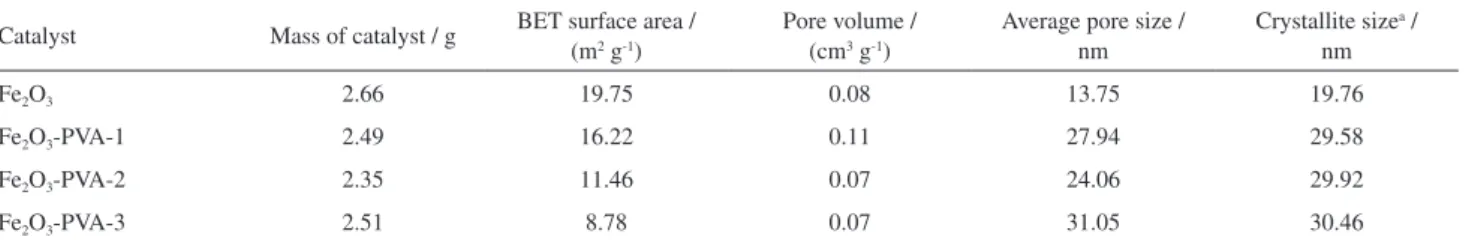
Table 1. Physical properties of the catalysts as-prepared
Catalyst Mass of catalyst / g BET surface area / (m2 g-1) Pore volume / (cm3 g-1) Average pore size / nm Crystallite sizenm a /
Fe2O3 2.66 19.75 0.08 13.75 19.76
Fe2O3-PVA-1 2.49 16.22 0.11 27.94 29.58
Fe2O3-PVA-2 2.35 11.46 0.07 24.06 29.92
Fe2O3-PVA-3 2.51 8.78 0.07 31.05 30.46
aCalculated from the Scherrer equation according to the (104) diffraction peak of Fe
2O3; BET: Brunauer-Emmett-Teller.
Figure 1. Nitrogen adsorption-desorption isotherms and BJH pore diameter distribution plot (inset, branch of desorption) of the (a) Fe2O3;
mainly consisted of spherical-shaped particles with sharp edges presenting irregular shaped.23 Some of the smaller
particles are attached to the surface of the larger ones. In the case of the Fe2O3-PVA-1 catalyst, the particles show
short rod shape (Figure 2b), attributed to the particle reforming after addition PVA in preparing. Meanwhile, the particle size of the Fe2O3-PVA-1 catalyst is larger
than that of the Fe2O3 catalyst. With a further increase
of PVA concentration, Fe2O3-PVA-2 catalyst displays
loosely uniform flowery shape consisting of flake shape (Figure 2c). However, the Fe2O3-PVA-3 catalyst exhibits
destruction of flowery shape consisting of flake shape (Figure 2d). The Fe2O3-PVA-2 catalyst is loosely uniform
flowery shape in the morphology requirement for easy gas diffusion and mass transport during FTS reaction. In the preparation process, the destruction of the spherical shape should be responsible for the different particles shape, which is closely related to the amount of PVA contained in the precursor obtained from the precipitation reaction.
The TEM images of the catalysts as-prepared are shown in Figure 3. Fe2O3 catalyst has a particle diameter
of around 20 nm (Figure 3a, inset). Fe2O3-PVA-1 is in the
shape of rods with a width of about 35 nm and a length of 60-300 nm (Figure 3b, inset). Meanwhile, nanoparticles of Fe2O3-PVA-2 catalyst (about 35 nm) arrange at random
and form a loosely flake microstructure (Figure 3c, inset). However, nanoparticles of Fe2O3-PVA-3 catalyst
(about 50 nm) have a relatively dense and irregular flake structure (Figure 3d, inset). The results demonstrate that structure and particle size of the Fe2O3-PVA catalyst can
be controlled by tuning PVA concentrations during the catalyst preparation process. Different structure of catalyst will further influences dispersion of catalyst.
Crystallite structure of catalysts
The XRD patterns of the catalysts as-prepared with different PVA concentrations are presented in Figure 4a. It is obvious that the only detectable phase in all of catalysts as-prepared is well-crystallized hematite (JCPDS Card No. 033-0664) with characteristic diffraction peaks at 2θ values of 24.2, 33.1, 35.6, 40.8, 49.52, 54.0, 57.6, 62.5 and 64.0°. It is obvious that the average crystalline size of α-Fe2O3 of Fe2O3-PVA catalyst (about 30 nm) is larger
than that of the Fe2O3 catalyst (about 20 nm). It implies that
Figure 2. SEM images of (a) Fe2O3; (b) Fe2O3-PVA-1; (c) Fe2O3-PVA-2;
(d) Fe2O3-PVA-3 catalysts.
Figure 3. TEM images of (a) Fe2O3; (b) Fe2O3-PVA-1; (c) Fe2O3-PVA-2;
(d) Fe2O3-PVA-3 catalysts.
the addition of PVA in the catalyst preparation process can promote the aggregation of α-Fe2O3 crystallite. In addition,
the diffraction peak intensity of α-Fe2O3 increases with the
increase of PVA concentration. This is consistent with the observed decrease in the catalyst surface area.
The XRD patterns of the catalysts after reaction are shown in Figure 4b. There are several diffraction peaks assigned to dilute quartzes for all catalysts. It is obvious that the spent Fe2O3 catalyst and Fe2O3-PVA catalyst
show only magnetite (JCPDS Card No. 085-1436) phase with characteristic diffraction peaks at 2θ values of 35.5, 43.1, 57.0 and 62.6°. All catalysts present sharp and strong intensity. Since the iron carbides can be oxidized to Fe3O4, especially for the unsupported iron catalyst,24-26
it is impossible to be observed in the XRD patterns of all catalysts. In addition, the XRD patterns also show that the diffraction peak intensities of Fe3O4 clearly decrease
with the increase of PVA concentration and pass through a minimum at the PVA concentration of 15 wt.%. It indicates that the catalyst with addition of PVA during catalyst preparing process inhibits formation of the magnetite in FTS reaction. It is well known that although magnetite is the most active phase for the water-gas-shift (WGS) reaction on iron-based catalysts,27 this phase is not active for FTS. Davis
and co-workers28 reported that magnetite alone showed no
initial activity when being exposed to syngas.
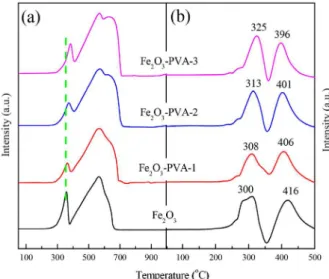
Reduction and carburization behaviors
Catalysts reduction and carburization behaviors were studied by H2-TPR and CO-TPR. The H2-TPR profiles are
shown in Figure 5a. It is reasonable to assume that only the Fe2O3 phase is primarily present after calcination based
on the similar TPR profiles for all catalysts. As shown in Figure 5a, the profile of Fe2O3 and Fe2O3-PVA catalysts
shows multiple reduction peaks, which can be assigned to two different reduction stages of iron oxides. The first stage (lower-temperature reduction peak) is assigned to the transformations of Fe2O3 → Fe3O4, whereas the second
stage (higher-temperature reduction peaks) represents the transformation of Fe3O4→ Fe.29 A significant delay
in the first reduction peak temperature is observed for Fe2O3-PVA catalyst compared with the Fe2O3 catalyst. As
the PVA concentration increased, the first reduction peak of catalyst shifted gradually to higher temperature. Fang and co-workers20 reported that with the introduction of
the surfactant in the course of preparing catalyst, the first reduction peak temperature of resultant catalyst shifted to higher temperature. Therefore, the results confirm that the addition of PVA in the catalyst preparation process can inhibit the reduction of the catalyst in H2 atmosphere.
CO-TPR profiles of the catalysts are displayed in Figure 5b. It is found that all catalysts have two well-separated peaks, indicating that the catalysts are reduced and carburized via two steps, hematite (Fe2O3)
to magnetite (Fe3O4) and magnetite to iron carbides.30,31
The reduction temperature of Fe2O3-PVA catalyst shifts to
higher temperature as compared with Fe2O3 catalyst, while
the carburization temperature of Fe2O3-PVA catalyst shifts
to lower temperature as compared with Fe2O3 catalyst.
Moreover, as PVA concentration increases, the first peak shifts to higher temperature gradually and the second peak shifts to lower temperature. The results indicate that the addition of PVA in the catalyst preparation process inhibits the reduction behaviors of iron oxides either in H2 or in CO atmosphere probably due to stronger iron
oxides interaction, but promotes the carburization of the catalyst.
Adsorption behaviors
H2-TPD is used to investigate the effect of PVA on
the H2 chemisorption behavior of catalysts (Figure 6). H2
desorption over all catalysts mainly occurs in two broad temperature ranges: below 400 °C and above 400 °C. For the Fe2O3 catalyst two evident desorption peaks appear in
H2-TPD curves: a broad peak at 150-350 °C and a sharp
peak at ca. 650 °C. In the case of Fe2O3-PVA-1 catalyst,
the profile of H2 desorption below 400 °C is similar to that
of Fe2O3 catalyst, while the intensity of peak at ca. 650 °C
is higher than that of Fe2O3 catalyst. With increasing PVA
concentration, the intensity of the peak at ca. 650 °C at first increases, then passes a maximum at the PVA concentration of 15 wt.%, and then decreases gradually. In addition, the peaks below 400 °C shift to higher temperatures, indicating
that the hydrogen adsorption sites become more uneven with increasing PVA concentration.
Because of the heterogeneity of iron catalyst, catalyst includes numerous iron particles with various geometric shapes and sizes. Therefore, different surface structural can lead to the different H2-TPD profiles of the iron catalyst.29
Previous studies demonstrated that hydrogen adsorption over iron surfaces is weak at on-top or shallow hollow sites but stable at deep hollow or defect sites.32-34 H
2-TPD profiles
in high-temperature regions (above 400 °C), designated as Hγ, which may correspond to hydrogen chemisorbed
onto iron oxides.29,35-37 As for the H
2-TPD experiments, the
desorption peaks at the different temperatures correspond to H adsorbed on different active sites, and the intensity of the corresponding peaks could indirectly reveal the relative amount of the active sites exposed on the reduced catalysts. For unsupported iron catalysts, the H2 desorption peak area
may estimate the dispersion of catalyst. Clearly, the H2
desorption peak area of Fe2O3-PVA catalyst above 400 °C
is larger than that of Fe2O3 catalyst, which are beneficial
to the dispersion of iron and in turn may contribute to high catalytic activity of Fe2O3-PVA catalyst in FTS, especially
for Fe2O3-PVA-2 catalyst. The results indicate that addition
of PVA in catalyst preparation process apparently improves the dispersion of iron catalyst.
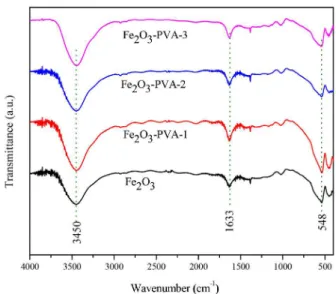
FTIR and TGA
As an organic assistant agent (PVA) used during the preparation of the iron catalysts, FTIR is performed to examine whether the organic species is completely removed by later calcination pretreatment at 500 °C. The FTIR results of the catalysts are shown in Figure 7. The vibrational bands attributed to the crystallization water molecules and the constitution water molecules are observed in the ranges of
3600-3200 and 1700-1550 cm-1,38 respectively. In addition,
the about 555 cm-1 band is attributed to the Fe–O stretching
vibration.39 From the spectra, it can be found that the bands
of catalysts with different PVA concentrations are the same. Wu and co-workers40 have reported that the PVA can be
completely removed through the calcination at 450 °C.
TGA analysis was performed to further examine whether the organic species (PVA) was completely removed by later calcination pretreatment at 500 oC. As shown in
Figure 8, for Fe2O3-PVA-3 catalyst, there is a significant
weight loss of about 8.3% due to desorption of physisorbed water molecules from 100 to 300 oC. No further weight loss
and no thermal effect are observed after 300 oC. But in the
TGA curve of Fe2O3, there is weight loss of about 7.3%
due to desorption of physisorbed water molecules from 100 to 300 oC. In addition, a small weight loss of about
2% is observed in the temperature range of 300-520 oC,
Figure 6. H2-TPD profiles of catalysts.
Figure 7. FTIR profiles of catalysts.
due to the condensation dehydration of surface hydroxyl groups.41 FTIR and TGA results suggest that the PVA can
be completely removed through the calcination at 500 oC.
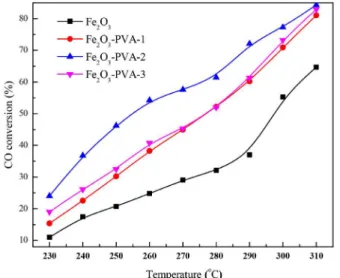
FTS performance
The activities of the Fe2O3 and Fe2O3-PVA catalysts
are shown in Figure 9. The CO conversion was used as a measure of FTS activity; i.e., higher conversion implies higher catalyst activity. The Fe2O3-PVA-1, Fe2O3-PVA-2
and Fe2O3-PVA-3 catalysts with larger pore size exhibited
the higher CO conversion than that of the Fe2O3 catalyst
under the same reaction conditions. Furthermore, the CO conversion significantly increases with the increasing of PVA concentration and passes through a maximum at the PVA concentration of 15 wt.%. The stability of catalysts is presented in Figure 10. The variation of the activity with time on stream (TOS) can be used as an indicator of catalyst stability. It can be found that the initial CO conversion of Fe2O3 catalyst is high. However, its stability is very poor.
The CO conversion quickly decreases from about 55% at the beginning of the reaction to about 30% at a TOS of 312 h. With the addition of PVA in catalyst preparation, the reaction behavior of Fe2O3-PVA-2 catalyst is different from
that of Fe2O3 catalyst, while its steady CO conversion is
quickly stabilized at a relatively high level. The BET results indicate that pore size of Fe2O3-PVA catalyst is much larger
than that of the Fe2O3 catalyst. Anderson et al.42 reported
that the FTS activity and selectivity of catalyst could be affected by their pore sizes. Khodakov et al.43 suggested
that lower reducibility of small particles is likely to be one of the reasons responsible for the lower Fischer-Tropsch reaction rates and higher methane selectivity on narrow pore catalysts. Later, Liu et al.11 and Xiong et al.9 found
that the large pore size of the catalyst improved the FTS catalytic activity. It is known that iron carbides are the active phase for FTS. It has been suggested that H2O
produced by FTS reaction should be responsible for the oxidation of iron carbides.44,45 However, the large pore size
of catalyst is helpful to effectively remove formed water and suppress reoxidation of iron carbides. In addition, the H2-TPD result indicates that addition of PVA in catalyst
preparation process apparently improves the dispersion of catalyst, especially for Fe2O3-PVA-2 catalyst. Therefore,
higher catalytic activity and stability are attributed to the large pore size, the large particle size and the high dispersion of catalyst due to addition of PVA in catalyst preparation process.
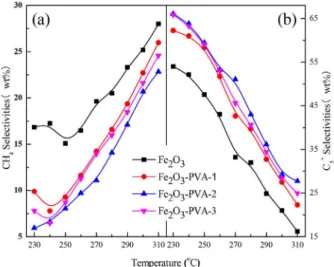
Effects of PVA concentration and temperature on product selectivity of catalysts under different temperatures are shown in Figure 11. Hydrocarbon product distributions
of catalysts are summarized in Table 2. The selectivity of methane over Fe2O3-PVA catalyst is lower than that
over Fe2O3 catalyst, as shown in Figure 11a. In addition,
selectivity of methane decreases with the increasing of PVA concentration and passes through a minimum at the PVA concentration of 15 wt.%. Methane and C2-C4 are the main
component in the hydrocarbon products due to high reaction temperature. Whilst the selectivity of C5+ over the iron
catalysts is lower. Fe2O3-PVA catalyst also shows a much
higher C5+ selectivity for FTS reaction than Fe2O3 catalyst,
as shown in Figure 11b. It can be found that the selectivity of C5+ increases with the increasing of PVA concentration
and passes through a maximum at the PVA concentration of 15 wt.%. It has been accepted that the increase in methane selectivity in narrow pore catalysts was attributed to the reducibility of the catalysts and a larger diameter of catalyst
Figure 9. Effects of PVA concentration and temperature on CO conversion of catalysts.
Figure 10. CO conversion as a function of time on stream of catalysts (Fe2O3: reaction temperature 300 oC; Fe2O3-PVA-2: reaction temperature
pores also led to significantly higher C5+ selectivities.7,43,46,47
Therefore, the proper large pore size of the Fe2O3-PVA-2
catalyst may possess the highest C5+ selectivity and the
lowest methane selectivity. As shown in Table 2, the C2-C4
olefin/paraffin (C2-C4 O/P) ratio decreases with increase of
temperature for all catalysts. The Fe2O3-PVA catalyst has
a higher C2-C4 O/P ratio than Fe2O3 catalyst. It indicates
that the addition of PVA in catalyst preparation process can decrease methane selectivity and increase C5+ selectivity
of the iron-based catalyst in FTS reaction.
Conclusions
In this study, Fe2O3 catalysts were prepared by
co-precipitation method with and without the assistance of
PVA. The Fe2O3-PVA catalyst has relative smaller BET
surface area, larger pore size and large particle size than that of Fe2O3 catalyst. In addition, the structure of the
Fe2O3-PVA catalyst can be controlled by tuning PVA
concentrations during the catalyst preparation process. The effect of PVA on reduction behavior of catalyst shifts to higher the reduction temperature either in H2 or in
CO probably due to stronger iron oxides interaction. The addition of PVA in catalyst preparation process accelerates the carburization or the activation of catalyst in the CO or syngas atmosphere owing to large pore size and high dispersion of the Fe2O3-PVA catalyst.
In the FTS reaction, the Fe2O3-PVA catalyst showed
higher catalytic activity and stability during time on stream than that of the Fe2O3 catalyst, owing to large pore
size, large particle size and high dispersion of Fe2O3-PVA
catalyst. Moreover, addition of PVA in catalyst preparation process also can significantly decrease methane selectivity and increase C5+ selectivity of the iron-based catalyst in FTS
reaction. In addition, an important finding is that a proper PVA concentration (15 wt.%) apparently suppresses the methane selectivity and shows good stability in the FTS reaction.
Acknowledgments
The authors are indebted to the support from the National Natural Science Foundation of China (No. 21373254). This work is also supported by Wuhan Kaidi General Research Institute of Engineering & Technology Co., Ltd.
Table 2. Activity and selectivity of catalysts
Catalysta Fe
2O3 Fe2O3-PVP-1 Fe2O3-PVP-2 Fe2O3-PVP-3
Reaction temperature / °C 230 270 310 230 270 310 230 270 310 230 270 310
TOFb × 10-3 / s-1 0.18 0.48 1.07 0.27 0.80 1.44 0.45 1.00 1.57 0.34 0.80 1.46
CO conversion / % 11.01 29.03 64.67 15.36 44.96 81.06 24.02 57.59 84.34 19.04 45.28 82.96 CO + H2 conversion / % 10.26 28.40 54.12 11.78 33.50 57.46 17.35 38.20 57.79 16.35 35.76 58.59
H2/CO (in tail gas) 2.26 2.26 3.20 2.36 2.89 6.27 2.53 3.32 7.75 2.33 2.78 6.83
KWGS 1.63 0.90 2.96 1.98 2.68 9.00 2.27 3.63 10.56 2.50 2.37 9.30
CO2 selectivity / (wt.%) 6.60 13.38 36.47 33.21 35.46 49.57 33.50 39.16 50.03 30.44 34.66 49.86
HC selectivity / (wt.%)
C1 16.82 19.63 28.00 9.88 14.22 25.97 5.93 11.09 22.82 7.80 13.96 24.58
C2-C4 29.20 47.17 55.80 27.87 43.13 51.75 27.99 37.86 49.43 26.34 40.42 50.47
C5+ 53.98 33.21 16.19 62.25 42.65 22.28 66.07 51.05 27.75 65.86 45.61 24.95
C2-C4 O/P 0.81 0.33 0.19 2.00 0.76 0.48 2.61 1.23 0.67 2.05 0.81 0.58
aReaction condition: 1.5 MPa, H
2/CO = 2.0, and GHSV = 2000 h-1; bapparent turnover frequency: numbers of CO molecules converted per adsorption site
per second; C2-C4 O/P: olefin/paraffin ratio.
References
1. Bukur, D. B.; Lang, X.; Ind. Eng. Chem. Res. 1999, 38, 3270. 2. Dry, M. E.; Appl. Catal., A 2004, 276, 1.
3. Dry, M. E.; Catal. Today 2002, 71, 227.
4. Zhang, J.; Chen, J.; Ren, J.; Sun, Y.; Appl. Catal., A 2003, 243,
121.
5. Zhang, Y.; Shinoda, M.; Tsubaki, N.; Catal. Today 2004, 93,
55.
6. Lapszewicz, J. A.; Loeh, H. J.; Chipperfield, J. R.; J. Chem. Soc., Chem. Commun. 1993, 913.
7. Tsubaki, N.; Zhang, Y.; Sun, S.; Mori, H.; Yoneyama, Y.; Li, X.; Fujimoto, K.; Catal. Commun. 2001, 2, 311.
8. Tao, C.; Li, J.; Liew, K. Y.; Sci. China: Chem. 2010, 53, 2551.
9. Xiong, H.; Zhang, Y.; Liew, K.; Li, J.; J. Mol. Catal. A: Chem.
2008, 295, 68.
10. Liu, Y.; Fang, K.; Chen, J.; Sun, Y.; Green Chem. 2007, 9, 611. 11. Liu, Y.; Chen, J.; Fang, K.; Wang, Y.; Sun, Y.; Catal. Commun.
2007, 8, 945.
12. Liu, K.; Suo, H.; Zhang, C.; Xu, J.; Yang, Y.; Xiang, H.; Li, Y.;
Catal. Commun. 2010, 12, 137.
13. Herranz, T.; Rojas, S.; Perez-Alonso, F.; Ojeda, M.; Terreros, P.; Fierro, J.; Appl. Catal., A 2006, 311, 66.
14. Calderone, V. R.; Shiju, N. R.; Curulla-Ferré, D.; Chambrey, S.; Khodakov, A.; Rose, A.; Thiessen, J.; Jess, A.; Rothenberg, G.; Angew. Chem., Int. Ed. 2013, 52, 4275.
15. Dong, H.; Xie, M.; Xu, J.; Li, M.; Peng, L.; Guo, X.; Ding, W.;
Chem. Commun. 2011, 47, 4019.
16. Liu, Y.; Goebl, J.; Yin, Y.; Chem. Soc. Rev. 2013, 42, 2610. 17. Luo, M. F.; Ma, J. M.; Lu, J. Q.; Song, Y. P.; Wang, Y. J.; J.
Catal. 2007, 246, 52.
18. Xie, L.; Hu, Z.; Lv, C.; Sun, G.; Wang, J.; Li, Y.; He, H.; Wang, J.; Li, K.; Electrochim. Acta 2012, 78, 205.
19. Gao, J.; Ye, K.; Yang, L.; Xiong, W. W.; Ye, L.; Wang, Y.; Zhang, Q.; Inorg. Chem. 2013, 53, 691.
20. Chu, Z.; Chen, H.; Yu, Y.; Wang, Q.; Fang, D.; J. Mol. Catal. A: Chem. 2013, 366, 48.
21. Mercier, L.; Pinnavaia, T. J.; Chem. Mater. 2000, 12, 188.
22. Ma, C.; Chen, Y.; Chen, J.; J. Braz. Chem. Soc. 2015, 26, 1520. 23. Bukur, D. B.; Carreto-Vazquez, V.; Pham, H. N.; Datye, A. K.;
Appl. Catal., A 2004, 266, 41.
24. Wang, H.; Yang, Y.; Xu, J.; Wang, H.; Ding, M.; Li, Y.; J. Mol. Catal. A: Chem. 2010, 326, 29.
25. Ning, W. S.; Koizumi, N.; Chang, H.; Mochizuki, T.; Itoh, T.; Yamada, M.; Appl. Catal., A 2006, 312, 35.
26. Suo, H.; Zhang, C.; Wu, B.; Xu, J.; Yang, Y.; Xiang, H.; Li, Y.;
Catal. Today 2012, 183, 88.
27. Lox, E. S.; Froment, G. F.; Ind. Eng. Chem. Res. 1993, 32, 71. 28. Huang, C. S.; Xu, L.; Davis, B. H.; Fuel Sci. Technol. Int. 1993,
11, 639
29. Suo, H.; Wang, S.; Zhang, C.; Xu, J.; Wu, B.; Yang, Y.; Xiang, H.; Li, Y. W.; J. Catal. 2012, 286, 111.
30. Jin, Y.; Datye, A. K.; J. Catal. 2000, 196, 8.
31. Zhang, C. H.; Yang, Y.; Teng, B. T.; Li, T. Z.; Zheng, H. Y.; Xiang, H. W.; Li, Y. W.; J. Catal. 2006, 237, 405.
32. Moritz, W.; Imbihl, R.; Behm, R. J.; Ertl, G.; Matsushima, T.;
J. Phys. Chem. 1985, 83, 1959.
33. Bernasek, S. L.; Zappone, M.; Jiang, P.; Surf. Sci. 1992, 272, 53.
34. Walch, S. P.; Surf. Sci. 1984, 143, 188.
35. Yoshida, K.; Somorjai, G.; Surf. Sci. 1978, 75, 46.
36. Merrill, P. B.; Madix, R. J.; Surf. Sci. 1996, 347, 249. 37. Wedler, G.; Borgmann, D.; Geuss, K.-P.; Surf. Sci. 1975, 47,
592.
38. Zhang, M.; Fang, K.; Lin, M.; Hou, B.; Zhong, L.; Zhu, Y.; Wei, W.; Sun, Y.; J. Phys. Chem. C 2013, 117, 21529.
39. Cozar, O.; Leopold, N.; Jelic, C.; Chiş, V.; David, L.; Mocanu, A.; Tomoaia-Cotişel, M.; J. Mol. Struct. 2006, 788, 1. 40. Li, S.; Zhu, H.; Qin, Z.; Wang, G.; Zhang, Y.; Wu, Z.; Li, Z.;
Chen, G.; Dong, W.; Wu, Z.; Appl. Catal., B 2014, 144, 498. 41. Kavitha, M. K.; John, H.; Gopinath, P.; Mater. Res. Bull. 2014,
49, 132.
42. Anderson, R. B.; Hall, W. K.; Krieg, A.; Seligman, B.; J. Am. Chem. Soc. 1949, 71, 183.
43. Khodakov, A. Y.; Griboval-Constant, A.; Bechara, R.; Zholobenko, V. L.; J. Catal. 2002, 206, 230.
44. Bukur, D. B.; Okabe, K.; Rosynek, M. P.; Li, C. P.; Wang, D. J.; Rao, K. R. P. M.; Huffman, G. P.; J. Catal. 1995, 155, 353. 45. Li, S.; O’Brien, R. J.; Meitzner, G. D.; Hamdeh, H.; Davis, B.
H.; Iglesia, E.; Appl. Catal., A 2001, 219, 215.
46. Khodakov, A. Y.; Griboval-Constant, A.; Bechara, R.; Villain, F.; J. Phys. Chem. B 2001, 105, 9805.
47. Ma, C.; Chen, J.; Catal. Lett. 2015, 145, 702.