Computed Tomography Images
Daniela Muenzel1*, Thomas Koehler2, Kevin Brown3, Stanislav Zˇabic´3, Alexander A. Fingerle1, Simone Waldt1, Edgar Bendik1, Tina Zahel1, Armin Schneider4, Martin Dobritz1, Ernst J. Rummeny1, Peter B. Noe¨l1
1Department of Radiology, Technische Universitaet Muenchen, Munich, Germany,2Philips Technologie GmbH, Innovative Technologies, Hamburg, Germany,3Philips Healthcare, Cleveland, Ohio, United States of America,4MITI - Minimal-invasive Interdisciplinary therapeutic intervention research group, Technische Universitaet Muenchen, Munich, Germany
Abstract
Purpose:Evaluation of a new software tool for generation of simulated low-dose computed tomography (CT) images from an original higher dose scan.
Materials and Methods:Original CT scan data (100 mAs, 80 mAs, 60 mAs, 40 mAs, 20 mAs, 10 mAs; 100 kV) of a swine were acquired (approved by the regional governmental commission for animal protection). Simulations of CT acquisition with a lower dose (simulated 10–80 mAs) were calculated using a low-dose simulation algorithm. The simulations were compared to the originals of the same dose level with regard to density values and image noise. Four radiologists assessed the realistic visual appearance of the simulated images.
Results:Image characteristics of simulated low dose scans were similar to the originals. Mean overall discrepancy of image noise and CT values was21.2% (range29% to 3.2%) and20.2% (range28.2% to 3.2%), respectively, p.0.05. Confidence intervals of discrepancies ranged between 0.9–10.2 HU (noise) and 1.9–13.4 HU (CT values), without significant differences (p.0.05). Subjective observer evaluation of image appearance showed no visually detectable difference.
Conclusion:Simulated low dose images showed excellent agreement with the originals concerning image noise, CT density values, and subjective assessment of the visual appearance of the simulated images. An authentic low-dose simulation opens up opportunity with regard to staff education, protocol optimization and introduction of new techniques.
Citation:Muenzel D, Koehler T, Brown K, Zˇabic´ S, Fingerle AA, et al. (2014) Validation of a Low Dose Simulation Technique for Computed Tomography Images. PLoS ONE 9(9): e107843. doi:10.1371/journal.pone.0107843
Editor:Peter M. A. van Ooijen, University of Groningen, University Medical Center Groningen, Netherlands
ReceivedMarch 4, 2014;AcceptedAugust 21, 2014;PublishedSeptember 23, 2014
Copyright:ß2014 Muenzel et al. This is an open-access article distributed under the terms of the Creative Commons Attribution License, which permits unrestricted use, distribution, and reproduction in any medium, provided the original author and source are credited.
Funding:This work is supported by Philips Healthcare. The funder provided support in the form of salaries for authors (TK, KB, SZ), but did not have any additional role in the study design, data collection and analysis, decision to publish, or preparation of the manuscript.
Competing Interests:TK is an employee of Philips Technologie GmbH; KB and SZ are employees of Philips Healthcare. The remaining authors have no financial disclosures and had complete, unrestricted access to the study data at all stages of the study. This does not alter the authors’ adherence to PLOS ONE policies on sharing data and materials.
* Email: [email protected]
Introduction
Computed tomography (CT) examination plays a fundamental role in an all-day radiological work-up of patients in hospitals with modern healthcare equipment all around the world. Its excellent diagnostic value combined with a very short image acquisition time makes it a basic and essential diagnostic imaging tool. During the last decade there were a lot of discussions concerning an increased risk of cancer caused by the use of ionizing radiation in medicine [1,2]. On the other hand, Hendee and O’Connor recently warned against an anxiety and fear of patients sensation-alized by public media with the risk of delayed or refused medical imaging and, as a consequence, delayed or missed diagnosis [3]. A clinically justified CT examination and its benefit of an accurate diagnostic work-up always outweigh its associated individual risks like e.g. stochastically induced risk of cancer [4,5]. However, these considerations encourage the demand for establishment of CT examination protocols according to the ‘‘as low as reasonably
achievable’’ (ALARA) principle. This means an image acquisition at a radiation dose as low as possible while still maintaining a diagnostic image quality. A valid determination of the optimized dose levels for all specific CT examination protocols would demand a comparison of images of patients obtained at different dose levels. However, this would require repeated scans of the patients resulting in a significant increase of radiation exposure to these patients or probands. Therefore, it is desirable to have a computer simulation tool for reconstructing images from one original data set simulating images were acquired at lower dose levels.
Methods
Animal experiment
A female landrace pig was examined with a bodyweight of 49 kg. CT image acquisition was performed with the animal under deep general anaesthesia with endotracheal intubation and controlled ventilation. All animal procedures were performed in strict accordance with the German animal protection law and were approved by the Regierung von Oberbayern; 209.1/211-2531.3-5/03.
The animal received regular feeding until 24 h before the procedure. Subsequently, it had a liquid diet until 12 h before the intervention and was kept off food for the remaining time. An 18 G venous access was placed in an ear vein for the administration of iodinated contrast. Pre-anaesthesia sedation was performed with an intramuscular injection of Azaperon (2.0 mg/kg), Atropin (0.02 mg/kg) and Ketamin (15 mg/kg). General anaesthesia was initiated by the injection of Propofol (1%) by effect. After endotracheal intubation maintenance of anaesthesia was achieved by continuous injection of propofol 2% with bolus application of Fentanyl. Oxygenation, temperature, and heart rate were continuously monitored and anaesthetic medication adapted if necessary. After completion of the CT scans, the pig was euthanized using a lethal dose of pentobarbitone and potassium chloride.
CT image acquisition
CT examinations were performed using a wide coverage 256-slice multidetector CT scanner (Brilliance iCT, Philips Healthcare, Cleveland, OH, USA). The animal was positioned in the center of the gantry. Spiral data acquisition was performed using 6460.625 mm collimation, a pitch factor of 0.985, and a gantry rotation time of 0.4 s. Tube settings were 100 kV in all studies and 100 mAs, 80 mAs, 60 mAs, 40 mAs, 20 mAs, and 10 mAs, respectively.
Native and contrast enhanced CT examination of the chest and abdomen in arterial contrast phase were performed during end-expiratory breath-hold with the pig in supine position. For the contrast enhanced scans, a fixed volume of 50 ml of contrast agent (Imeron 400 MCT, Bracco Imaging Deutschland GmbH, Konstanz, Germany) was injected at a flow of 4 ml/s into an ear vein via an 18-gauge catheter using a dual syringe injection system (Stellant, MEDRAD, Inc., Indianola, Pennsylvania). The contrast bolus was followed by 40 mL saline solution. The scanner started data acquisition by bolus tracking. The contrast agent was washed out between the contrast-enhanced CT examinations by saline flushing for 30 minutes. However, there was an accumu-lation of contrast load over time, with a subsequent increase of HU of the liver parenchyma from 68 HU to 141 HU (100 mAs: 68 HU, 60 mAs: 82 HU, 20 mAs: 90 HU, 100 mAs: 116 HU, 10 mAs: 113 HU, 80 mAs: 125 HU, 40 mAs: 142 HU). To avoid any unblinding due to insufficient contrast wash-out or accumu-lation of contrast material in the urinary tract and the organs, CT scans of different dose levels were performed in a random order. In addition, 100 mAs data set (base of all simulations) was scanned twice, once at the beginning and once in the middle of the study protocol, in order to create simulations with more and less contrast material in the urinary tract. The time flow of image acquisition is illustrated in Figure 1.
Standard image reconstructions (filtered back projection) were obtained with 3 mm slice thickness using the CA (smooth) kernel. The reconstruction field of view was 380 mm and matrix size was 5126512.
CT low dose simulation
The CT raw data of the 100 mAs scans were retrieved from the scanner and used as input for the low dose simulation tool, which takes in account both photonic and electronic noise. Details of the low dose simulation algorithm are given in reference [6]. The resulting simulated scans at target mAs ranging from 80 mAs down to 10 mAs were reconstructed off-line with the same reconstruction parameters as the original scans.
CT values and image noise
Hounsfield units (HU) of defined regions of interest (ROI) were determined and compared for original and simulated data. Image noise was defined as the standard deviation of a 50 mm2ROI. Therefore, 10 representative ROIs were defined for the following material: back muscles, subcutaneous fat tissue of the ventral abdominal wall, lung tissue, fluid content of the gallbladder, and the lumbar vertebral bodies of the spine. For comparison of noise levels in different anatomical regions, image noise was defined of the shoulder girdle, dorsum, abdominal wall, and pelvis. Results of image noise were statistically analyzed for original and simulated data at corresponding radiation dose levels. Confidence intervals of mean discrepancies between the originals and simulations were calculated for all tissue and dose levels, respectively.
Observer discrimination of simulated versus original images
For a qualitative assessment of the simulated images and to approve a realistic appearance of the images, observer evaluation was performed for the contrast- enhanced images of the swine. Therefore, transverse and coronal slices (slice thickness 3 mm) were formatted for the original and simulated data sets for all dose levels. Selection of imaging features and parameters are shown in Table 1. Therefore, multiplanar reformations with different windows settings were created. In total, 160 images (5 dose levels, 16 reconstructions, original and simulation) were evaluated. 2D images were randomly arranged one by one for subjective image evaluation. Four experienced radiologists (mean clinical experi-ence 7 years, range 3–15 years) were instructed to rate each image with regard to originality (1 = original scan or 2 = simulated one).
Statistical Analysis
Continuous data are expressed as arithmetic mean 6 SD. Differences of the mean are displayed with confidence intervals. A two-tailed paired Student t-test was performed for comparison of image noise and Hounsfield units of original and simulated images for different regions of interest. Cohen kappa statistic was used for evaluation of interobserver agreement. A p-value #0.05 was considered to indicate statistical significance. All statistics were computed with Microsoft Excel and SPSS.
Results
CT values and image noise
CTDI values of all scan data (100 kV; 100 mAs, 80 mAs, 60 mAs, 40 mAs, 20 mAs, and 10 mAs, respectively) ranged from 4.4 mGy to 0.44 mGy.
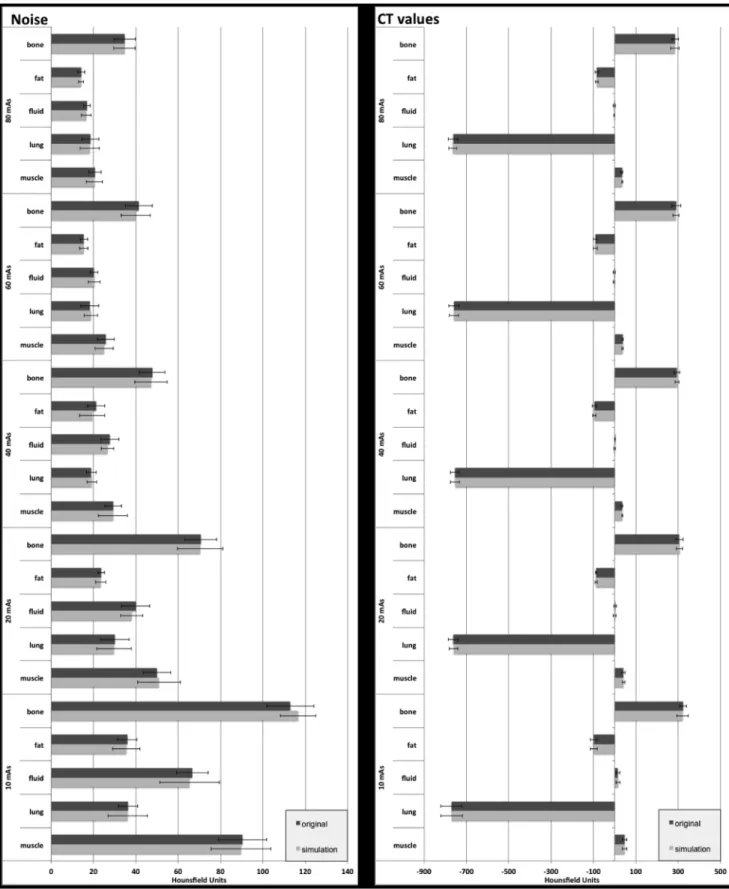
Mean density values of different tissues such as soft tissue, bone, lung, fluid, and fat were determined in characteristic slices of the non-enhanced CT examination of the animal study. Correspond-ing mean HU values are shown in Figure 2.
values between original and simulated data ranged between
28.2% and 3.2%, with a mean of20.2% (p.0.05). Image noise and CT values of characteristic tissue at different dose levels are presented in Figure 2. Similar noise was obtained for all dose levels in original and simulated images, with mean values of 21.0 vs. 20.8 (80 mAs), 24.2 vs. 23.9 (60 mAs), 29.0 vs. 28.3 (40 mAs), 42.9 vs. 42.5 (20 mAs), and 68.4 vs. 68.7 (10 mAs), p.0.05, respectively. Image noise in different anatomical regions is shown in Table 2.
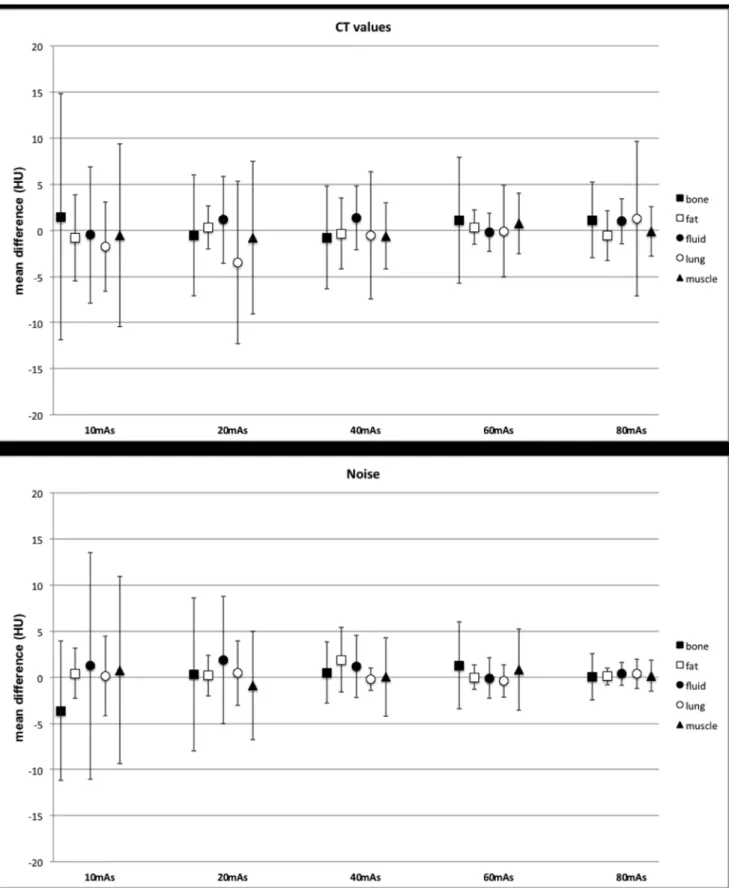
Differences of the mean of noise and CT value measurements for original and simulated images were calculated for each tissue at all dose levels (Figure 3). Confidence intervals for all tissues and dose levels ranged between 0.9–10.2 HU (noise) and 1.9–13.4 HU (CT values). The value of 0 was included in all confidence intervals, and there were no significant differences between the original and simulations for all tissue and all dose levels (p.0.05).
Observer discrimination of simulated versus original images
Four radiologists rated a total of 640 images to be original or simulated. Figure 4 illustrates several examples of simulated and original images, presented for different tissue windows settings,
and slice orientation. There is no visible difference between the originals and simulation. The total of 323 images (50.5%) were detected correctly as original (n = 160, 25%) or simulated (n = 163, 25.5%), p.0.05 respectively. The total of 317 images (49.5%) were mistaken to be an original (but simulated, n = 157, 24.5%) and to be a simulation (but original, n = 160, 25%). The detailed results for each observer are shown in Table 3. Comparing the results of all 4 observers, a total of 83 images were rated equally by at least 3 radiologists. In this regard, the group of radiologists consistently categorized 25 (29.1%) of the original images correctly as originals and 22 (25.6%) of the simulated images correctly as simulations. Beyond that, 45.3% (n = 39) of the images were congruently misclassified (original but simulation 24.4%, simula-tion but original 20.9%).
The four possible combinations of image type (original or simulation) and image rating (original and simulation) showed similar percentages of about 25% (range 24.5%–28.8%), without an observable discrimination between original and simulated images above chance level. Kappa values for all observer pairs were 0.06, 20.02, 0.09, 0.1, 20.08, and 20.09, respectively, which represents a poor interobserver agreement suggesting a subjective rating by random.
Figure 1. Time flow of CT scans at different dose levels.First, all native scans were performed. Afterwards, contrast enhanced scans were acquired, in a random order of the different dose levels. There was a gap of 30 minutes between the scans. 100 mAs scan ( = base of the simulations) was achieved twice in order to minimize discrepancies between originals and simulations caused by differences in contrast accumulation. doi:10.1371/journal.pone.0107843.g001
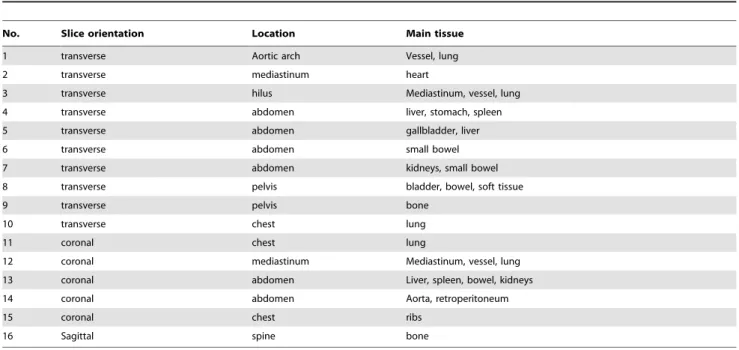
Table 1.Synopsis of the images created for individual image assessment (original versus simulated).
No. Slice orientation Location Main tissue
1 transverse Aortic arch Vessel, lung
2 transverse mediastinum heart
3 transverse hilus Mediastinum, vessel, lung
4 transverse abdomen liver, stomach, spleen
5 transverse abdomen gallbladder, liver
6 transverse abdomen small bowel
7 transverse abdomen kidneys, small bowel
8 transverse pelvis bladder, bowel, soft tissue
9 transverse pelvis bone
10 transverse chest lung
11 coronal chest lung
12 coronal mediastinum Mediastinum, vessel, lung
13 coronal abdomen Liver, spleen, bowel, kidneys
14 coronal abdomen Aorta, retroperitoneum
15 coronal chest ribs
16 Sagittal spine bone
Figure 2. Mean values of image noise (left side) and CT values (right side) of characteristic tissues (bone, fat, fluid, lung, and muscle) for original (black bars) and simulated (grey bars) transverse slice images (3 mm slice thickness) at different dose levels (10, 20, 40, 60, and 80 mAs).There were no significant differences with mean discrepancies of21.2% in image noise and20.2% in CT values between simulated and original images. Error bars indicate standard deviation.
Discussion
We showed in our study that it is possible to accurately simulate, based on a single acquired scan, another scan with lower dose than the actually acquired one. This technique offers the possibility to calculate lower dose images when only one examination was performed.
We approved congruent objective image parameters (noise level and HU-values) for a non-contrast CT examination of a swine. Prior studies concerning low dose computer simulation assessed metric parameters as noise and density values for comparison of original and calculated low dose images in digital chest radiog-raphy [7], tomosynthesis [8], and CT images [9–11]. Mayo et al. presented a computer modification tool for simulation images with increased image noise already in 1997 [12]. Prior simulation techniques mainly focused on the addition of image noise for simulation of lower dose images [10,12,13]. In our study, we evaluated a new technique [6], which makes use of the conditional variance identity to properly account for the variance of the input high-dose data, and allows for the inclusion of real samples of detector noise, properly scaled according to the level of the simulated x-ray signals. Phantom measurements using this technique and noise power spectrum analysis were described previously by Zabic´ et al. [6].
The major difference of our model compared the other models that we know of are the following: First, all other models make an approximation at some point in their derivation that a noisy signal from the high dose scan can be assumed noiseless. We use conditional variance identity to avoid that approximation which ultimately results in a method which does not depend on the noise variance in the original data set. We can start from any tube current and simulate any lower dose tube current without making that key approximation (described in detail in [6]). Another big step is that we use electronic noise samples from the real scanner, rather than simulating them as zero-mean Gaussian distribution. As discussed in [6] we conclude that if one wants to simulate contributions of the electronic noise correctly, then one has to take in account that the statistical distribution of the noise is strictly non-Gaussian.
We also included subjective evaluation of simulated images for contrast-enhanced CT in order to evaluate the potential of acquisition simulation in an examination setting closely adapted to the clinical examination of patients. This additional analysis was performed by a subjective image assessment by four experienced radiologists. They were not able do distinguish the original from
simulated images above chance level, as the visual impact of original and simulated images was equivalent. This is of fundamental importance for the validation of a low dose simulator, as a final objective low dose simulation should be implemented in a clinical investigation setting. Here, radiologists will be able to determine the specific radiation dose that is necessary to achieve diagnostic quality of CT images by a minimized radiation exposure according to the ALARA principle.
CT is an essential imaging tool for the clinical day-to-day routine, as e.g. tumor follow-up in malignancy, trauma emergency department, or new techniques like perfusion imaging of the brain and the myocardium. There are a lot of CT examination protocols with different scan parameters (mAs, kVp, filters etc.) adapted to the individual clinical symptoms and specific diseases. On this note, with additional capabilities CT overs the number of protocols has significantly increased over the last years [14]. Especially the introduction of iterative reconstruction methods has widened the number of parameters possible for each protocol [15– 20]. For each CT protocol, the optimal combination of required dose and imaging parameters has to be defined. However, this is problematic: systematic analysis of dose level and image quality would require repetitive scan of the patients, resulting in an inadequate high effective dose for those volunteers. Still, it is important to adjust the scan protocols to the standards of diagnostic imaging, while lowering the effective dose as far as possible. Adequate parameters for tube current and tube output have do be defined for each examination setting, but also for different scanners and different patient characteristics e.g. body weight. This topic is of special interest in pediatric radiology. Here, it is of special importance to define CT examination protocols providing diagnostic image quality by using preferably low radiation dose. Frush et al. presented a simulation technology for systematic evaluation of radiation dose reduction for abdom-inal multidetector CT of pediatric patients [21]. Thus, a valid dose simulation technique offers the possibility to perform dose calculation and optimization for CT examinations of each part of the body without repetitive scans of a group of test subjects.
In addition, low dose simulations can be used for education for medical technical assistants and the radiologists to depict the potential differences or equivalency of the same examination in the same patient at different dose levels. Training programs for radiological departments can help to substantially reduce radiation dose [22]. Therefore, CT simulation tools may visualize and facilitate the comprehension of potential dose saving strategies. Thus, the approach of dose reduction in routine clinical
Table 2.Image noise for different anatomical regions in original and simulated images at different dose levels.
dose level (mAs)
anatomy 80 60 40 20 10
shoulder girdle original 36.4 38.2 68.7 117.6 174.3
simulation 38.7 40.2 68.7 115.0 173.2
dorsum original 27.0 27.9 36.6 57.2 108.3
simulation 27.1 28.8 33.7 58.8 109.9
abdominal wall original 20.4 24.2 29.5 32.2 66.3
simulation 20.5 25.5 28.7 36.2 65.3
pelvis original 70.3 76.7 94.1 134.0 206.3
simulation 68.7 77.5 98.5 130.4 204.5
Figure 3. Differences of the mean and confidence interval for noise (a) and CT values (b) for bone, fat, fluid, lung, and muscle at different dose levels.
radiological examinations will attract increased interest, providing a concrete and demonstrative view on the resulting image quality and diagnostic value.
Lowering radiation dose is the hot topic of CT imaging techniques today. During the last ten years, several techniques for adapting of radiation dose to the patient physiognomy and the individual examination procedures were implemented to routine CT protocols [23–26]. In addition, there are several new approaches such as noise reduction techniques, iterative recon-struction or postprocessing techniques [15,23,27–29]. All these methods target a substantial decrease in radiation dose while maintaining diagnostic image quality. So routine CT examinations with effective radiation dose less than 1 mSv seem to be realistic in
the near future. As a consequence, J. Thrall raised the question of considerations on radiation dose in clinical CT examinations should change from ALARA principle to AHARA (as high as reasonably achievable), pointing out the importance of a maximum benefit of diagnostic imaging using ionizing radiation dose [14]. So it will remain a challenge to optimize the balance between lowest radiation dose and highest diagnostic value. In this discussion, lower dose simulation techniques may help for visualization and determination of adequate dose settings in clinical CT.
There are some limitations of our study. First, the contrast enhancement of simulated and original images was not identical, because of slightly different contrast enhancement of the vessels
Figure 4. Coronal reformations with lung window settings (left side) showed similar image appearance of the lungs in simulated (right column) and original (left column) images.Simulated (right column) versus original (left column) images of the abdomen in transverse orientation are shown in the middle part. Image noise and streak artifacts are increased in lower dose images without visually detectable differences between original and simulated images. Also the simulated (right column) and original (left column) reformations of the abdomen including the kidneys in coronal orientation matched closely (right side).
doi:10.1371/journal.pone.0107843.g004
Table 3.Subjective image evaluation.
observer 1 rated original rated simulated observer 2 rated original rated simulated
Original 37 (23.1%) 43 (26.9%) Original 35 (21.9%) 45 (28.1%)
Simulation 42 (26.3%) 38 (23.8%) Simulation 38 (23.8%) 42 (26.2%)
observer 3 rated original rated simulated observer 4 rated original rated simulated
Original 42 (26.3%) 38 (23.8%) Original 46 (28.8%) 34 (21.3%)
Simulation 39 (24.4%) 41 (25.6%) Simulation 38 (23.8%) 42 (26.3%)
The total of 160 images (80 original and 80 simulated) were presented to four radiologists. The four possible combinations of image type (original or simulation) and image rating (original and simulation) showed similar percentages of about 25% (range 24.5%–28.8%), suggesting a subjective rating by random.
and an accumulation of contrast material due to repetitive examinations; therefore, quantitative measurements have been performed on non contrast-enhanced scans. In addition, we did not use topogram-based tube current modulation in our study. However, as shown by Zabic et al., this simulation method is also compatible with tube modulation.
In conclusion, we showed that CT low dose simulation is a feasible and valid method for definition of adequate dose levels in CT. Thus, computer simulation of different dose levels provides an
excellent base for future radiation dose optimization of diverse CT examination protocols for improved patient care.
Author Contributions
Conceived and designed the experiments: DM TK KB SZ EJR PBN. Performed the experiments: DM AS PBN MD. Analyzed the data: DM TK AAF SW EB TZ. Contributed reagents/materials/analysis tools: DM AS TK KB SZ PBN EJR. Wrote the paper: DM TK KB SZ PBN.
References
1. Amis ES Jr, Butler PF, Applegate KE, Birnbaum SB, Brateman LF, et al. (2007) American College of Radiology white paper on radiation dose in medicine. J Am Coll Radiol 4: 272–284.
2. McCollough C, Cody D, Edyvean S, Geise R, Gould B, et al. (2008) The measurement, reporting, and management of radiation dose in CT. College Park, MD: American Association of Physicists in Medicine, AAPM report no.96. 3. Hendee WR, O’Connor MK (2012) Radiation risks of medical imaging:
separating fact from fantasy. Radiology 264: 312–321.
4. Brenner DJ, Doll R, Goodhead DT, Hall EJ, Land CE, et al. (2003) Cancer risks attributable to low doses of ionizing radiation: assessing what we really know. Proc Natl Acad Sci U S A 100: 13761–13766.
5. Schmidt CW (2012) CT scans: balancing health risks and medical benefits. Environ Health Perspect 120: A118–121.
6. Zˇ abic´ S, Wang Q, Morton T, Brown KM (2013) A low dose simulation tool for CT systems with energy integrating detectors. Medical physics 40: 1–14. 7. Veldkamp WJ, Kroft LJ, van Delft JP, Geleijns J (2009) A technique for
simulating the effect of dose reduction on image quality in digital chest radiography. J Digit Imaging 22: 114–125.
8. Svalkvist A, Ba˚th M (2010) Simulation of dose reduction in tomosynthesis. Med Phys 37: 258–269.
9. Joemai RM, Geleijns J, Veldkamp WJ (2010) Development and validation of a low dose simulator for computed tomography. Eur Radiol 20: 958–966. 10. So¨derberg M, Gunnarsson M, Nilsson M (2010) Simulated dose reduction by
adding artificial noise to measured raw data: a validation study. Radiat Prot Dosimetry 139: 71–77.
11. Wang AS, Pelc NJ (2011) Synthetic CT: simulating low dose single and dual energy protocols from a dual energy scan. Med Phys 38: 5551–5562. 12. Mayo JR, Whittall KP, Leung AN, Hartman TE, Park CS, et al. (1997)
Simulated dose reduction in conventional chest CT: validation study. Radiology 202: 453–457.
13. Britten AJ, Crotty M, Kiremidjian H, Grundy A, Adam EJ (2004) The addition of computer simulated noise to investigate radiation dose and image quality in images with spatial correlation of statistical noise: an example application to X-ray CT of the brain. Br J Radiol 77: 323–328.
14. Thrall JH (2012) Radiation Exposure in CT Scanning and Risk: Where Are We? Radiology 264: 325–328.
15. Noe¨l PB, Fingerle AA, Renger B, Mu¨nzel D, Rummeny EJ, et al. (2011) Initial performance characterization of a clinical noise-suppressing reconstruction algorithm for MDCT. AJR Am J Roentgenol 197: 1404–1409.
16. Winklehner A, Karlo C, Puippe G, Schmidt B, Flohr T, et al. (2011) Raw data-based iterative reconstruction in body CTA: evaluation of radiation dose saving potential. Eur Radiol 21: 2521–2526.
17. Becker HC, Augart D, Karpitschka M, Ulzheimer S, Bamberg F, et al. (2012) Radiation exposure and image quality of normal computed tomography brain images acquired with automated and organ-based tube current modulation multiband filtering and iterative reconstruction. Invest Radiol 47: 202–207. 18. Gramer BM, Muenzel D, Leber V, von Thaden AK, Feussner H, et al. (2012)
Impact of iterative reconstruction on CNR and SNR in dynamic myocardial perfusion imaging in an animal model. Eur Radiol 22: 2654–2661.
19. Han BK, Grant KL, Garberich R, Sedlmair M, Lindberg J, et al. (2012) Assessment of an iterative reconstruction algorithm (SAFIRE) on image quality in pediatric cardiac CT datasets. J Cardiovasc Comput Tomogr 6: 200–204. 20. Nakaura T, Nakamura S, Maruyama N, Funama Y, Awai K, et al. (2012) Low
contrast agent and radiation dose protocol for hepatic dynamic CT of thin adults at 256-detector row CT: effect of low tube voltage and hybrid iterative reconstruction algorithm on image quality. Radiology 264: 445–454. 21. Frush DP, Slack CC, Hollingsworth CL, Bisset GS, Donnelly LF, et al. (2002)
Computer-simulated radiation dose reduction for abdominal multidetector CT of pediatric patients. AJR Am J Roentgenol 179: 1107–1113.
22. Schindera ST, Treier R, von Allmen G, Nauer C, Trueb PR, et al. (2011) An education and training programme for radiological institutes: impact on the reduction of the CT radiation dose. Eur Radiol 21: 2039–2045.
23. McCollough CH, Chen GH, Kalender W, Leng S, Samei E, et al. (2012) Achieving routine submillisievert CT scanning: report from the summit on management of radiation dose in CT. Radiology 264: 567–580.
24. Mulkens TH, Bellinck P, Baeyaert M, Ghysen D, Van Dijck X, et al. (2005) Use of an automatic exposure control mechanism for dose optimization in multi-detector row CT examinations: clinical evaluation. Radiology 237: 213–223. 25. Gies M, Kalender WA, Wolf H, Suess C (1999) Dose reduction in CT by
anatomically adapted tube current modulation. I. Simulation studies. Med Phys 26: 2235–2247.
26. McCollough CH, Bruesewitz MR, Kofler JM (2006) CT dose reduction and dose management tools: overview of available options. RadioGraphics 26: 503– 512.
27. Thibault JB, Sauer KD, Bouman CA, Hsieh J (2007) A three-dimensional statistical approach to improved image quality for multislice helical CT. Med Phys 34: 4526–4544.
28. Dea´k Z, Grimm JM, Treitl M, Geyer LL, Linsenmaier U, et al. (2013) Filtered back projection, adaptive statistical iterative reconstruction, and a model-based iterative reconstruction in abdominal CT: an experimental clinical study. Radiology 266: 197–206.