Small Ruminant
Research
ELSEVIER
Small Ruminant Research 16 (1995) 159-164Ultrasonic estimates of fat thickness and
Zongissimus dorsi
muscle
depth for predicting carcass composition of live Aragon lambs
R. Delfa”**, A. Teixeirab, C. Gonzalez”, I. Blasco”
zyxwvutsrqponmlkjihgfedcbaZYXWVUTSRQPONMLKJIHGFEDCBA
“Uniahd de Tecnologia en Produccidn Animal, SIA- DGA. Apartado 727, 50080- Zaragoza, Spain blnstituto Polite’cnico de Bragaqa, Apartado 38, Bmganqa, Portugal
Accepted 6 June 1994
zyxwvutsrqponmlkjihgfedcbaZYXWVUTSRQPONMLKJIHGFEDCBA
Abstract
Six ultrasonic fat and muscle depth measurements, taken on the left and the right side of the fourth lumbar vertebra and third stemebra of the breast bone, were related to carcass composition to determine the accuracy of these measurements for predicting carcass compositon of live Aragdn lambs
(Temasco) .
Live weight alone accounted for 21, 19,26,18
and 47% of total variation of muscle, bone plus remainder, total fat, and subcutaneous and intermuscular fat, respectively. Addition of ultrasonic fat depth measurement on the right side of the lumbar region accounted for a further 18,31,33 and 36% ofmuscle, bone
plus remainder, total carcass fat and subcutaneous fat, respectively. Addition of the same measurement taken on the left side accounted for a further 15% of intermuscular fat. Live weight alone accounted for only 4% of the total variation of kidney and pelvic fat, but the addition of ultrasonic fat depth measurement on breast bone accounted for a further 26% of the variation of this fat depot. The accuracy of prediction of carcass composition on live animals could be improved by the addition of ultrasonic fat measurements.Key w ords: Ultrasonics; Prediction of carcass composition; Aragon lambs
1. Introduction
Little information
has been published about ultra-
sonics used in live ewes (Kempster
et al., 1982a).
Hiner ( 1958) suggested that ultrasonics are of little use
in predicting fat thickness and
longissimus dorsimus-
cle area of ewes. Nevertheless, Campbell et al. ( 1959)
reported a significant correlation between
longissimus dorsimuscle depth estimated by ultrasonics and meas-
ured on sheep carcass.
Moody et al. (1965),
using 235 live lambs for a
period of 3 years, showed that ultrasonics could predict
with an acceptable accuracy the fat thickness and lon-
gissimus dorsi muscle area, whereas the correlation
* Corresponding author.
between longissimus
dorsi muscle area assessed by
ultrasonics in live animals and the same measurement
obtained on the carcass was only 0.66, and the corre-
lation between subcutaneous
fat thickness assessed by
ultrasonics and the same measurement
obtained on the
carcass was 0.34.
A study by Kempster et al. (1977) suggested that
the scanogram measurements
could be used in experi-
mental work where it is necessary to select lambs for
slaughter at constant fatness. Clements et al. ( 1981)
showed that the accuracy
of the scanogram
was
improved by the addition of a body weight (BW) term.
Bass et al. (1982) suggested that some single probe
ultrasonic machines can predict carcass composition of
live sheep. Delfa et al. ( 1991) concluded that lumbar
fat thickness measurements
assessed by ultrasonics in
160 R. Delfa et al. /Small Ruminant Research 16 (1995) 159-164
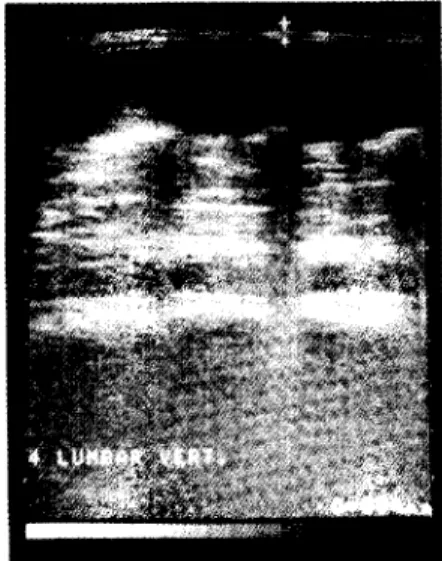
Fig.
1.
Lumbar fat thickness assessed by ultrasonicmachine.
live animals or measured on carcass were the best pre-
dictors of total carcass muscle and fat in Rasa Arago-
nesa ewes.
Currently the sheep industry in Arag6n is concerned
with producing leaner lambs with Temasco character-
istics. However, how can the industry identify superior
Fig. 2. Longissimus dorsi muscle depth assessed by machine.
ultrasonic
animals in order to produce more desirable carcasses
according to the butchers’ and consumers’ preferences?
The objective of the present study was to determine the
accuracy of different ultrasonic fat and muscle depth
measurements
to predict carcass composition
of live
Aragon lambs of Ternasco type.
2.
Materials and methods
A total of 29 Arag6n male lambs of Rasa Aragonesa
(n= 14) and Roya Bilbilitana
(n = 15) breeds were
taken from different flocks according to characteristics
of the Consejo Regulador of Ternasco (BOA, 1989).
The designation
of origin ‘Temasco de Arag6n’
comprises those carcasses from the extra and first cat-
egories weighing between 8.5 and 11.5 kg, belonging
to male lambs from the Rasa Aragonesa, Ojinegra de
Teruel and Roya Bilbilitana
breeds, without sex dis-
tinction
between
non-castrated
males and females.
Sheep farms must be located within the Autonomous
Community
of Aragdn and lambs born and bred
indoors.
Feeding must be maternal milk complemented
with
ad libitum white straw and concentrates authorized by
the Regulating Council. The minimal period of natural
lactation is 50 days. However, during weaning, ad libi-
turn white straw and concentrate constitute the feeding.
The concentrate must have a percentage of milk sub-
stitute fixed by the Regulating Council.
Slaughtering
and carcass dressing
must be per-
formed in the Autonomous Community of Arag6n. The
live weight in the slaughterhouse
must be between 18
and 24 kg and the age between 70 and 90 days.
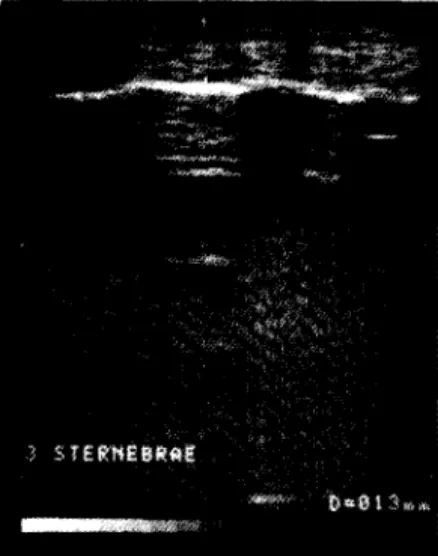
Twenty-four hours before slaughter six ultrasonic fat
and muscle depth measurements,
taken on the left and
the right side of the fourth lumbar vertebra (Figs. 1 and
2) and third sternebra of the breast bone (Fig. 3)
(Delfa,
1992), were assessed using an ultrasonic
machine (Toshiba Sonolayer scanner, Model Sal-32 B,
with a 5.0 MHz sounder). Lambs were fasted and then
slaughtered in the experimental
slaughterhouse
of the
Agricultural Research Service of the Autonomic Gov-
srnment of Aragbn.
Carcasses were cooled at 6°C for 24 h. Fat thickness
was measured on the carcass with a caliper at the same
R. Delja et al. /Small Ruminant Research I6 (1995) 159-164 161
Fig. 3. All breast bone fat thickness assessed by ultrasonic machine.
Carcasses were halved carefully and the left side was
dissected into muscle, bone plus remainder
(major
blood vessels, ligaments, tendons and thick connective
tissue sheets associated with some muscles),
subcuta-
neous and intermuscular
fat, and kidney and pelvic fat
(KKCF)
, according to the standard methods and pro-
cedures for lamb carcass evaluation suggested by Col-
omer-Rocher et al. ( 1988).
Regression analyses (Steel and Torrie, 1980) were
developed for predicting muscle, bone plus remainder,
total fat, subcutaneous
and intermuscular
fat, and
KKCF, using live weight and the six ultrasonic meas-
urements. The statistics
zyxwvutsrqponmlkjihgfedcbaZYXWVUTSRQPONMLKJIHGFEDCBA
R2and residual standard devi-
ation (RSD)
were used to assess the accuracy of
prediction
of ultrasonic
measurements
(Kempster
et
al., 1982b).
3.
zyxwvutsrqponmlkjihgfedcbaZYXWVUTSRQPONMLKJIHGFEDCBA
Results and discussion
Means and standard deviations of BW, carcass com-
position and ultrasonic fat depth measurements
are pre-
sented in Table 1. The percentage of variation (
R2)of
carcass composition
accounted for by BW alone, and
the increase when paired with ultrasonic
fat depth
measurements,
are given in Tables 2 and 3. BW alone
accounted for 21% (P<O.Ol),
19% (P~0.01)
and
26% (P <
0.01) of total variation of muscle, bone plus
remainder and total fat, respectively.
As shown by several authors (Shelton et al., 1977;
Jones et al., 1982; Kempster et al., 1982a), BW was
the most important measurement
for prediction of the
weight of lean carcass. However, our results show that
BW does not offer much as a predictor of carcass com-
position, as many factors affect the rate and onset of
fattening in meat animals.
Addition of the ultrasonic fat depth measurement,
taken on the right side of the lumbar region, accounted
forafurther
18% (P<O.O5),31%
(P~0.05)
and33%
(P < 0.0001) of the variation of muscle, bone plus
remainder and total carcass fat, respectively.
Shelton et al. ( 1977) developed multiple regression
equations using BW, rate of gain and ultrasonic meas-
urements of fat thickness and
longissimus
area in live
rams and found that BW was the dominant variable in
the prediction of carcass retail yield, whereas ultrasonic
measurements
had no significant contribution.
As regards fat carcass depots, BW alone accounted
for 18% (PgO.01)
and 47% (P<O.OOOl)
of total
variation of subcutaneous and intermuscular
fat respec-
Table 1
Means and standard deviations of carcass composition and ultrasonic depth measurements
Mean Standard deviation
Weights of carcass composition
Body weight (kg) 21.37 0.86
Cold carcass weight (kg) 9.97 0.52
Muscle
(g
) 2741.61 164.86Bone + remainder (g) 908.64 74.48
Total fat (g) 960.88 186.17
Subcutaneous fat
(g
) 349.88 102.98 Intermuscular fat (g) 497.18 51.98KKCF (g) 158.45 48.22
Ultrasonic depth measurements (mm)
Lumbar C-left 4.25 1.53
Lumbar C-right 4.11 1.37
Lumbar B-left 17.54 2.93
Lumbar B-right 17.04 2.44
Subcutaneous breast bone 3.07 0.80
All breast bone 18.48 2.32
162 R. De@ et al. /Small Ruminant Research 16 (1995) 159-164
Table 2
Percentage variation (R’) of carcass composition accounted for by live weight and the increase when paired with various ubrasonic depth measurements
Traits Muscle
R2 RSD (g)
Body weight Additional variate
(ultrasonic depth measurements) Lumbar C-left
Lumbar C-right Lumbar B-left Lumbar B-right
Subcutaneous breast bone All breast bone
0.21** 148.90 Increase RSD (g)
0.15 NS 144.18 0.22 NS 58.97 0.22** 138.31
0.18* 138.45 0.31* 54.19 0.33**** 113.50
0.12 NS 147.63 0.20 NS 60.04 0.05 NS 159.33
0.05 NS 153.30 0.22 NS 58.94 0.03 NS 149.94
0.07 NS 151.11 0.20 NS 58.90 -0.01 NS 162.75
0.13 NS 144.74 0.22 NS 51.83 0.05 NS 156.34
Bone + remainder Total fat
R2 RSD k) R2
0.19** 68.08 0.26**
Increase RSD (g) Increase
RSD k)
162.94 RSD (g)
NS. not significant; *P<O.O5; **P <O.Ol; ***P <O.OOI; ****P<O.OOOl. RSD, residual standard deviation.
tively; addition of the ultrasonic fat depth measurement
on the right side, and addition of the same measurement
taken on the left side, accounted for a further 36%
(P,<O.OOl)
and 15% (PgO.05)
of the variation of
these fat depots. BW alone accounted for 4% (not sig-
nificant) of the total variation of KKCF, but addition
of the ultrasonic fat depth measurement
taken on the
breast bone accounted for a further 26% (P ~0.01) of
the variation of this fat depot.
In the study of Jones et al. ( 1982), locations of
ultrasonic measurements
were considered and it was
found that fat depths on the 13th rib gave the best
prediction of carcass composition. In the present study,
sites for measuring fat depth were the lumbar region
and breast bone. Little information about this is avail-
able for lambs, but according to Hedrick (1983) the
anatomical sites for fat and muscle measurements
are
the thoracic and lumbar areas of the body. This tech-
nique requires an experienced operator and the animal
must be in a relaxed position.
The combination
of two different measurements
together with BW did not improve the prediction of
carcass composition.
For the experimental
conditions
in this study, the usefulness
of ultrasonic
fat depth
measurements
for estimating
carcass
composition
appeared to be questionable.
However, the data led to
Table 3
Percentage variation (R2) of carcass depots accounted for by live weight and the increase when paired with various ultrasonic depth measurements
Traits Subcutaneous fat Intermuscular fat KKCF
RZ RSD (g) R2 RSD lg) R2 RSD (g)
Live weight 0.1s** 94.56
Additional variate Increase RSD (g)
(ultrasonic depth measurements)
Lumbar C-left 0.24** 80.23
Lumbar C-right 0.36**** 67.65
Lumbar B-left 0.03 NS 93.91
Lumbar B-right 0.03 NS 89.06
Subcutaneous breast bone -0.01 NS 94.12
All breast bone 0.03 NS 91.77
KKCF, kidney and pelvic fat.
NS, not significant; *P<O.O5; **P<O.Ol; ***P<O.COl; ****P<O.OOOl. RSD, residual standard deviation.
0.47**** 45.16
zyxwvutsrqponmlkjihgfedcbaZYXWVUTSRQPONMLKJIHGFEDCBA
0.04 NS 47.97Increase RSD (g) Increase RSD (g)
0.15* 40.42 0.11 NS 41.05
0.13* 39.84 0.10 NS 40.97
0.09 NS 43.34 0.08 NS 41.69
0.00 NS 45.56 0.04 NS 42.38
0.02 NS 46.55 - 0.09 NS 41.52
R. Delfa et al. /Small Ruminant Research 16 (1995) 159-164 163
the conclusions that ultrasound can effectively measure
fat thickness, and that these measurements
can be com-
bined with other live measurements
to estimate carcass
composition,
mainly total fat and subcutaneous
fat.
Nevertheless,
as demonstrated
by Thompson et al.
( 1977)) Kempster ( 1981)) Fortin and Shrestha ( 1986)
and Edwards et al. ( 1989), the prediction of carcass
composition
of sheep using ultrasonic measurements
is of limited application, and perhaps the use of another
type of ultrasound machine and a different probe would
determine lamb carcass composition
more accurately.
zyxwvutsrqponmlkjihgfedcbaZYXWVUTSRQPONMLKJIHGFEDCBA
Acknowledgements
This work has been supported by the CONAI of the
Autonomic
Government
of Aragon (D.G.A.)
as part
of research nos. 689 and 904.
References
Bass, J.J., Woods, E.G. and Paulsen, W.D., 1982. A comparison of three ultrasonics machines (Danscan, AIDD (NZ) and Body Composition Meter) and subjective fat and conformation scores for predicting chemical composition of live sheep. J. Agric. Sci., 99: 529-532.
BOA, 1989. Order dated 10 July 1989, from the Department of Agriculture, Animal Production and Forestry of the Autonomous Government of Arag6n approving the Regulations for the Des- ignation of Origin ‘Temasco de Aragon’ and the corresponding Regulating Council. Bol. Of. Aragon, No. 78.
Campbell, D., Stonaker, H.H. and Esplin, A.L., 1959. The use of ultrasonics to estimate the size of the longissimus dorsi muscle in sheep. J. Anim. Sci., 24: 364-367.
Clements, B.W., Thompson, J.M., Harris, D.C. andLane, J.G., 1981. Prediction of carcase fat depth in live lambs: a comparison of techniques. Aust. J. Exp. Agric. Anim. Hush., 21: 566-569. Colomer-Rocher, F., Delfa, R. and Sierra-AlfrancaI., 1988. Metodos
normalizados para el estudio de 10s caracteres cuantitativos y cualitativos de las canales caprinas y ovinas. (Standardized method for the study of the quantitative and qualitative characters of sheep carcasses produced in the Mediterranean region, accord- ing to the production systems.) Cuad. INIA, 17: 1941, in Span- ish.
Delfa, R., 1992. Sheep carcass classification in the E.E.C. The Fifth Quarter. Serie Estudios Agrarios. Direction General de Promo-
ResumC
cion Agraria, Departamento de Agricultura, Ganaderia y Montes, Diputaci6n General de Arag6n. 177 pp., in Spanish.
Delfa, R., Teixeira, A., Blasco, I. and Colomer-Rocher, F., 1991. Ultrasonic estimates of fat thickness, C measurement and lon- gissimus dorsi depth in Rasa Aragonesa ewes with same body condition score. Options Mediterraneennes. Serie A: Seminaires Mediterraneens, ‘Etat corporel des brebis et chevres’, 13: 25-30. Edwards, J.W., Cannell, R.C., Garret, R.P., Savell, J.W., Cross, H.R.
and Longnecker, M.T., 1989. Using ultrasound, linear measure- ments and live fat thickness estimates to determine the carcass compositon on market lambs. J. Anim. Sci., 67: 3322-3330. Fortin, A. and Shrestha, J.N.B., 1986. In vivo estimation of carcass
meat by ultrasound in ram lambs slaughtered at an average live weight of 37 kg. Anim. Prod., 43: 469-475.
Hedrick, H.B., 1983. Methods of estimating live animal and carcass composition. J. Anim. Sci., 57: 13161327.
Hiner, R.L., 1958. Sound waves measure fat and lean. Meats, Decem- ber, p. 40. (Cited in Moody, W.G., Zobriski, S.E., Ross, C.V. and Naumann, H.D., 1965. Ultrasonics estimates of fat thickness and longissimus dorsi area in lambs. J. Anim. Sci., 24: 364-367.) Jones, S.D.M., Walton, J.S., Wilton, J.W. and Szkotnicki, J.E., 1982.
The use of urea dilution and ultrasonic backfat thickness to pre- dict the carcass composition of live lambs and cattle. Can. I. Anim. Sci., 62: 371-379.
Kempster, A.J., 1981. The indirect evaluation of sheep carcass com- position in breeding schemes, population studies and experi- ments. Livest. Prod. Sci., 8: 263-271.
Kempster, A.J., Cuthbertson, A., Jones, D.W. and Owen, M.G., 1977. A preliminary evaluation of the ‘Scanogram’ for predicting the carcass composition of live lambs. Anim. Prod., 24: 145-146, abstract.
Kempster, A.J., Amall, D., Alliston, J.C. and Barker, J.D., l982a. An evaluation of two ultrasonic machines (Scanogram and Dan- scanner) for predicting the body composition of live sheep. Anim. Prod., 34: 249-255.
Kempster, A.J., Cuthbertson, A. and Harrington, G., 1982b. Carcase Evaluation in Livestock Breeding Production and Marketing. Granada Publishing, Granada, 306 pp.
Moody, W.G., Zobrisky, S.E., Ross, C.V. and Naumann, H.D., 1965. Ultrasonic estimates of fat thickness and longissimus do& area in lambs. J. Anim. Sci., 24: 364-367.
Shelton, M., Smith, G.C. and Or&., F., 1977. Predicting carcass cut- ability of Rambouilletrams using live animal traits. J. Anim. Sci., 44: 333-337.
Steel, R.G.D. and Tonie, J.H., 1980. Principles and Procedures of Statistics, 2nd edn. McGraw-Hill, New York, 633 pp. Thompson, J.M., Pattie, W.A. and Butterfield, R.M., 1977. An eval-
uation of the ‘Scanogram’ as an ultrasonic aid in assessing car- case composition of live sheep. Aust. J. Exp. Agric. Anim. Husb., 17: 251-255.
164 R. D&a et al. /Small Ruminant Research 16 (1995) 159-164
Un total de 6 mesures d’tpaisseur du gras et du muscle, r&lMes en utilisant des ultrasons SW la 4i?me vertebre lombaire et la 3bme stemebre stemale, ont 6t6 rapport& a la composition de la carcasse, en ayant comme objetif d’etudier l’exactitude de ces mesums en tant qu’&ment de pr6diction de la composition de la carcasse d’agneaux vivants producteurs du ‘Temasco d’Arag6n’.
Le poids vif a lui seul a expliqu6 21, 19, 26, 18 et 47% de la variation totale du muscle, de 1’0s plus les d&hets, du gras total et du gras souscutan6 et intermusculaire, respectivement.
L’addition des mesures d’epaisseur du gras (mesure C) r6ali&s par ultrasons sur le c&e droit de la region lombaire, ont augment6 de 18, 31, 33 et 36% la precision de l’estimation de la variation totale du muscle, de 1’0s plus dkchets, du gras total et sous-coutan6 de la carcasse, respectivement. L’addition de la m&e mesure r&Me sur le cot6 gauche a augment6 de 15% la pmcision de l’estimation de la variation totale du gras intermusculaire.
Cependant, le poids vif n’a expliqu6 que 4% de la variation totale du gras pelvico-renal, mais l’addition de la mesure d’kpaisseur du gras sternal total, r&We aux ultrasons, a augment6 de 26% la pmcision de l’estimation de la variation de ce d6p6t adipeux.
La pr6cision de la pmdiction de la composition de la carcasse sur l’animal vivant pour& augmenter par l’addition de mesures de 1’6paisseur du gras r&li&s aux ultrasons.
Resumen
Delfa, R., Teixeira, A., Gonzalez, C. and Blasco, I., 1995. Ultrasonic estimates of fat thickness and longissimus dorsi depth for predicting carcass composition of live Aragon lambs. Small Rumin. Res., 16: 159-164.
Un total de 6 medidas de espesor de grasa y mdsculo realizadas mediante la utilizaci6n de ultrasonidos sobre la 4’ vertebra lumbar y la 3a estemebra de1 estem6n fueron relacionadas con la composici6n de la canal, con el principal objetivo de estudiar la exactitud de estas medidas coma predictoras de la composici6n de la canal de corderos vivos productores de ‘Temasco de Arag6n’.
El peso vivo solo exRlic6 el 21, 19, 26, 18 y 47% de la variacidn total de1 mtisculo, hueso m&s desechos, grass total y grass subcutanea e intermuscular respectivamente.
La adici6n de las medidas de espesor de grass (medida C) realizadas con ultrasonidos sobre el MO derecho de la regi6n lumbar, incrementaron un 18, 31, 33 y 36% la precisi6n de la estimaci6n de la variaci6n total del mtisculo, hueso m&s desechos, grass total y subcuttinea de la canal respectivamente. Y la adici6n de la misma medida realizada sohre el lado izquierdo increment6 un 15% la precisi6n en la estimacidn de la variaci6n total de grass intermuscular.
Sin embargo el peso vivo solo explic6 el4% de la variaci6n total de grasa pelvico-renal, pero la adicidn de la medida de espesor de grass total de1 estem6n realizada con untrasonidos, increment6 un 26% la precisi6n de la estimaci6n de la variaci6n de este dep6sito adiposo.