BGD
9, 15567–15602, 2012
UV/PAR radiations and DOM properties
in surface coastal waters
J. Para et al.
Title Page
Abstract Introduction
Conclusions References
Tables Figures
◭ ◮
◭ ◮
Back Close
Full Screen / Esc
Printer-friendly Version Interactive Discussion
Discussion
P
a
per
|
Dis
cussion
P
a
per
|
Discussion
P
a
per
|
Discussio
n
P
a
per
|
Biogeosciences Discuss., 9, 15567–15602, 2012 www.biogeosciences-discuss.net/9/15567/2012/ doi:10.5194/bgd-9-15567-2012
© Author(s) 2012. CC Attribution 3.0 License.
Biogeosciences Discussions
This discussion paper is/has been under review for the journal Biogeosciences (BG). Please refer to the corresponding final paper in BG if available.
UV/PAR radiations and DOM properties in
surface coastal waters of the Canadian
shelf of the Beaufort Sea during summer
2009
J. Para1, B. Charri `ere1, A. Matsuoka2,3, W. L. Miller4, J. F. Rontani1, and R. Semp ´er ´e1
1
Aix-Marseille Universit ´e, Mediterranean Institute of Oceanography (MIO), 13288, Marseille, Cedex 9; Universit ´e du Sud Toulon-Var, MIO, CNRS/INSU, MIO UMR7294, France
2
Laboratoire d’Oc ´eanographie de Villefranche, Universit ´e Pierre et Marie Curie (Paris 6)/CNRS/INSU, B.P. 08, Port de la Darse, Villefranche-sur-Mer Cedex, 06230, France
3
Joint International Laboratory, Universit ´e Laval (Canada) – CNRS (France), D ´epartement de Biologie and Qu ´ebec-Oc ´ean, Universit ´e Laval, Pavillon Alexandre-Vachon 1045, avenue de la M ´edecine, Local 2078, G1V 0A6, Canada
4
UGAMI/UGA Marine Science, Athens, GA 30602, USA
Received: 2 October 2012 – Accepted: 4 October 2012 – Published: 5 November 2012
Correspondence to: R. Semp ´er ´e ([email protected])
BGD
9, 15567–15602, 2012
UV/PAR radiations and DOM properties
in surface coastal waters
J. Para et al.
Title Page
Abstract Introduction
Conclusions References
Tables Figures
◭ ◮
◭ ◮
Back Close
Full Screen / Esc
Printer-friendly Version Interactive Discussion
Discussion
P
a
per
|
Dis
cussion
P
a
per
|
Discussion
P
a
per
|
Discussio
n
P
a
per
|
Abstract
Water masses from the Beaufort Sea in the Arctic Ocean were evaluated for dissolved
organic carbon (DOC), and optical characteristics including UV and PAR diffuse
atten-uation (Kd), and chromophoric and fluorescent dissolved organic matter (CDOM and FDOM) as part of the MALINA field campaign (30 July to 27 August). Even with rela-5
tively low mean daily solar radiation incident on the sea surface (0.12 ± 0.03, 8.46 ± 1.64
and 18.09 ± 4.20 kJ m−2for UV-B (305 nm), UV-A (380 nm) and PAR, respectively), we
report significant light penetration with 10 % irradiance depths (Z10 %(λ)) reaching 9.5 m for 340 nm (UV-A) radiation in the Eastern sector and 4.5 m in the Mackenzie River influ-enced area (Western sector). Spectral absorption coefficients (aCDOM(350 nm) (m−1)) 10
were significantly correlated to both diffuse attenuation coefficients (Kd) in the UV-A and UV-B and to DOC concentrations. This indicates CDOM as the dominant attenuator of UV solar radiation and suggests its use as an optical proxy for DOC concentrations
in this region. Extrapolating CDOM to DOC relationships, we estimate that ∼16 %
of the DOC in the Mackenzie River does not absorb radiation at 350 nm. DOC and 15
CDOM discharges by the Mackenzie River during the MALINA Cruise are estimated as
∼0.22 TgC and 0.18 TgC, respectively. Three dissolved fluorescent components (C1–
C3) were identified by fluorescence Excitation/Emission Matrix Spectroscopy (EEMS) and PARAFAC analysis. Our results showed an in-situ biological component (C1) that co-dominated with a terrestrial humic-like component (C2) in the Mackenzie Delta sec-20
tor, whereas the protein-like (C3) component dominated in the saltiest waters of the North East sector.
1 Introduction
Even though the Arctic Ocean comprises only ∼1 % of the Earth’s total ocean
vol-ume and∼3 % of its surface area, it currently receives∼11 % of the global river runoff 25
BGD
9, 15567–15602, 2012
UV/PAR radiations and DOM properties
in surface coastal waters
J. Para et al.
Title Page
Abstract Introduction
Conclusions References
Tables Figures
◭ ◮
◭ ◮
Back Close
Full Screen / Esc
Printer-friendly Version Interactive Discussion
Discussion
P
a
per
|
Dis
cussion
P
a
per
|
Discussion
P
a
per
|
Discussio
n
P
a
per
|
toward the Earth’s poles. Increasing air temperatures (+3 to 4◦C; IPCC, 2007)
en-hance numerous biogeochemical changes, particularly by affecting the integrity of the
permafrost (Guo et al., 2007; Walvoord and Striegl, 2007). Approximately 50 % of the global terrestrial organic carbon pool is trapped in Arctic and sub-Arctic permafrost re-gions (Tarnocai et al., 2009) that are now warming (Foley, 2005). Therefore, increases 5
in freshwater discharge coupled with changes in the mobility of terrestrial dissolved organic matter (DOM) are expected to increase DOM flux at high latitudes (Lawrence and Slater, 2005). This could lead to increased delivery of terrestrial DOM to the Arctic Ocean, as well as modified water circulation and sea ice coverage (Barber and Hane-siak, 2004).
10
Arctic rivers usually exhibit high organic matter content and low nutrient concentra-tions especially for nitrogen and phosphorus (Dittmar and Kattner, 2003). The DOM content in the Western Arctic region of the Beaufort Sea is strongly impacted by fresh-water inputs from the Mackenzie River, which currently contributes the fourth largest freshwater discharge to the Arctic (Gordeev, 2006) and is the dominant source of ter-15
restrial DOM to this region. River discharge, approximately 330 km3yr−1 varies from
4000 m3s−1during winter (from December to May) to about 25 000 m3s−1during
sum-mer (from June to August) (e.g. O’Brien et al., 2006). The Mackenzie’s flux of dissolved
organic carbon (DOC) to the coastal Beaufort Sea is estimated to be∼1.04–1.76 TgC
per year (Raymond et al., 2007). 20
The chromophoric fraction of DOM (CDOM) that absorbs solar irradiation over a broad range of ultraviolet (UV) and visible wavelengths is also delivered by the Macken-zie River. During the spring freshet and ice break up this increased amount of ter-restrial CDOM in coastal areas can have numerous biological, chemical and
physi-cal effects. The presence of terrestrial CDOM decreases the euphotic depth for
pri-25
mary production, increases photooxidation (i.e. CO and CO2production) and increases
BGD
9, 15567–15602, 2012
UV/PAR radiations and DOM properties
in surface coastal waters
J. Para et al.
Title Page
Abstract Introduction
Conclusions References
Tables Figures
◭ ◮
◭ ◮
Back Close
Full Screen / Esc
Printer-friendly Version Interactive Discussion
Discussion
P
a
per
|
Dis
cussion
P
a
per
|
Discussion
P
a
per
|
Discussio
n
P
a
per
|
day length, the influence of sea ice cover on sunlight penetration in surface waters, plume dynamics of the Mackenzie, and the changing DOM photochemical and biolog-ical reactivity in relation to season (Emmerton et al., 2008) all create a complex and highly variable photochemical environment over the Canadian shelf (Johannessen and Miller, 2001; Osburn et al., 2009). Consequently, in this Arctic environment that is so 5
susceptible to the forcings of future climate change, better knowledge of the source,
composition and surface distribution of CDOM, along with its effects on in situ optical
characteristics is crucial to better quantify the processes involved in the organic carbon cycle in surface waters and at the land/sea interface.
Here, we report the spatial distribution of CDOM optical properties, air and in-10
water sunlight optical characteristics and their evolving patterns in surface coastal waters of the Canadian shelf of the Beaufort Sea during the summer of 2009. CDOM optical properties in sampled water, in combination of three-dimensional Exci-tation/Emission Matrix Spectroscopy (EEMS) with Parallel Factor Analysis (PARAFAC), was also examined to (i) define CDOM spectral absorbance features, (ii) identify and 15
characterize the primary DOM fluorescent components and (iii) trace the correspond-ing spatial distributions of these signals in surface waters of the Canadian Arctic shelf.
2 Materials and methods
2.1 Study site and sample collection
Hydrological samples were collected from surface waters at 27 stations over the Cana-20
dian shelf of the Beaufort Sea onboard the research ice-breaker CCGS Amundsen
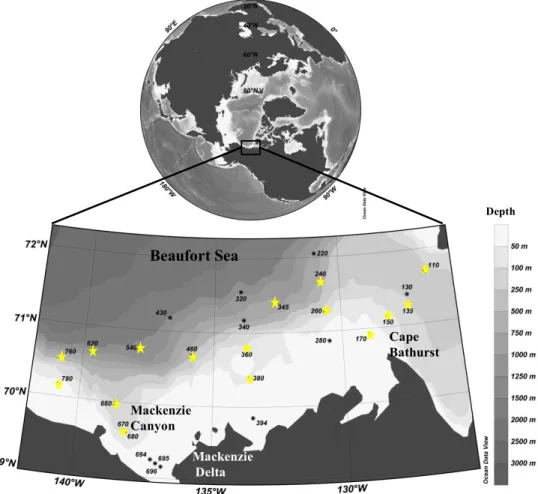
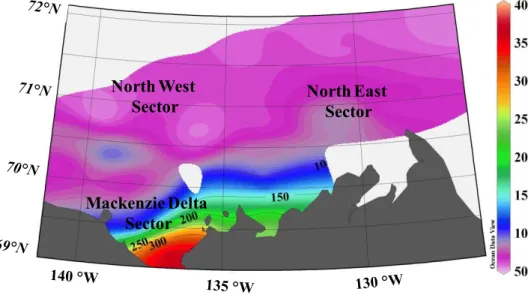
during the Mackenzie Light and Carbon (MALINA) cruise held from 30 July to 27 Au-gust 2009 (Fig. 1). During this open water study period, the Mackenzie discharge was
approximately 12 000 m3s−1(http://www.ec.gc.ca/rhc-wsc/) and the area investigated
BGD
9, 15567–15602, 2012
UV/PAR radiations and DOM properties
in surface coastal waters
J. Para et al.
Title Page
Abstract Introduction
Conclusions References
Tables Figures
◭ ◮
◭ ◮
Back Close
Full Screen / Esc
Printer-friendly Version Interactive Discussion
Discussion
P
a
per
|
Dis
cussion
P
a
per
|
Discussion
P
a
per
|
Discussio
n
P
a
per
|
Samples were collected using Niskin bottles equipped with Teflon O-rings and radia-tion in the Eastern sector contaminaradia-tion. For DOC determinaradia-tion, samples were directly
transferred from the Niskin bottle through a Polycap AS75 (Whatman®) 0.2 µm nylon
fil-ter membrane cartridge into precombusted (6 h at 450◦C) glass ampoules, immediately
acidified with 85 % H3PO4 (final pH ∼2) and flame sealed. Samples for CDOM and
5
FDOM analysis were transferred from Niskin bottles into 10 % HCl-washed and pre-combusted (6 h at 450◦C) glass bottles and directly filtered in dim light through
precom-busted 0.7 µm GF/F filters, which had been pre-rinsed with Milli-Q water (Millipore®)
water and with sample and then through 0.2 µm Nuclepore® polycarbonate filters that
had been presoaked in 10 % HCl solution and rinsed with Milli-Q water and with sam-10
ple according to the SeaWiFS protocols (Mueller and Austin, 1995). During sampling, in situ hydrological context (temperature and salinity vs. depth) was determined with a SeaBird Electronics 911 CTD profiler (Table 1).
2.2 Radiometric measurements
Duplicate in situ profiles of downward irradiance (Ed(z,λ); µW cm
−2
nm−1) were per-15
formed, under mainly overcast skies, at 16 sampling stations (Fig. 1) using a Satlantic
MicroPro® free-fall profiler equipped with OCR-504 irradiance sensors that measure
the UV-B (305 nm), UV-A (325, 340 and 380 nm) and PAR (412, 443, 490 and 565 nm)
spectral domains (Tedetti et al., 2009). Surface irradiance (Es(λ) in µW cm
−2 nm−1) was simultaneously measured at the same wavebands on the ship’s roof with match-20
ing OCR-504 sensors to account for variations in the sky conditions during the cast as well as to monitor UV and PAR solar irradiance during the day. For both the in-water and in-air OCR-504 sensors, the Full-Width Half-Maximum (FWHM) was 2 nm for the
305, 325 and 340 nm channels and 10 nm for the PAR channels. The MicroPro®
BGD
9, 15567–15602, 2012
UV/PAR radiations and DOM properties
in surface coastal waters
J. Para et al.
Title Page
Abstract Introduction
Conclusions References
Tables Figures
◭ ◮
◭ ◮
Back Close
Full Screen / Esc
Printer-friendly Version Interactive Discussion
Discussion
P
a
per
|
Dis
cussion
P
a
per
|
Discussion
P
a
per
|
Discussio
n
P
a
per
|
the front of the ship and profiled∼50 m away to minimize shadowing effects and
dis-turbances.
Each cast was accompanied by a measurement of the dark current (instrument on deck) and a pressure tare (instrument at sea surface). To obtain as many valid mea-surements as possible (i.e. tilt<5◦), the profiler was nose ballasted to provide a de-5
scent rate of∼70 cm s−1at a sampling rate of 7 Hz (i.e., sampling resolution of 10 cm).
Measurements were logged using Satlantic’s Satview®2.6 software. The latter allowed
for initial data processing, such as channel integration for PAR calculations, radiomet-ric calibration, dark correction, pressure tare application and the removal of data with tilt <5◦. Satview®’s data interpolation option was not used, choosing rather to work 10
with the raw radiometric data for Kd calculations. Profiles of downwelling irradiance in the total PAR range were calculated by Prosoft Satlantic software from the four PAR channels.
The diffuse attenuation coefficients for downwelling UVR and PAR irradiances (Kd
(λ) m−1) were calculated, assuming a homogeneous surface mixed layer, as the slope
15
of the best fit linear regression for the log-transformed downwelling irradiance data vs. depth relationship defined by the equation:
Ed(z,λ)=Ed(0
−
,λ)exp(−Kd(λ)z) (1)
Ed(0
−
,λ), the downwelling irradiance just beneath the sea surface, was computed from
above-water deck irradiance measurements,Ed (0+,λ), using the theoretical
relation-20
ship defined by Smith and Baker (1984):
Ed(0
−
,λ)=Ed(0+,λ)/(1+α) (2)
where α is the ocean surface albedo (OSA) determined using a “look up table”
(Jin et al., 2004; http://snowdog.larc.nasa.gov/jin/getocnlut.html) based on the vali-dated Coupled Ocean-Atmosphere Radiative Transfer (COART) model. Three of the 25
BGD
9, 15567–15602, 2012
UV/PAR radiations and DOM properties
in surface coastal waters
J. Para et al.
Title Page
Abstract Introduction
Conclusions References
Tables Figures
◭ ◮
◭ ◮
Back Close
Full Screen / Esc
Printer-friendly Version Interactive Discussion
Discussion
P
a
per
|
Dis
cussion
P
a
per
|
Discussion
P
a
per
|
Discussio
n
P
a
per
|
at any band of the solar spectrum are reported in Table 2 for our stations. The fourth
required parameter, chlorophyll a concentration, was set at a value of 0.1 µg l−1 for
all stations (S. B ´elanger, personal communication, 2012). Accordingly, meanαvalues
at 305, 325, 340, 380 nm and PAR were 0.062 ± 0.005, 0.062 ± 0.005, 0.065 ± 0.006, 0.069 ± 0.008 and 0.055 ± 0.001, respectively. Because attenuation in natural waters is 5
known to decrease with increasing wavelength in the UV range, anyKd(λ) value that
was lower than those at longer wavelengths was deleted. Values of Kd(λ) at 305 nm
were particularly prone to error. The mean variability (CV %) ofKd(UV) andKd(PAR)
determined between duplicate profiles was within 3 %.
2.3 DOC analysis
10
The Shimadzu instrument used in this study is the commercially available model TOC-5000 Total Carbon Analyzer with a quartz combustion column filled with 1.2 % Pt on silica pillows with modifications previously described in Sohrin and Semp ´er ´e (2005). The accuracy and the system blank of our instrument were determined by the analysis of seawater reference material (Hansell, D., Rosenstiel School of Marine and Atmo-15
spheric Science, Miami, USA), including Deep Atlantic Water (DAW) and Low Carbon Water (LCW) reference standards. The average DOC concentrations in the DAW and
in the LCW reference standards were 45 ± 2 µM C (n=24) and 1 ± 0.3 µM C (n=24),
respectively. Carbon levels in the LCW ampoules were similar to and often higher than the Milli-Q water produced in our laboratory. The nominal analytical precision for the 20
procedure was less than 2 %.
2.4 CDOM optical properties
2.4.1 Absorbance measurements
BGD
9, 15567–15602, 2012
UV/PAR radiations and DOM properties
in surface coastal waters
J. Para et al.
Title Page
Abstract Introduction
Conclusions References
Tables Figures
◭ ◮
◭ ◮
Back Close
Full Screen / Esc
Printer-friendly Version Interactive Discussion
Discussion
P
a
per
|
Dis
cussion
P
a
per
|
Discussion
P
a
per
|
Discussio
n
P
a
per
|
waveguide system (MPLCW; WPI Inc.). The detailed methodology for determining light absorbance of CDOM (280–735 nm) using this system is documented in Matsuoka et al. (2012). Spectral absorption coefficients, aCDOM(λ) (m
−1
) were obtained using the following relationship :
aCDOM(λ)=2.303A(λ)/L (3)
5
whereA(λ) (dimensionless) is the absorbance at wavelengthλ(nm) andLis the
path-length in meters. The value of the spectral slope coefficient for the CDOM spectrum
(SCDOM) was determined by fitting a non-linear exponential regression to the original
aCDOM(λ) data over the 350–500 nmspectral range (Babin et al., 2003; Matsuoka et al.,
2011, 2012). 10
2.4.2 Fluorescence measurements
For fluorescence measurements, samples were stored in the dark at 4◦C, transported
to the laboratory and analyzed in the Mediterranean Institute of Oceanography by MIO within 3 months of sampling. Samples were transferred to a 1 cm pathlength far UV
sil-ica quartz cuvette (170–2600 nm; LEADER LAB), thermostated at 4◦C and analyzed
15
with a Hitachi (Japan) Model F-7000 spectrofluorometer. Instrument settings, mea-surement protocol and spectral correction procedures are fully described in Tedetti et al. (2010) and Para et al. (2011). Briefly, the spectral correction for the instrumental response was conducted according to the procedure recommended by Hitachi (Hi-tachi F-7000 Instruction Manual). First, the excitation (Ex) instrumental response was 20
obtained by using a Rhodamine B standard and a single-side frosted red filter in the
Ex scan mode. The emission (Em) calibration was performed with a diffuser in
syn-chronous scan mode. The Ex and Em spectra obtained over the range 240–550 nm were applied internally as the instrument blank to correct subsequent spectra.
EEM spectra were generated using Ex wavelengths from 240 to 550 nm (5 nm 25
intervals), Em wavelengths from 300 to 550 nm (2 nm intervals), a scan speed of
BGD
9, 15567–15602, 2012
UV/PAR radiations and DOM properties
in surface coastal waters
J. Para et al.
Title Page
Abstract Introduction
Conclusions References
Tables Figures
◭ ◮
◭ ◮
Back Close
Full Screen / Esc
Printer-friendly Version Interactive Discussion
Discussion
P
a
per
|
Dis
cussion
P
a
per
|
Discussion
P
a
per
|
Discussio
n
P
a
per
|
Ex and Em. Milli-Q water was analyzed to allow all fluorescence data (blanks, stan-dards, samples) to be normalized to the intensity of the Raman scatter peak at Ex/Em: 275/303 nm (5 nm bandwidths) (Coble et al., 1993; Coble, 1996; Belzile et al., 2006).
Solutions of quinine sulfate (Fluka) in 0.05 M H2SO4 (1–10 ppb) were also analyzed
and FDOM data were converted into quinine sulfate units (QSU) to further normalize 5
fluorescence results and to allow comparison to previously published work.
The complex mixture of fluorophores that contribute to the total FDOM signal was then statistically decomposed into its primary components using the PARAFAC statis-tical tool based on an alternating least square (ALS) algorithm (Stedmon et al., 2003). The analysis was carried out in MATLAB 7.1 with the DOMFluor toolbox (Stedmon and 10
Bro, 2008), freely downloadable from the Chemometrics site at the University of Copen-hagen (www.models.life.ku.dk). Implementation of the toolbox for our data set followed protocols presented in Stedmon and Bro (2008). A three-component PARAFAC model was validated using split-half analysis (Stedmon et al., 2003) and provided low residual values when compared to EEM spectra obtained from the original samples, thus con-15
firming the model’s ability to extract the majority of the samples’ fluorescent features and appropriately characterize the surface FDOM composition for this area.
3 Results and discussion
3.1 Surface irradiance at sea surface and diffuse attenuation coefficient of light in surface waters
20
During the MALINA cruise, the mean daily doses (kJ m−2) of B (305 nm),
UV-A (380 nm) and PUV-AR incident on the sea surface were 0.12 ± 0.03, 8.46 ± 1.64 and
18.09 ± 4.20 kJ m−2, respectively. These mean daily doses were low and relatively
con-stant throughout the study period due to the presence of persistent clouds that re-duced the overall incident solar radiation and particularly the UV-B. Such daily doses 25
BGD
9, 15567–15602, 2012
UV/PAR radiations and DOM properties
in surface coastal waters
J. Para et al.
Title Page
Abstract Introduction
Conclusions References
Tables Figures
◭ ◮
◭ ◮
Back Close
Full Screen / Esc
Printer-friendly Version Interactive Discussion
Discussion
P
a
per
|
Dis
cussion
P
a
per
|
Discussion
P
a
per
|
Discussio
n
P
a
per
|
respectively, than that received at the sea surface in the south Pacific gyre during (austral) summer cloudy days (Semp ´er ´e et al., 2008).
The UV-BKd(305 nm) values in the North East sector averaged 0.380 ± 0.055 m
−1 . Because the overall Es (UV-B) was notably weak, the determination of Kd (UV-B) for ap-proximately 50 % of the stations sampled was not possible, particularly for the ‘organic-5
rich stations’ located mostly in the vicinity of the Mackenzie Delta (salinity≤25;
Ta-ble 2). Consequently,Kd(305 nm) is not discussed extensively in the following section.
However, it is interesting to notice thatKd(305 nm) values are in the range of those
reported for other marine areas including Arctic Baffin Bay (0.58 m−1), Antarctic wa-ters (0.29–1.15 m−1) and the Mediterranean Sea (0.14–0.92 m−1) but significantly lower 10
than those reported for Arctic Sammanger fjord (1.91–3.8 m−1) (Tedetti and Semp ´er ´e,
2006). For reference, the lowestKd(305 nm) values ever recorded in the surface ocean
(0.083 m−1) were reported for the center of the East Pacific Gyre (Tedetti et al., 2007).
Kd(λ) values determined in both the UV-A and PAR (Table 2) spectral domains
showed strong variation among the 16 sampling stations monitored (Fig. 2). Maximum 15
Kd(UV-A) and Kd(PAR) values were observed in the North West and North East
sec-tors at stations 670 (closest station to the Mackenzie Delta) and 170 (Cape Bathurst
area; Fig. 1), respectively. Minimum Kd(UV-A) and Kd(PAR) values were observed
at stations 345–360 and 460, respectively (Table 2). In the North West sector, the
mean Kd(UV-A) at 325, 340 and 380 nm and Kd(PAR) values were 1.268 ± 0.383,
20
1.055 ± 0.318, 0.512 ± 0.2145 and 0.136 ± 0.025 m−1, respectively, while the
corre-sponding values in the saltiest sector (North East sector; salinity>25) were
approx-imately 2.5- and 1.5-fold lower for UV-A and PAR, respectively (Fig. 3; Table 2). Just
as was discussed forKd (305 nm) above, Kd values for UV-A and PAR are also in the
range of those reported for other marine areas including Arctic and Antarctic waters 25
(0.29–1.15 m−1) and the Mediterranean Sea (0.14–0.92 m−1) (Tedetti and Semp ´er ´e,
2006).
BGD
9, 15567–15602, 2012
UV/PAR radiations and DOM properties
in surface coastal waters
J. Para et al.
Title Page
Abstract Introduction
Conclusions References
Tables Figures
◭ ◮
◭ ◮
Back Close
Full Screen / Esc
Printer-friendly Version Interactive Discussion
Discussion
P
a
per
|
Dis
cussion
P
a
per
|
Discussion
P
a
per
|
Discussio
n
P
a
per
|
MALINA cruise, regardless of solar radiation penetration depth. Regardless, the 10 % irradiance depth, (Z10 %(λ) in m), defined as the depth where the downward irradiance is 10 % of its surface value (Z10 %(λ)=2.3/Kd(λ)), in the North East sector had a mean
Z10 %(305) value of 6 m with this value reaching 9.5 m for Z10 %(340) (Station 540).
In the Mackenzie influenced area (Western sector),Z10 %(305) may still reach 4.5 m
5
which can be considered a significant depth for photochemical reactions in this riverine setting.
During the relatively moderate Mackenzie discharge (12 000 m3s−1; Carmack and
Macdonald, 2002) observed during the study period, the significant contribution of
ter-restrial CDOM was expected to control the overall spatial distribution of bothKd(UV-A)
10
andKd(PAR) values on the Canadian shelf and should correlate with the surface
salin-ity gradients induced by the Mackenzie’s plume. Indeed, in the North West sector both
Kd(UV-A) andKd(PAR) increased with lower salinity, whereas values remained roughly
constant or slightly increased for salinity higher than 28 in the North East sector (Fig. 3; Table 2). The downwelling attenuation of both UV-A and PAR in the North West sector 15
appeared to be mainly controlled and strongly impacted by CDOM and particles carried by the Mackenzie plume, while in the saltiest surface waters (North East sector) other CDOM sources (primary production, CDOM production by bacterioplankton) appeared to have the ability to increase attenuation of both UV-A and PAR almost as strongly as the river plume.
20
3.2 DOM characteristics
3.2.1 Chromophoric DOM
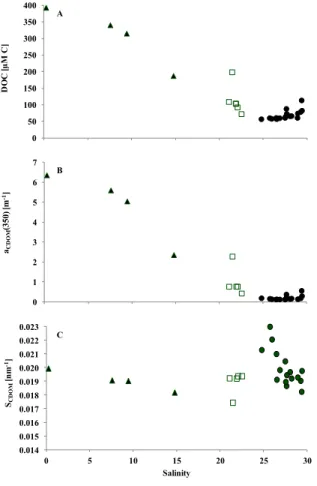
The overall DOM characteristics varied greatly among the three surface water salin-ity sectors observed for the Canadian shelf during the summer of 2009 (Figs. 4– 5; Table 1). Surface mean DOC concentrations increased from 71 ± 15 µM C in the 25
North East sector (salinity≥25) to 106 ± 45 and 310 ± 87 muM C in the North West
BGD
9, 15567–15602, 2012
UV/PAR radiations and DOM properties
in surface coastal waters
J. Para et al.
Title Page
Abstract Introduction
Conclusions References
Tables Figures
◭ ◮
◭ ◮
Back Close
Full Screen / Esc
Printer-friendly Version Interactive Discussion
Discussion
P
a
per
|
Dis
cussion
P
a
per
|
Discussion
P
a
per
|
Discussio
n
P
a
per
|
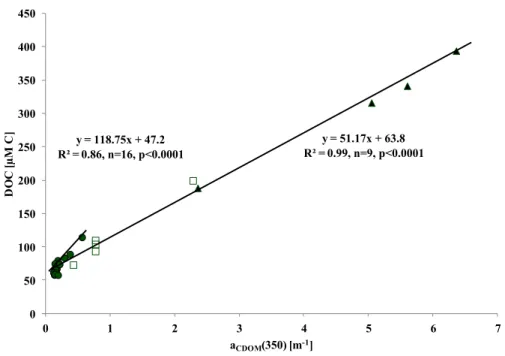
Surface mean DOC and aCDOM(350) values in the Mackenzie Delta sector were up
to 4 and 20 times higher, respectively, than in the saltiest surface waters (North East
sector; Table 1). In the Mackenzie Delta and North West sectors (salinity<25), both
aCDOM(350) and DOC values decreased linearly with salinity. These co-trending
re-lationships with the surface salinity gradient (Fig. 6) highlight the fact that in surface 5
waters, during the study period,aCDOM(350) was a good proxy for DOC in the
Macken-zie dilution plume area (Fig. 6). Matsuoka et al. (2012) observed a similar relationship
between DOC content andaCDOM(440). Although, the correlation between DOC and
aCDOM(350) is less significant for the saltiest waters of the North East sector
(salin-ity≥25),aCDOM(350) remained an acceptable proxy for DOC (Fig. 6).
10
Based on the aCDOM(350) and DOC distributions alone, it appears that the
ori-gin of DOM in each region is shifted throughout the shelf system. In the Mackenzie
Delta and North West sectors (salinity<25), the origin of the DOM appears to be
mostly allochthonous and reflects the mixing process of the Mackenzie’s terrestrial input, while in the saltiest surface waters (North East sector), autochthonous DOM 15
appears to dominate. Sea ice formation/brine rejection and upwelling processes are common physical features in this salty area and have the capacity to both deliver new DOM and enhance surface in situ production of DOM (Carmack and Macdonald, 2002; Barber and Hanesiak, 2004; Gu ´eguen et al., 2007; Walker et al., 2009; Mucci et al., 2010). Additional CDOM could be produced by zooplankton and bacterioplankton 20
communities (Nelson et al., 2004). DOM introduced by either process could have the capacity to create the attenuation patterns for both UV-A and PAR seen in Fig. 3. An up-welling event close to the Cape Bathurst area (Fig. 1) was clearly identified during our sampling period and has been previously observed by Mucci et al. (2010). It enhanced primary production in the surface waters surrounding Cape Bathurst, manifested as the 25
overall highest surface chlorophyllaconcentrations (∼7 µg l−1) observed at station 170 (S. B ´elanger, personal communication, 2012). Subsequent organic by-products from
this productive area could explain the high values for DOC,aCDOM(350) andKd(UV-A
BGD
9, 15567–15602, 2012
UV/PAR radiations and DOM properties
in surface coastal waters
J. Para et al.
Title Page
Abstract Introduction
Conclusions References
Tables Figures
◭ ◮
◭ ◮
Back Close
Full Screen / Esc
Printer-friendly Version Interactive Discussion
Discussion
P
a
per
|
Dis
cussion
P
a
per
|
Discussion
P
a
per
|
Discussio
n
P
a
per
|
In general, these results suggest both allochthonous and autochthonous origins for DOM in the surface waters of the Canadian Shelf. An additional feature of the source material can be seen in the estimation of the optically inactive fraction of the DOC pool in the study area. Using the y-intercept in Fig. 6 (i.e.aCDOM(350)=0 m
−1
) 63.8 µM of DOC do not absorb radiation at 350 nm in the Mackenzie River. Such results indicated 5
that, on average,∼16 % of the DOC are optically inactive at 350 nm in the
Macken-zie River, being in line with aCDOM(440) Matsuoka et al. (2012) results. Based on a
carbon content of∼400 µM C in the river mouth (Table 1) the DOC discharge by the
Mackenzie River can be estimated, during the MALINA Cruise (30 July–27 August) to approximately 0.22 TgC (i.e. 10 to 20 % of annual DOC fluxes and 6 to 10 % of annual 10
TOC fluxes, Raymond et al., 2007; MacDonald et al., 1998). Considering that∼64 µM C
does not absorb radiation in the UV (Fig. 6), CDOM discharge can be estimated to be 0.186 TgC. Previous study showed comparable discharge for particulate and dissolved organic carbon on an annual basis (Macdonald et al., 1998; Dittmar and Kattner, 2003).
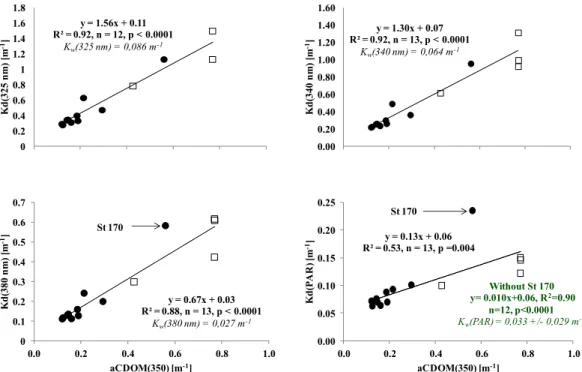
Kd(UV-A) and Kd(PAR) in the North West and North East sectors (i.e., at
salin-15
ity>20; where radiometric measurements were performed) were significantly
corre-lated toaCDOM(350) values (Fig. 7) except for the single Kd(PAR) value observed at
station 170 (Fig. 7) where the highest chlorophyll-a content occurred (7 µg l−1, data not
shown and aCDOM(350)=0.56 m
−1
). Interestingly, the y-intercept values of these
re-lationships (Fig. 7) were in the range of attenuation coefficient values found for pure
20
water, Kw(λ), determined by Baker and Smith (1982). Therefore, it can be argued that
CDOM is the dominant attenuator for not only UV-A radiation, but also for PAR. This is in good agreement with Retamal et al. (2008) and their report of control of PAR-light absorbance by CDOM in the Beaufort Sea.
The spatial evolution of SCDOM values and the specific absorption coefficient at
25
350 nm, aCDOM(350), (calculated as aCDOM(350)/DOC; Table 2) are both expected
BGD
9, 15567–15602, 2012
UV/PAR radiations and DOM properties
in surface coastal waters
J. Para et al.
Title Page
Abstract Introduction
Conclusions References
Tables Figures
◭ ◮
◭ ◮
Back Close
Full Screen / Esc
Printer-friendly Version Interactive Discussion
Discussion
P
a
per
|
Dis
cussion
P
a
per
|
Discussion
P
a
per
|
Discussio
n
P
a
per
|
significant difference among meanSCDOMvalues for each salinity sector (Table 1)
de-spite the relative scatter ofSCDOMvalues observed at salinity>25 (Fig. 5c). This could
be attributed to the highSCDOMvalues determined for the allochthonous CDOM of the
Mackenzie Delta sector (SCDOM=0.019±0.001 nm−1) that are more typical of marine
CDOM thus preventing a clear spatial contrast inSCDOMvalues throughout the system.
5
However, the highSCDOM values for the Mackenzie Delta sector are similar to values
previously reported for CDOM from the Mackenzie River during summer (Retamal et al., 2007; Osburn et al., 2009; Stedmon et al., 2011). Stedmon et al. (2011) and
Os-burn et al. (2009) attributed these highSCDOMvalues to preferential adsorption by high
molecular weight, hydrophobic DOM components of the abundant suspended sedi-10
ments as well as more extensive photodegradation of the high molecular weight
frac-tion in the important Mackenzie watershed. Interestingly,aCDOM(350) values which can
be used as a proxy of terrestrial/aromatic CDOM in the DOC pool (Belzile et al., 2002;
Gareis et al., 2010), were 5–6 times higher (15.24 ± 1.84 m2µmol−1) in the Mackenzie
Delta sector than in the North East sector (2.71 ± 0.86 m2µmol−1). 15
3.2.2 Fluorescent DOM – fluorescent component characteristics
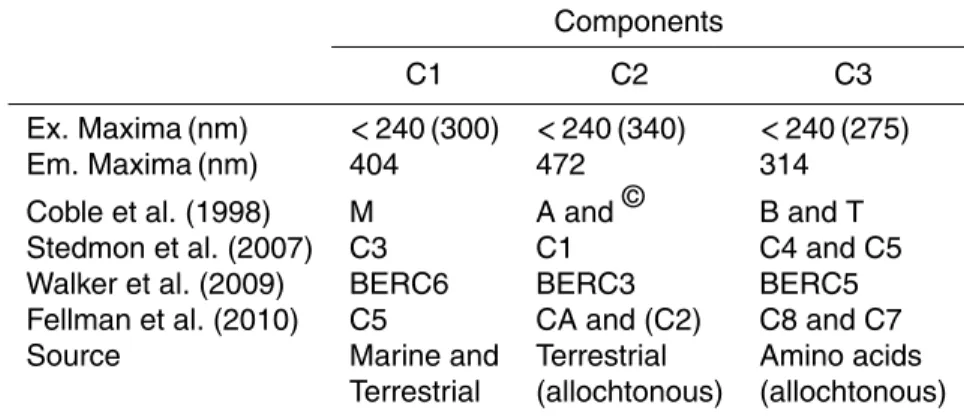
Three fluorescent components (Fig. 8) were identified with PARAFAC analysis using a total of 54 EEM spectra collected from surface waters and the deep chlorophyll maximum (DCM) for the 27 stations investigated during the MALINA cruise. Excita-tion/Emission (Ex/Em) maxima wavelengths of the three components are presented in 20
Table 3 and compared to recent Arctic and sub-Arctic studies (Stedmon et al., 2007; Walker et al., 2009; Fellman et al., 2010). The Ex/Em maxima of component 1 (C1) are close to the marine humic-like (M peak) proposed by Coble (1996) and has been reported to be a ubiquitous component derived from the microbial degradation of phyto-plankton by-products (Nagata, 2000; Stedmon and Markager, 2005; Zhang et al., 2009) 25
BGD
9, 15567–15602, 2012
UV/PAR radiations and DOM properties
in surface coastal waters
J. Para et al.
Title Page
Abstract Introduction
Conclusions References
Tables Figures
◭ ◮
◭ ◮
Back Close
Full Screen / Esc
Printer-friendly Version Interactive Discussion
Discussion
P
a
per
|
Dis
cussion
P
a
per
|
Discussion
P
a
per
|
Discussio
n
P
a
per
|
matter (Stedmon et al., 2003; Walker et al., 2009). The low Ex/Em maxima of C3 are comparable to protein-like components previously observed in surface waters of fresh and marine systems (Coble, 1996; Yamashita et al., 2003; Para et al., 2010).
Our results showed that the C1 and C2 components are significantly correlated
with both salinity (negative linear correlation) and aCDOM(350) (positive linear
corre-5
lation) in the Delta and North West sectors (Figs. 9–10). Interestingly, at higher salinity
(S≥25, North-East sector) the correlations are no longer observed. The C3
compo-nent did not exhibit any correlation with either salinity oraCDOM(350). In the North East sector (salinity>25), the relative contribution of fluorescent components was clearly dominated by the protein-like C3 (57 ± 7 %), followed by the ubiquitous humic-like C1 10
(30 ± 4 %) and the terrestrial C2 (13 ± 4 %), respectively. In surface waters of the North
West sector (15<salinity<25), we observed a co-dominance of both C1 (40 ± 8 %)
and C3 (40 ± 13 %) while the relative contribution of the terrestrial component C2 was
around two times lower (20 ± 6 %). In the Mackenzie Delta sector (salinity<15), the
relative contribution of the in-situ biological component C1 (52 ± 2 %) and terrestrial 15
component C2 (36 ± 6 %) reached their highest contribution, while C3 (12 ± 7 %) was around 5 times lower than the same component determined for the saltiest surface waters.
Therefore, during our study period, the FDOM content in surface waters of the Cana-dian shelf was strongly influenced by allochthonous DOM that originated from the 20
Mackenzie, except in the saltiest waters where autochthonous in-situ biological FDOM prevailed. Surprisingly, the allochthonous fluorescent DOM carried by the Mackenzie into the Beaufort Sea presents both a terrestrial humic and a in-situ biological signature. Indeed, the fluorescence intensity of the in-situ biological component C1 co-dominated with the terrestrial humic-like component C2 in controlling the overall allochthonous flu-25
BGD
9, 15567–15602, 2012
UV/PAR radiations and DOM properties
in surface coastal waters
J. Para et al.
Title Page
Abstract Introduction
Conclusions References
Tables Figures
◭ ◮
◭ ◮
Back Close
Full Screen / Esc
Printer-friendly Version Interactive Discussion
Discussion
P
a
per
|
Dis
cussion
P
a
per
|
Discussion
P
a
per
|
Discussio
n
P
a
per
|
surface distribution of the in-situ biological component C1 appeared more widespread in the whole system.
The Mackenzie Delta is composed of numerous (∼45 000) shallow (1.6 m depth on
average) macrophyte-rich lakes (Emmerton et al., 2007; Squires et al., 2009) that sig-nificantly influence the Mackenzie DOM content prior to its marine discharge in summer 5
(Emmerton et al., 2008; Gareis et al., 2010). In addition, macrophyte and phytoplank-ton degradation/exudation processes in fresh shallow (Zhang et al., 2009) and marine systems can lead to the production of a marine humic-like fluorescent component (M peak; Coble, 1996) comparable to our C1. Therefore, the strong in situ biological flu-orescent DOM fraction observed in the Mackenzie Delta sector during this study may 10
partly originate from strong biological activity (Squires et al., 2009) occurring in these catchments. This finding complements previous work and provides valuable evidence concerning the Mackenzie organic matter quality which is depleted in humic material as reported previously during summer time; this depletion is attributed to (i) a long fresh-water residence time in Mackenzie catchments (Retamal et al., 2007), (ii) a preferen-15
tial sorption of the high molecular weight hydrophobic DOM components to abundant suspended sediments (Stedmon et al., 2011) and (iii) a more extensive photodegrada-tion of the high molecular weight fracphotodegrada-tion occurring in the Mackenzie watershed during summer (Osburn et al., 2009).
4 Conclusions
20
In this study, the specific absorbance (aCDOM(350)) and the magnitude of CDOM in the
Mackenzie Delta sector (salinity<15) were significantly higher than those observed in the saltiest waters (salinity>25) while the values for the intermediate salinity sector (15<salinity<25) were characteristic of a DOM transition zone. Surface CDOM, that could be considered the dominant attenuator of UV-A and PAR radiation, was a good 25
proxy for DOC in both the Mackenzie dilution plume area (salinity<25 conservative
BGD
9, 15567–15602, 2012
UV/PAR radiations and DOM properties
in surface coastal waters
J. Para et al.
Title Page
Abstract Introduction
Conclusions References
Tables Figures
◭ ◮
◭ ◮
Back Close
Full Screen / Esc
Printer-friendly Version Interactive Discussion
Discussion
P
a
per
|
Dis
cussion
P
a
per
|
Discussion
P
a
per
|
Discussio
n
P
a
per
|
a limited DOM photodegradation process). DespiteSCDOMvalues being similar across
the different surface salinity sectors, two distinct origins of the absorbent DOM content were observed throughout this system. The reactive allochthonous DOM dominated
only in the Mackenzie Delta sector (salinity<15) and the autochthonous DOM was
prevalent in the North East sector (salinity>25). 5
The EEM composition was surprisingly dominated by both biological components through the system. The spatial distribution of the protein-like component C3 was
rela-tively homogeneous throughout the system except at specific offshore stations where
processes leading to its in situ production occurred. In contrast, the overall distribution of the terrestrial component C2 appeared was restricted to the Mackenzie Delta sec-10
tor and paralleled exactly the highly absorbing allochthonous CDOM observed. The surface distribution of the in-situ biological component C1 appeared more widespread than the terrestrial component C2 throughout the system, most likely due to the ubiq-uitous nature of its formation. However, it is clear and surprising that the strongest C1 signature was observed in the Mackenzie Delta sector. This in-situ biological compo-15
nent probably originates from the important phytoplanktonic and macrophytic activity (Squires et al., 2009) occurring in the open waters of the Mackenzie’s freshwater catch-ment prior its marine discharge.
This finding provides valuable information concerning the Mackenzie River’s organic matter quality which appears to be depleted in humic terrestrial materials as noted pre-20
viously during summer, this depletion is attributed to (i) a high freshwater residence time in Mackenzie catchments (Retamal et al., 2007), (ii) a preferential adsorption of the high molecular hydrophobic DOM components to abundant suspended sediments (Stedmon et al., 2011) and (iii) a more extensive photodegradation of the high molecu-lar weight fraction occurring in the vast Mackenzie watershed during the summer period 25
BGD
9, 15567–15602, 2012
UV/PAR radiations and DOM properties
in surface coastal waters
J. Para et al.
Title Page
Abstract Introduction
Conclusions References
Tables Figures
◭ ◮
◭ ◮
Back Close
Full Screen / Esc
Printer-friendly Version Interactive Discussion
Discussion
P
a
per
|
Dis
cussion
P
a
per
|
Discussion
P
a
per
|
Discussio
n
P
a
per
|
waters of the Canadian Basin may be the result of a biological CDOM mixture produced either in the watershed (terrestrial) and in-situ.
Acknowledgements. This study was conducted as part of the Malina Scientific Program funded
by ANR (Agence nationale de la recherche), INSU-CNRS (Institut national des sciences de l’Univers – Centre national de la recherche scientifique), CNES (Centre national d’ ´etudes
spa-5
tiales) and ESA (European Space Agency). We are grateful to M. Babin PI of the Malina Project as well as the captain and crews of the Canadian Icebreaker CCGS Amundsen. We also thank S. Belanger, A. Mucci, B. Lansard and C. Stedmon for SIM/Chladata and PARAFAC analysis. Special thanks are due to C. Marec and Y. Graton for water sampling. We are grateful to Marc Tedetti and Madeleine Goutx for their help for fluorescence analyse. R. Sempere acknowledges
10
funding from Conseil g ´en ´eral des Bouches du Rh ˆone. PhD scholarship to J. Para was provided by the Region of Provence Alpes C ˆote d’Azur and AtmoPACA.
The publication of this article is financed by CNRS-INSU.
15
References
Babin, M., Stramski, D., Ferrari, G. M., Claustre, H., Bricaud, A., Obolensky, G., and Hoepffner, N.: Variations in the light absorption coefficients of phytoplankton, nonalgal particles, and dissolved organic matter in coastal waters around Europe, J. Geophys. Res., 108, 1–20, doi:10.1029/2001JC000882, 2003.
20
BGD
9, 15567–15602, 2012
UV/PAR radiations and DOM properties
in surface coastal waters
J. Para et al.
Title Page
Abstract Introduction
Conclusions References
Tables Figures
◭ ◮
◭ ◮
Back Close
Full Screen / Esc
Printer-friendly Version Interactive Discussion
Discussion
P
a
per
|
Dis
cussion
P
a
per
|
Discussion
P
a
per
|
Discussio
n
P
a
per
|
Barber, D. G. and Hanesiak, J.: Meteorological forcing of sea ice concentrations in the Southern Beaufort Sea over the period 1978 to 2001, J. Geophys. Res., 109, C06014, doi:10.1029/2003JC00202, 2004.
Belzile, C., Vincent, W. F., and Kumagai, M.: Contribution of absorption and scattering to the attenuation of UV and photosynthetically available radiation in Lake Biwa, Limnol. Oceanogr.,
5
47, 95–107, doi:10.1029/2003JC002027, 2002.
Belzile, C., Roesler, C. S., Christensen, J. P., Shakhova, N., and Semiletov, I.: Fluorescence measured using the WETStar DOM fluorometer as a proxy for dissolved matter absorption, Estuar. Coast. Shelf S., 67, 441–449, 2006.
Carmack, E. C. and Macdonald, R. W.: Oceanography of the Canadian shelf of the Beaufort
10
Sea: a setting for marine life, Arctic, 55 (Suppl. 1), 29–45, 2002.
Coble, P. G.: Characterization of marine and terrestrial DOM in seawater using excitation emis-sion matrix spectroscopy, Mar. Chem., 51, 325–346, 1996.
Coble, P. G., Schultz, C. A., and Mopper, K.: Fluorescence contouring analysis of DOC inter-calibration experiments samples: a comparison of techniques, Mar. Chem., 41, 173–178,
15
1993.
Coble, P. G., Del Castillo, C. E., and Avril, B.: Distribution and optical properties of CDOM in the Arabian Sea during the 1995 southwest monsoon, Deep-Sea Res., II, 45, 2195–2223, 1998.
Dittmar, T. and Kattner, G.: The biogeochemistry of the river and shelf ecosystem of the Arctic
20
Ocean, a review, Mar. Chem., 83, 103–120, 2003.
Emmerton, C. A., Lesack, L. F. W., and Marsh, P.: Lake abundance, potential water storage, and habitat distribution in the Mackenzie River Delta, western Canadian Arctic, Water Resour. Res., 43, W05419, doi:10.1029/2006WR005139, 2007.
Emmerton, C. A., Lesack, L. F. W., and Vincent, W. F.: Mackenzie River nutrient delivery to
25
the Arctic Ocean and effects of the Mackenzie Delta during open water conditions, Glob. Biogeochem. Cycles, 22, GB1024, doi:10.1029/2006GB002856, 2008.
Fellman, J. B., Spencer, R. G. M., Hernes, P. J., Edwards, R. T., D’Amore, D. V., and Hood, E.: The impacts of glacier runoff on the biodegradability and biochemical composition of terrigenous dissolved organic matter in near-shore marine ecosystems, Mar. Chem., 121,
30
112–122, 2010.
BGD
9, 15567–15602, 2012
UV/PAR radiations and DOM properties
in surface coastal waters
J. Para et al.
Title Page
Abstract Introduction
Conclusions References
Tables Figures
◭ ◮
◭ ◮
Back Close
Full Screen / Esc
Printer-friendly Version Interactive Discussion
Discussion
P
a
per
|
Dis
cussion
P
a
per
|
Discussion
P
a
per
|
Discussio
n
P
a
per
|
Gareis, J. A. L., Lesack, L. F. W., and Bothwell, M. L.: Attenuation of in situ UV radiation in Mackenzie Delta lakes with varying dissolved organic matter compositions, Water Resour. Res., 46, W09516, doi:10.1029/2009WR008747, 2010.
Gordeev, V. V.: Fluvial sediment flux to the Arctic Ocean, Geomorphology, 80, 94–104, doi:10.1016/j.geomorph.2005.09.008, 2006.
5
Gu ´eguen, C., Guo, L., Yamamoto-Kawai, M., and Tanaka, N.: Colored dissolved organic matter dynamics across the shelf-basin interface in the western Arctic Ocean, J. Geophys. Res., 112, C05038, doi:10.1029/2006JC003584, 2007.
Guo, L., Ping, C. L., and Macdonald, R. W.: Mobilization pathways of organic carbon from permafrost to arctic rivers in a changing climate, Geophys. Res. Lett., 34, L13603,
10
doi:10.1029/2007GL030689, 2007.
IPCC Climate Change: The Physical Science Basis: Contribution of Working Group I to the Fourth Assessment Report of the IPCC, Cambridge University, Cambridge, 7, 514–515, 2007.
Jin, Z., Charlock, T., Smith Jr., W., and Rutledge, K.: A parameterization of ocean surface
15
albedo, Geophys. Res. Lett., 31, L22301, doi:10.1029/2004GL021180, 2004.
Johannessen, S. C. and Miller, W. L.: Quantum yield for the photochemical production of dis-solved inorganic carbon in seawater, Mar. Chem., 76, 271–283, 2001.
Lawrence, D. M. and Slater, A. G.: A projection of severe nearsurface permafrost degrada-tion during the 21st century, Geophys. Res. Lett., 32, L24401, doi:10.1029/2005GL025080,
20
2005.
Macdonald, R. W., Solomon, S. M., Cranston, R. E., Welch, H. E., Yunker, M. B., and Gobeil, C.: A sediment and organic carbon budget for the Canadian Beaufort, Sea. Mar. Geol., 144, 255–273, 1998.
Matsuoka, A., Hill, V., Huot, Y., Bricaud, A., and Babin, M.: Seasonal variability in the light
25
absorption properties of western Arctic waters: parameterization of the individual compo-nents of absorption for ocean color applications, J. Geophys. Res., 116, 8, 11003–11040, doi:10.1029/2009JC005594, 2011.
Matsuoka, A., Bricaud, A., Benner, R., Para, J., Semp ´er ´e, R., Prieur, L., B ´elanger, S., and Babin, M.: Tracing the transport of colored dissolved organic matter in water masses of the
30
BGD
9, 15567–15602, 2012
UV/PAR radiations and DOM properties
in surface coastal waters
J. Para et al.
Title Page
Abstract Introduction
Conclusions References
Tables Figures
◭ ◮
◭ ◮
Back Close
Full Screen / Esc
Printer-friendly Version Interactive Discussion
Discussion
P
a
per
|
Dis
cussion
P
a
per
|
Discussion
P
a
per
|
Discussio
n
P
a
per
|
Mucci, A., Lansard, B., Miller, L. A., and Papakyriakou, T. N.: CO2 fluxes across the air-sea interface in the southeastern Beaufort Sea: Ice-free period, J. Geophys. Res., 115, C04003, doi:10.1029/2009JC005330, 2010.
Mueller, J. L. and Austin, R. W.: Ocean Optics Protocols for SeaWiFS Validation, Revision 1. NASA Tech. Memo. 104566, edited by: Hooker, S. B., Firestone, E. R., and Acker, J. G.,
5
NASA GSFC, Greenbelt, Maryland, 25, 67 pp., 1995.
Nagata, T.: Production mechanisms of Dissolved Organic Matter, in: Microbial Ecology of the Oceans, edited by: Kirchman, D. L., Wiley-Liss, New York, 5, 121–152, 2000.
Nelson, N. B., Carlson, C. A., and Steinberg, D. K.: Production of chromophoric dissolved or-ganic matter by Sargasso Sea microbes, Mar. Chem., 89, 273–287, 2004.
10
O’Brien, M. C., Macdonald, R. W., Melling, H., and Iseki, K.: Particle fluxes and geochemistry on the Canadian Beaufort Shelf: implications for sediment transport and deposition, Cont. Shelf Res., 26, 41–81, 2006.
Opsahl, S., Benner, R., and Amon, R.: Major flux of terrigenous dissolved organic matter through the Arctic Ocean, Limnol. Oceanogr., 44, 2017–2023, 1999.
15
Osburn, C. L., O’Sullivan, D. W., and Boyd, T. J.: Increases in the longwave photobleaching of chromophoric dissolved organic matter in coastal waters, Limnol. Oceanogr., 54, 145–159, 2009.
Para, J., Coble, P. G., Charri `ere, B., Tedetti, M., Fontana, C., and Semp ´er ´e, R.: Fluorescence and absorption properties of chromophoric dissolved organic matter (CDOM) in coastal
sur-20
face waters of the northwestern Mediterranean Sea, influence of the Rh ˆone River, Biogeo-sciences, 7, 4083–4103, doi:10.5194/bg-7-4083-2010, 2010.
Raymond, P. A., McClelland, J. W., Holmes, R. M., and Zhulidov, A. V.: Flux and age of dissolved organic carbon exported to the Arctic Ocean: A carbon isotopic study of the five largest Arctic rivers, Global Biogeochem. Cycles, 21, GB4011, doi:10.1029/2007GB002934, 2007.
25
Retamal, L., Vincent, W. F., Martineau, C., and Osburn, C. L.: Comparison of the optical prop-erties of dissolved organic matter in two river in?uenced coastal regions of the Canadian Arctic, Estuar. Coast. Shelf Sci., 72, 261–272, 2007.
Retamal, L., Bonilla, S., and Vincent, W. F.: Optical gradients and phytoplankton production in the Mackenzie River and the coastal Beaufort Sea, Polar Biol., 31, 363–379, 2008.
30
BGD
9, 15567–15602, 2012
UV/PAR radiations and DOM properties
in surface coastal waters
J. Para et al.
Title Page
Abstract Introduction
Conclusions References
Tables Figures
◭ ◮
◭ ◮
Back Close
Full Screen / Esc
Printer-friendly Version Interactive Discussion
Discussion
P
a
per
|
Dis
cussion
P
a
per
|
Discussion
P
a
per
|
Discussio
n
P
a
per
|
Smith, R. C. and Baker, K. S.: The analysis of ocean optical data, Proceedings of The Society of Photo-Optical Instrumentation Engineers, Ocean Optics VII, 489, 119–126, 1984.
Sohrin, R. and Semp ´er ´e, R.: Seasonal variation in total organic carbon in the Northeast Atlantic in 2000–2001, J. Geophys. Res., 110, C10S90, doi:10.1029/2004JC002731, 2005.
Squires, M. M., Lesack, L. F. W., Hecky, R. E., Guildford, S. J., Ramlal, P., and Higgins, S.
5
N.: Primary Production and Carbon Dioxide Metabolic Balance of a Lake-Rich Arctic River Floodplain: Partitioning of Phytoplankton, Epipelon, Macrophyte, and Epiphyton Production Among Lakes of the Mackenzie Delta, Ecosystems, 12, 853–872, doi:10.1007/s10021-009-9263-3, 2009.
Stedmon, C. A. and Bro, R.: Characterizing dissolved organic matter fluorescence with parallel
10
factor analysis, a tutorial, Limnol. Oceanogr. Methods, 6, 572–579, 2008.
Stedmon, C. A. and Markager, S.: Tracing the production and degradation of autochthonous fractions of dissolved organic matter using fluorescence analysis, Limnol. Oceanogr., 50, 1415–1426, 2005.
Stedmon, C. A., Markager, S., and Bro, R.: Tracing dissolved organic matter in aquatic
envi-15
ronments using a new approach to fluorescence spectroscopy, Mar. Chem., 82, 239–254, doi:10.1016/S0304-4203(03)00072-0, 2003.
Stedmon, C. A., Thomas, D. N., Granskog, M., Kaartokallio, H., Papadimitriou, S., and Kuosa, H.: Characteristics of dissolved organic matter in Baltic coastal sea ice: allochthonous or autochthonous origins?, Environ. Sci. Technol., 41, 7273–7279, 2007.
20
Stedmon, C. A., Amon, R. M. W., Rinehart, A. J., and Walker, S. A.: The supply and character-istics of colored dissolved organic matter (CDOM) in the Arctic Ocean: Pan Arctic trends and differences, Mar. Chem., 124, 108–118, 2011.
Tarnocai, C., Canadell, J. G., Schuur, E. A. G., Kuhry, P., Mazhitova, G., and Zimov, S.: Soil organic carbon pools in the northern circumpolar permafrost region, Glob. Biogeochem.
Cy-25
cles, 23, GB2023, doi:10.1029/2008GB003327, 2009.
Tedetti, M. and Semp ´er ´e, R.: Penetration of Ultraviolet Radiation in the Marine Environment, a Review, Photochem. Photobiol., 82, 389–397, 2006.
Tedetti, M., Semp ´er ´e, R., Vasilkov, A., Charri `ere, B., N ´erini, D., Miller, W.L., Kawamura, K., Raimbault, P.: High penetration of ultraviolet radiation in the south east Pacific waters,
Geo-30
BGD
9, 15567–15602, 2012
UV/PAR radiations and DOM properties
in surface coastal waters
J. Para et al.
Title Page
Abstract Introduction
Conclusions References
Tables Figures
◭ ◮
◭ ◮
Back Close
Full Screen / Esc
Printer-friendly Version Interactive Discussion
Discussion
P
a
per
|
Dis
cussion
P
a
per
|
Discussion
P
a
per
|
Discussio
n
P
a
per
|
Tedetti, M., Guigue, C., and Goutx, M.: Utilization of a submersible UV fluorometer for monitor-ing anthropogenic inputs in the Mediterranean coastal waters, Mar. Pollut. Bull., 60, 350–362, 2010.
Walker, S. A., Amon, R. M. W., Stedmon, C., Duan, S., and Louchouarn, P.: The use of PARAFAC modeling to trace terrestrial dissolved organic matter and fingerprint
wa-5
ter masses in coastal Canadian Arctic surface waters, J. Geophys. Res., 114, G00F06, doi:10.1029/2009JG000990, 2009.
Walvoord, M. A. and Striegl, R. G.: Increased groundwater to stream discharge from permafrost thawing in the Yukon River basin: potential impacts on lateral export of carbon and nitrogen, Geophys. Res. Lett., 34, L12402, doi:10.1029/2007GL030216, 2007.
10
Yamashita, Y. and Tanoue, E.: Chemical characterization of protein-like fluorophores in DOM in relation to aromatic amino acids, Mar. Chem., 82, 255–271, 2003.
Zhang, Y., van Dijk, M. A., Liu, M., Zhu, G., and Qin, B.: The contribution of phytoplankton degradation to chromophoric dissolved organic matter (CDOM) in eutrophic shallow lakes: field and experimental evidence, Water. Res., 43, 4685–4697, 2009.
BGD
9, 15567–15602, 2012
UV/PAR radiations and DOM properties
in surface coastal waters
J. Para et al.
Title Page
Abstract Introduction
Conclusions References
Tables Figures
◭ ◮
◭ ◮
Back Close
Full Screen / Esc
Printer-friendly Version Interactive Discussion
Discussion
P
a
per
|
Dis
cussion
P
a
per
|
Discussion
P
a
per
|
Discussio
n
P
a
per
|
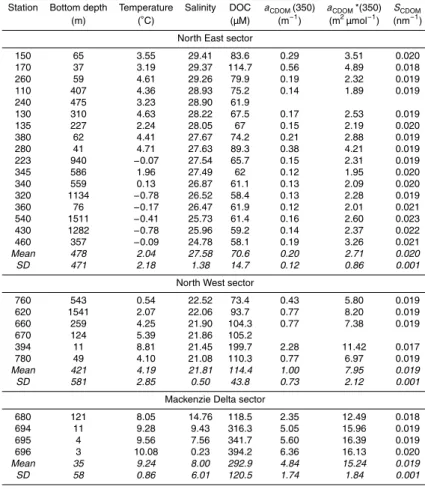
Table 1. Bottom depth, temperature, salinity, DOC and absorbance properties,
includ-ing CDOM absorption coefficient, spectral slope and the specific absorption coefficient at 350 nm(aCDOM*(350) determined in surface waters of each sampling stations and among the
different sectors investigated (i.e. North East, North West and Mackenzie Delta sectors) ob-served.
Station Bottom depth Temperature Salinity DOC aCDOM(350) aCDOM*(350) SCDOM
(m) (◦C) (µM) (m−1) (m2µmol−1) (nm−1)
North East sector
150 65 3.55 29.41 83.6 0.29 3.51 0.020
170 37 3.19 29.37 114.7 0.56 4.89 0.018
260 59 4.61 29.26 79.9 0.19 2.32 0.019
110 407 4.36 28.93 75.2 0.14 1.89 0.019
240 475 3.23 28.90 61.9
130 310 4.63 28.22 67.5 0.17 2.53 0.019
135 227 2.24 28.05 67 0.15 2.19 0.020
380 62 4.41 27.67 74.2 0.21 2.88 0.019
280 41 4.71 27.63 89.3 0.38 4.21 0.019
223 940 −0.07 27.54 65.7 0.15 2.31 0.019
345 586 1.96 27.49 62 0.12 1.95 0.020
340 559 0.13 26.87 61.1 0.13 2.09 0.020
320 1134 −0.78 26.52 58.4 0.13 2.28 0.019
360 76 −0.17 26.47 61.9 0.12 2.01 0.021
540 1511 −0.41 25.73 61.4 0.16 2.60 0.023
430 1282 −0.78 25.96 59.2 0.14 2.37 0.022
460 357 −0.09 24.78 58.1 0.19 3.26 0.021
Mean 478 2.04 27.58 70.6 0.20 2.71 0.020
SD 471 2.18 1.38 14.7 0.12 0.86 0.001
North West sector
760 543 0.54 22.52 73.4 0.43 5.80 0.019
620 1541 2.07 22.06 93.7 0.77 8.20 0.019
660 259 4.25 21.90 104.3 0.77 7.38 0.019
670 124 5.39 21.86 105.2
394 11 8.81 21.45 199.7 2.28 11.42 0.017
780 49 4.10 21.08 110.3 0.77 6.97 0.019
Mean 421 4.19 21.81 114.4 1.00 7.95 0.019
SD 581 2.85 0.50 43.8 0.73 2.12 0.001
Mackenzie Delta sector
680 121 8.05 14.76 118.5 2.35 12.49 0.018
694 11 9.28 9.43 316.3 5.05 15.96 0.019
695 4 9.56 7.56 341.7 5.60 16.39 0.019
696 3 10.08 0.23 394.2 6.36 16.13 0.020
Mean 35 9.24 8.00 292.9 4.84 15.24 0.019
BGD
9, 15567–15602, 2012
UV/PAR radiations and DOM properties
in surface coastal waters
J. Para et al.
Title Page
Abstract Introduction
Conclusions References
Tables Figures
◭ ◮
◭ ◮
Back Close
Full Screen / Esc
Printer-friendly Version Interactive Discussion
Discussion
P
a
per
|
Dis
cussion
P
a
per
|
Discussion
P
a
per
|
Discussio
n
P
a
per
|
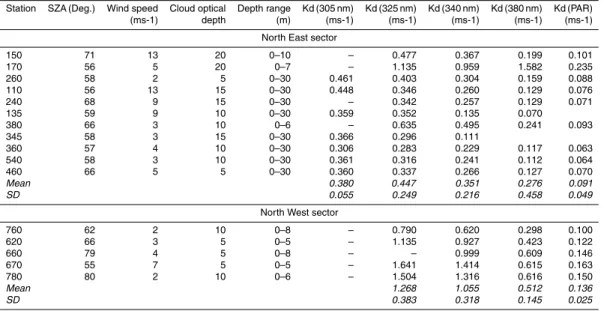
Table 2.Values of diffuse attenuation coefficient of light in the UV-B (305 nm), UV-A (325, 340
and 380 nm) and PAR spectral domains determined in surface waters of each sampling stations and among the different sectors. Environmental conditions, including SZA, wind speed, cloud optical depth estimation are also reported as well as the maximal depth range from which surfaceKd(λ) values were derived.
Station SZA (Deg.) Wind speed Cloud optical Depth range Kd (305 nm) Kd (325 nm) Kd (340 nm) Kd (380 nm) Kd (PAR)
(ms-1) depth (m) (ms-1) (ms-1) (ms-1) (ms-1) (ms-1)
North East sector
150 71 13 20 0–10 – 0.477 0.367 0.199 0.101
170 56 5 20 0–7 – 1.135 0.959 1.582 0.235
260 58 2 5 0–30 0.461 0.403 0.304 0.159 0.088
110 56 13 15 0–30 0.448 0.346 0.260 0.129 0.076
240 68 9 15 0–30 – 0.342 0.257 0.129 0.071
135 59 9 10 0–30 0.359 0.352 0.135 0.070
380 66 3 10 0–6 – 0.635 0.495 0.241 0.093
345 58 3 15 0–30 0.366 0.296 0.111
360 57 4 10 0–30 0.306 0.283 0.229 0.117 0.063
540 58 3 10 0–30 0.361 0.316 0.241 0.112 0.064
460 66 5 5 0–30 0.360 0.337 0.266 0.127 0.070
Mean 0.380 0.447 0.351 0.276 0.091
SD 0.055 0.249 0.216 0.458 0.049
North West sector
760 62 2 10 0–8 – 0.790 0.620 0.298 0.100
620 66 3 5 0–5 – 1.135 0.927 0.423 0.122
660 79 4 5 0–8 – – 0.999 0.609 0.146
670 55 7 5 0–5 – 1.641 1.414 0.615 0.163
780 80 2 10 0–6 – 1.504 1.316 0.616 0.150
Mean 1.268 1.055 0.512 0.136
BGD
9, 15567–15602, 2012
UV/PAR radiations and DOM properties
in surface coastal waters
J. Para et al.
Title Page
Abstract Introduction
Conclusions References
Tables Figures
◭ ◮
◭ ◮
Back Close
Full Screen / Esc
Printer-friendly Version Interactive Discussion
Discussion
P
a
per
|
Dis
cussion
P
a
per
|
Discussion
P
a
per
|
Discussio
n
P
a
per
|
Table 3.Spectral characteristics of the three components identified by PARAFAC analysis
com-pared to previously identified components including Arctic and sub-Arctic studies (Stedmon et al., 2007; Walker et al., 2009; Fellman et al., 2010). Position of Ex/Em maxima of C1, C2 and C3 are deduced from their corresponding spectra reported in Fig. 8.
Components
C1 C2 C3
Ex. Maxima (nm) <240 (300) <240 (340) <240 (275)
Em. Maxima (nm) 404 472 314
Coble et al. (1998) M A and© B and T
Stedmon et al. (2007) C3 C1 C4 and C5
Walker et al. (2009) BERC6 BERC3 BERC5
Fellman et al. (2010) C5 CA and (C2) C8 and C7
Source Marine and Terrestrial Amino acids
BGD
9, 15567–15602, 2012
UV/PAR radiations and DOM properties
in surface coastal waters
J. Para et al.
Title Page
Abstract Introduction
Conclusions References
Tables Figures
◭ ◮
◭ ◮
Back Close
Full Screen / Esc
Printer-friendly Version Interactive Discussion
Discussion
P
a
per
|
Dis
cussion
P
a
per
|
Discussion
P
a
per
|
Discussio
n
P
a
per
|
Depth
Mackenzie Delta
Cape Bathurst Beaufort Sea
Mackenzie Canyon
Fig. 1.Location and station number investigated during the MALINA cruise in the Canadian
BGD
9, 15567–15602, 2012
UV/PAR radiations and DOM properties
in surface coastal waters
J. Para et al.
Title Page
Abstract Introduction
Conclusions References
Tables Figures
◭ ◮
◭ ◮
Back Close
Full Screen / Esc
Printer-friendly Version Interactive Discussion
Discussion
P
a
per
|
Dis
cussion
P
a
per
|
Discussion
P
a
per
|
Discussio
n
P
a
per
|
25
North East Sector
North West Sector
Mackenzie Delta Sector
SEA SURFACE SALINITY SECTORS
Fig. 2.Map of the sea surface salinity illustrating the different surface salinity sectors observed
BGD
9, 15567–15602, 2012
UV/PAR radiations and DOM properties
in surface coastal waters
J. Para et al.
Title Page Abstract Introduction Conclusions References Tables Figures ◭ ◮ ◭ ◮ Back Close
Full Screen / Esc
Printer-friendly Version Interactive Discussion Discussion P a per | Dis cussion P a per | Discussion P a per | Discussio n P a per | 0.0 0.2 0.4 0.6 0.8 1.0 1.2 1.4 1.6 1.8
20 22 24 26 28 30
K d (325 n m ) [ m -1] Salinity St 170 0.0 0.2 0.4 0.6 0.8 1.0 1.2 1.4 1.6
20 22 24 26 28 30
K d (340 n m ) [ m -1] Salinity St 170 0.0 0.1 0.2 0.3 0.4 0.5 0.6 0.7
20 22 24 26 28 30
K d (38 0 n m ) [ m -1] Salinity St 170 0.0 0.1 0.1 0.2 0.2 0.3
20 22 24 26 28 30
Kd (P A R ) [m -1] Salinity St 170
Fig. 3.Diffuse attenuation coefficient of light (Kd) at 325, 340, 380 nmand PAR as a function of
surface salinity in the North East (circles) and North West (squares) sectors. Station 170 was characterized by high DOC (117 µM), Chlorophylla(∼7 µg l−1) andaCDOM(350 nm) (0.56 m
−1