Behavioral Features of the Belgian Malinois
Xue Cao1,2,3, David M. Irwin1,4, Yan-Hu Liu5, Lu-Guang Cheng6, Lu Wang5, Guo-Dong Wang1*, Ya-Ping Zhang1*
1State Key Laboratory of Genetic Resources and Evolution and Yunnan Laboratory of Molecular Biology of Domestic Animals, Kunming Institute of Zoology, Chinese Academy of Sciences, Kunming, China,2University of Chinese Academy of Sciences, Beijing, China,3Kunming College of Life Science, University of Chinese Academy of Sciences, Kunming, China,4Department of Laboratory Medicine and Pathobiology, University of Toronto, Toronto, Ontario, Canada,5Laboratory for Conservation and Utilization of Bio-resource and Key Laboratory for Microbial Resources of the Ministry of Education, Yunnan University, Kunming, China,6Kunming Police Dog Base, Ministry of Public Security, Kunming, China
Abstract
The Belgian Malinois (BM) is an excellent working dog that typically shows a circling behavior when placed in a confined space. Moreover, individuals showing moderate running in circles (one kind of obsessive compulsive behavior) in confined spaces typically show better work performance compared to those without the circling behavior or to those with a serious circling behavior (which can be defined as an obsessive compulsive disorder (OCD)). To determine whether the candidate geneCDH2, Cadherin 2, which is associated with OCD in the Doberman pinscher breed of dogs and in humans, was linked with this behavioral character in the BM, population genetic analyses were performed on a BM population and a natural population of the Chinese indigenous dog (CID). Many genetic signals of balancing selection were detected for one specific region of theCDH2gene, which suggests that a genomic block, which is included in theCDH2gene, experienced balancing selection in the BM, and that theCDH2 gene might be associated with the behavioral characteristics of the BM dog (a balance between circling behavior and work performance). Moreover one specific variant, G63913941A, which creates a predicted transcription factor-binding site, may be the key mutation in theCDH2gene affecting the behavior of BMs by allowing the binding of a transcription factor and increasingCDH2expression.
Citation:Cao X, Irwin DM, Liu Y-H, Cheng L-G, Wang L, et al. (2014) Balancing Selection onCDH2May Be Related to the Behavioral Features of the Belgian
Malinois. PLoS ONE 9(10): e110075. doi:10.1371/journal.pone.0110075
Editor:Yong-Gang Yao, Kunming Institute of Zoology, Chinese Academy of Sciences, China
ReceivedMay 22, 2014;AcceptedSeptember 6, 2014;PublishedOctober 10, 2014
Copyright:ß2014 Cao et al. This is an open-access article distributed under the terms of the Creative Commons Attribution License, which permits unrestricted use, distribution, and reproduction in any medium, provided the original author and source are credited.
Data Availability:The authors confirm that all data underlying the findings are fully available without restriction. All sequences longer than 200bp are available from the GenBank database (BankIt1722361:KJ784656 - KJ785865).
Funding:This work was supported by grants from the Natural Science Foundation of China (31201712), the 973 program (2013CB835200 and 2013CB835202), and the ministry of public security science and technology special project 2013YYCXKMJQ121. The funders had no role in study design, data collection and analysis, decision to publish, or preparation of the manuscript.
Competing Interests:The authors have declared that no competing interests exist.
* Email: [email protected] (GDW); [email protected] (YPZ)
Introduction
The Belgian Malinois (BM), a military working dog with high excitement levels, commonly shows a circling behavior when in a confined space. In confined spaces that are not large enough to allow running, the BM will travel in circles (http://dogbreedsinfo. org/Belgian-Malinois.html). Moreover, in the BM population, individuals showing moderate running in circles (one kind of obsessive compulsive behavior) in confined spaces have better work performance, as they have a stronger desire and initiative for work than individuals that do not circle, and have better behavioral control (not showing extra circling behavior) than individuals that show extremely high levels of circling behavior.
This extreme circling behavior seen in the BM has been defined as an Obsessive-compulsive disorder (OCD) [1]. An OCD has been characterized in the Doberman pinscher breed of dogs, and was shown to have a highly significant genetic association with alleles of the Cadherin 2 (CDH2) gene region [2,3]. Rare missense variants inCDH2are associated with OCD and Tourette disorder in humans [4]. These observations suggest that theCDH2 gene may contribute to OCD; therefore, we speculated that variants in
theCDH2gene might be involved in the circling behavior seen in the BM.
To investigate this question, population genetic analyses were performed on a BM population, which shows a balance in the behavioral characters of the circling behavior and work perfor-mance, and in a natural population of Chinese indigenous dogs, a local dog population that does not show this behavioral character. By comparing the population genetic signals from these two populations with differing behavioral characters, we should be able to determine whether the CDH2 gene is associated with the balanced behavioral characteristics seen in the BM. Population genetic analysis identified signals of balancing selection in the
Materials and Methods
Ethics statement
Written informed consent for research purposes was obtained from the owners of the dog individuals used in this study. All samples used in this study were obtained and handled following the guidelines of the by-laws on experimentation on animals, and was approved by the Ethics and Experimental Animal Committee of Kunming Institute of Zoology, Chinese Academy of Science, China (KIZ_YP201002).
Population Samples and Sequencing ofCDH2
Two dog populations, a Chinese indigenous dog (CID) and a Belgium Malinois (BM) population, were used for this study. The CID population consisted of 23 individuals while the BM population was composed of 53 individuals. DNA was extracted from blood samples according to a standard phenol-chloroform extraction procedure. Primers to amplify and sequence 7 segments within the CDH2 gene, as well as one upstream and one downstream segment of the gene (Figure 1A) were designed based on the reference dog genome (canfam2). PCR products were sequenced on an ABI PRISM 3730xl analyzer (Applied Biosys-tems) with Big Dye Terminator sequencing Kits (v3.1 Applied Biosystems). Sequences were analyzed using DNASTAR software (DNASTAR). The sequences of segment S8 which is shorter than 200bp were provided in Sequence S1.
Population genetic analysis
PHASE 2.1 [5,6] was used to estimate the haplotype phase for every individual. We then used the Haploview program [7] to infer the Linkage disequilibrium (LD) parameters D9 and r2and the LD blocks for each population. DNAsp 5.10.01 [8] was used to calculate the nucleotide diversity,hw andhp, and to perform the Tajima’s D test for each PCR segment. We used the ‘‘False Discovery Rate’’ (FDR) method of Benjamini and Hochberg [9] for multiple testing to correct the P values of Tajima’s D. The PSMC approach was used to estimate the demographic history of dogs and wolves before 10,000 years ago with the parameters: -N25 -t15 -r5 -p ‘‘4+25*2+4+6’’ [10]. To improve the accuracy of inferred historical recombination events, sex chromosome se-quences and loci with less than two thirds of the average depth were removed. Using the estimated and documented demographic history of the BM population, we used the program ms [11] to generate 10,000 independent replicated sample. For each segment used in the ms simulation, the same number of segregating sites (seg_sites) and same length for the segments (l_seg) as seen in the original data were used. POPGENE 3.11 [12] was used to calculate the heterozygosity of each SNP and a haplotype genealogy for the candidate block was inferred by constructing Median-joining networks with Network 4.5.1.6 [13] (http://www. fluxus-engineering.com/). The online transcription factor binding site prediction tool TFSEARCH [14] was used to predict DNA transcription factor binding sites in the reference and derived sequences of the candidate segments. Scores for evaluating the transcription factor binding predictions were calculated as follows: 100.0 * (‘weighted sum’ - min)/(max - min). Score above a threshold score of 85.0 (scores in the region (0,100.0)) were
considered to be true binding [14].
Results
Using published Single Nucleotide Polymorphisms (SNPs) data [15], we identified 9 segments within or near theCDH2gene that had abundant variations for sequencing in this study. Of the 9
segments, 7 were within the CDH2 gene (two exonic and five intronic sequences), as well as one upstream and one downstream segment of the gene (Figure 1A).The sequenced segments have a total length of about 4,213bp and are distributed across a,110kb region around the CDH2gene. A total of 53 BM and 23 CID individuals were sequenced for all 9 segments, which resulted in the identification of a total of 41 SNPs that were shared by both populations and an additional 2 SNPs that were specific to the CID population and 4 to the BM population.
In addition to calculating the population genetic parameters (Table 1), with a summary of the frequency spectrum at the polymorphic sites shown in Figure S1, we also inferred LD [7] and performed the Tajima’s D test [8] for each segment of theCDH2
gene region in both populations. Compared to the CID population, three much longer LD blocks (BM Block 1 about 19kb, BM Block 2 about 2kb and BM Block 3 about 36kb, Figure 1B) were found in the CDH2 gene region in the BM population. In the CID population all LDs of theCDH2 gene region were shorter than 500bp (Figure S2). A peak, which was within LD BM Block 3, having significant positive Tajima’s D values (contained three segments S4: P = 5.0161024, S5:
P = 6.9561024 and S6 P = 1.0461022), even after correction
(S4: P = 4.5161023, S5: P = 3.1361023and S6 P = 3.1161022), was observed in the Tajima’s D distribution of the 9 segments in the BM population (Figure 2A). For the CID population, instead of a peak like that observed in the BM population, decreased values were observed in the Tajima’s D distribution (Figure 2A). These results imply that the BM Block 3 region (contained the three segments S4, S5 and S6) likely was affected by balancing selection only in the BM population, however, it is possible that significantly positive values for Tajima’s D may have been generated by demographic changes in the evolutionary history of the BM.
To rule out an influence of demographic history, we conducted simulations of the evolution of BM Block 3 (segments S4, S5 and S6), which shows significantly positive Tajima’s D values, that following the demographic history of the BM dog [11] under a neutral evolutionary model. Like most other breeds of dogs, the demographic history of the BM dog can be divided into two stages: an ancient domestication period and a more modern breeding period, where the population experienced two bottlenecks, one during early domestication and a second during recent breed creation (Figure 2B (part I)) [16,17]. We used three published individual genomes (BM: DogBM, CID: DogCI1, Wolf: GW3) to reconstruct the population history of dog [15] using the PSMC approach. The PSMC analysis showed that the ancient domesti-cation period of the BM fit the published demographic history [15] very well (Figure S3). The dog was domesticated about 32,000 years ago, thus T1<10,667 generations was used in our simulations,
which assumes a generation time of 3 years. This research also indicated that the dog was domesticated from about 8,500 wolves whose effective population size was about 53,000, thus these numbers were also used in our simulations (N2 = 8,500 and N1 = 53,000). Wang and colleagues estimated that after domesti-cation the effective population size for the domesticated dog increased to around 17,000 [15], and this number (N3 = 17,000) was used as the effective population size for the domesticated dog before the creation of the BM breed. The BM breed was created in 1891 from 117 domesticated dogs (http://www.fci.be/ nomenclature/BELGIAN-SHEPHERD-DOG-15.html; http:// www.akc.org/breeds/belgian_malinois/history.cfm) (thus T2<41
generations and N4 = 117). BM dogs have now become important working dog and are used throughout the World with an estimated population effective size between 50,000 and 100,000. We therefore
conducted simulations with differing values for N5 (50,000 and 100,000). A summary of the demographic history of the BM is shown in Figure 2B (part I). The ms simulation was performed with the following parameters: ms 106 1 -sseg_sites-G 31073.04049 -eG 0.0002 0.0 -eN 0.000205 0.34 -eN 0.05333 0.17 -eN 0.053335 1.06| perl ms_PopGen.pl 106 l_seg; ms 106 1 -s seg_sites -G 69077.55279 -eG 0.0001 0.0 -eN 0.0001025 0.17 -eN 0.026665 0.085 -eN 0.0266675 0.53| perl ms_PopGen.pl 106l_seg.
Using the simulated demographic history and the parameters described above, the distributions of the Tajima’s D obtained for the three sequence segments from the simulations are shown in Figure 2B (parts II-IV). From these simulations, more than 96% of the Tajima’s D values are contained in the range (-‘to 3), while less than 4% in the extreme positive range (3 to +‘). The probabilities, from these simulations, of obtaining the observed Tajima’s D values for the experimental segments S4, S5 and S6, if they were neutrally evolving sequences, are 4.6061023, 1.0061024, 3.3261022 when N5 = 50,000, respectively, and 6.3061023, 1.0061024, 3.3861022when N5 = 100,000, respec-tively (Figure 2B). The results from the simulations indicate that the significantly positive values for Tajima’s D obtained from the BM sequences have an extremely low chance of being generated simply due to demographic history. These analyses suggest that balancing selection on BM Block 3 (covering a region of about
5501bp) of theCDH2gene likely explains the observed sequence pattern.
Balancing selection maintains high frequencies of heterozygosity in sequences and results in haplotypes that show special genealogical patterns, therefore we calculated the heterozygosity [12] and the frequency of the heterozygotes for each SNP in the
CDH2gene region in both populations, estimated the haplotype phase [5,6] of the BM Block 3 loci in the BM population and generated a median-joining networks of the haplotypes [13]. A continuous distribution of SNPs with high heterozygosity values and frequency of heterozygotes were found for BM Block 3 (Figure 2C, Figure 2D) in the BM population. In contrast, in the CID population a wave distribution of SNP heterozygosity values and frequency of heterozygotes were observed (Figure 2C, Figure 2D). Moreover, in the median-joining network, the eight BM Block 3 haplotypes were distributed into two major clades (clade A: 50%, clade B: 49%) that were separated by a relatively long-branch length (Figure 3). These results support the conclu-sion that BM Block 3 of theCDH2gene experienced balancing selection.
To identify key SNPs within BM Block 3 that affectedCDH2
gene function we focused on 20 SNPs from published dog SNP data [15]. Of these 20 SNPs, 14 were only observed in the heterozygous state in the BM in the published data, and the
Figure 1. Locations of the sequenced segments and LD distribution in theCDH2gene.(A) Schematic map of the locations of the 9 sequenced segments in theCDH2gene region. (B) LD distribution in theCDH2gene in the BM population. Location to the LD Blocks in the BM (BM Blocks) is indicated in Fig. 1B.
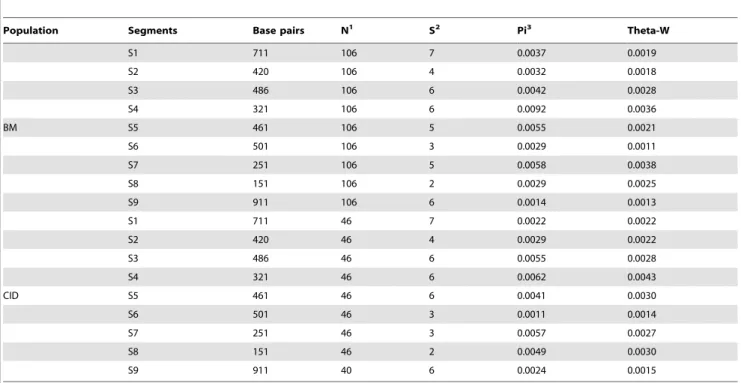
Table 1.Polymorphism statistics and neutral tests in both the BM and CID populations.
Population Segments Base pairs N1 S2 Pi3 Theta-W
S1 711 106 7 0.0037 0.0019
S2 420 106 4 0.0032 0.0018
S3 486 106 6 0.0042 0.0028
S4 321 106 6 0.0092 0.0036
BM S5 461 106 5 0.0055 0.0021
S6 501 106 3 0.0029 0.0011
S7 251 106 5 0.0058 0.0038
S8 151 106 2 0.0029 0.0025
S9 911 106 6 0.0014 0.0013
S1 711 46 7 0.0022 0.0022
S2 420 46 4 0.0029 0.0022
S3 486 46 6 0.0055 0.0028
S4 321 46 6 0.0062 0.0043
CID S5 461 46 6 0.0041 0.0030
S6 501 46 3 0.0011 0.0014
S7 251 46 3 0.0057 0.0027
S8 151 46 2 0.0049 0.0030
S9 911 40 6 0.0024 0.0015
Note:
1The number of chromosome;2Number of segregating sites;3Nucleotide diversity. doi:10.1371/journal.pone.0110075.t001
Figure 2. The distribution of three population genetic statistics and the information of coalescent simulations.(A) Distribution of Tajima’s D values for the 9 segments of theCDH2gene region in the BM and CID populations. (B) Standard coalescent simulations under a neutral model for the genealogy of the BM. Part I is the genealogy of BM and parts II-IV are standard coalescent simulations for segments S4, S5, S6, respectively, under different values for N5 (50,000 and 100,000) in the BM population. Pmeanis the mean of the P values for the Tajima D test. (C) SNP
heterozygosity distribution in theCDH2gene region in the BM and CID populations. (D) Frequency distribution of heterozygotes for each SNP in the BM and CID populations.
doi:10.1371/journal.pone.0110075.g002
derived state for these alleles were not observed in the three CID individuals where SNP information is contained in the published data [15]. The genomic locations of these 14 SNPs were obtained from the Ensembl genome database, which showed that all 14 are located within introns of the CDH2 gene [18,19]. As intronic regions typically do not directly affect protein products, we hypothesized that an intronic SNP may affect expression of the gene by changing the binding of a transcription factor. To examine this possibility, we used TFSEARCH [14] to predict the transcription factor DNA-binding sites in the reference and derived sequences of these three segments. Differences in four relevant mammalian transcription factor binding sites were found between the derived and reference sequences. The loss of binding sites for the sex-determining region Y gene product (SRY) were found in the derived sequences for SNPs (T63912191A, score: 90.0; T63916864C, score: 90.0 and T63916868C, score: 90.0), while gains of binding sites for SRY (score: 92.7), GATA-binding factor 2 (GATA-2) (score: 88.5), CCAAT/enhancer binding protein beta (C/EBPb) (score: 88.0) and alpha (C/EBPa) (score: 85.7) were found in the derived sequences for the SNPs (A63912337G, G63912459Aand G63913941A). Since CDH2 is mainly expressed in cardiac myocytes, smooth muscle and nervous system [20] and C/EBPb and C/EBPa, which binds to the derived sequence containing SNP G63913941A, are also ex-pressed in these same cells [21–23], we speculated that the variant G63913941A SNP may affect CDH2 gene function. We then examined the allele frequency and the genotype distribution of this SNP in the BM and CID populations. A significantly (P,0.01, by
x2test) higher derived allele (A) frequency exists in BM population
(50%) compared to the CID population (27.78%). Moreover, the genotype distribution in the BM population were also significantly different from that in the CID population (P,0.01, byx2test). In
the BM population, the AG genotype was the most frequent genotype (GG 26.42%, AA 26.42%, AG 47.16%), while GG was most frequent in the CID population (GG 65.72%, AA 8.70%, AG 26.09%).
Discussion
Here we used population genetics methods to analyze variants in the CDH2 gene in populations of the BM (where most individuals show the circling phenotype) and in the CID (a natural population of dogs). Differences in the LD distribution pattern of theCDH2gene between the BM and CID populations, and results from the Tajima’s D test indicate that BM Block 3 of theCDH2
gene may have experienced balancing selection in the BM population or have been affected by the demographic history of the BM. Simulations of the demographic history of the BM eliminate the possibility that the LD distribution pattern or Tajima’s D test results are due to the demographic history of the BM. Moreover, the levels of heterozygosity and frequency of heterozygotes across BM Block 3 and the structure of the median-joining networks of the haplotypes offer additional support for a hypothesis of balancing selection.
Balancing selection has been shown by previous research [24– 26], to maintain polymorphisms and produce individuals that have a balance of advantageous and disadvantageous characteristics. For instance, balancing selection has been shown to occur on the myostatin (MSTN) gene in the whippet breed of dogs, where individuals carrying only one copy of the mutated allele ofMSTN
(with a medium muscular phenotype) are significantly faster in competitive racing than individuals carrying the wild-type genotype (showing less muscularity) and are of better physical appearance than individuals carrying two copies of the mutation (which a greater level of muscularity) [25]. Similarly, in the BM
Figure 3. Median-joining network showing the genealogy of the BM Block 3 haplotypes in the BM population.Each haplotypes is shown as a circle with the size of the circle representing the haplotype frequency. Nucleotide differences between haplotypes are shown on the branches of the network.
population, BM dogs that run in circles in confined spaces at an intermediate level have the better work performance than those that do not circle or those that circle at a high level (which is considered to be OCD) [1]. Our results showing that BM Block 3 ofCDH2(an OCD relevant gene) experienced balancing selection in the BM population suggests that the BM Block 3 of theCDH2
gene is associated with the behavioral characteristics of the BM dog (a balance between circling behavior and work performance). The derived sequence suggests a possible mechanism for the circling phenotype. A change in the potential to bind the transcription factor (C/EBPb) was found for the derived CDH2
sequence, similar to an inferred change in predicted transcription factor DNA-binding in Alzheimer’s disease [27], which is also associated with OCD [28,29]. The frequency of the derived allele (containing an additionalC/EBPbbinding site) was significantly higher in the BM population, which shows circling behavior, than in CID population, which does not show the circling behavior. These results suggest that the heterozygous genotype was advantageous in the BM population, allowing some circling in confined spaces, but not to a level that seriously affects work performance. The variant G63913941A may be the key mutation in the CDH2 gene for BM behavior, which generates a C/ EBPbbinding site that may have allowed increased expression of this gene and ultimately affects both circling and work behavior.
Our work revealed a strong signal for balancing selection in a genomic block of theCDH2gene in the BM population that shows a balance between a circling behavior and work performance. Since extreme circling is defined as an OCD [1] our results not only suggest that CDH2 is associated with the behavioral characteristics seen in the BM, but also imply that CDH2may related to other kinds of obsessive compulsive behaviors found in dog populations. A noncoding variant inCDH2may be the key mutation correlated with the behavioral character (balancing of circling behavior and work performance) of the BM. These results
are similar to those of Tang et al. [3] who found functional noncoding variants that affect transcription factor binding in a different canine model of OCD. These results hint that noncoding sequences play important roles in OCD, thus greater attention to regulatory sequence may be necessary in OCD research.
Supporting Information
Figure S1 Frequency spectrums of polymorphic sites in two populations.(A) Frequency spectrums of polymorphic sites in BM population. (B) Frequency spectrums of polymorphic sites in CID population.
(PDF)
Figure S2 LD distribution in theCDH2gene of the CID population.
(PDF)
Figure S3 Demographic history of dogs and wolves before 10,000 years ago estimated by PSMC.
(PDF)
Sequence S1 The sequences of segment S8 which is shorter than 200bp.
(RAR)
Acknowledgments
We thank Yong-Gang Yao and reviewers for helpful comments and suggestions.
Author Contributions
Conceived and designed the experiments: YPZ GDW XC. Performed the experiments: XC. Analyzed the data: XC YHL. Contributed reagents/ materials/analysis tools: LGC. Wrote the paper: XC. Gave advice and helped to modify the paper: LW DMI.
References
1. Overall KL, Dunham AE (2002) Clinical features and outcome in dogs and cats with obsessive-compulsive disorder: 126 cases (1989–2000). J Am Vet Med Assoc 221: 1445–1452.
2. Dodman NH, Karlsson EK, Moon-Fanelli A, Galdzicka M, Perloski M, et al. (2010) A canine chromosome 7 locus confers compulsive disorder susceptibility. Mol Psychiatr 15: 8–10.
3. Tang R, Noh HJ, Wang D, Sigurdsson S, Swofford R, et al. (2014) Candidate genes and functional noncoding variants identified in a canine model of obsessive-compulsive disorder. Genome Biology 15: R25.
4. Moya PR, Dodman NH, Timpano KR, Rubenstein LM, Rana Z, et al. (2013) Rare missense neuronal cadherin gene (CDH2) variants in specific obsessive-compulsive disorder and Tourette disorder phenotypes. Eur J Hum Genet 21: 850–854.
5. Stephens M, Smith NJ, Donnelly P (2001) A new statistical method for haplotype reconstruction from population data. Am J Hum Genet 68: 978–989. 6. Stephens M, Donnelly P (2003) A comparison of bayesian methods for haplotype
reconstruction from population genotype data. Am J Hum Genet 73: 1162– 1169.
7. Barrett JC, Fry B, Maller J, Daly MJ (2005) Haploview: analysis and visualization of LD and haplotype maps. Bioinformatics 21: 263–265. 8. Librado P, Rozas J (2009) DnaSP v5: a software for comprehensive analysis of
DNA polymorphism data. Bioinformatics 25: 1451–1452.
9. Benjamini Y, Hochberg Y (1995) Controlling the False Discovery Rate - a Practical and Powerful Approach to Multiple Testing. J Roy Stat Soc B Met 57: 289–300.
10. Kumar S, Subramanian S (2002) Mutation rates in mammalian genomes. Proc Natl Acad Sci U S A 99: 803–808.
11. Hudson RR (2002) Generating samples under a Wright-Fisher neutral model of genetic variation. Bioinformatics 18: 337–338.
12. Quardokus E (2000) PopGene. Science 288: 458–458.
13. Bandelt HJ, Forster P, Rohl A (1999) Median-joining networks for inferring intraspecific phylogenies. Molecular Biology and Evolution 16: 37–48. 14. Heinemeyer T, Wingender E, Reuter I, Hermjakob H, Kel AE, et al. (1998)
Databases on transcriptional regulation: TRANSFAC, TRRD and COMPEL. Nucleic Acids Res 26: 362–367.
15. Wang GD, Zhai WW, Yang HC, Fan RX, Cao X, et al. (2013) The genomics of selection in dogs and the parallel evolution between dogs and humans. Nature Communications 4.
16. Lindblad-Toh K, Wade CM, Mikkelsen TS, Karlsson EK, Jaffe DB, et al. (2005) Genome sequence, comparative analysis and haplotype structure of the domestic dog. Nature 438: 803–819.
17. Wang GD, Xie HB, Peng MS, Irwin D, Zhang YP (2014) Domestication Genomics: Evidence from Animals. Annual Review of Animal Biosciences 2: null.
18. Hubbard T, Barker D, Birney E, Cameron G, Chen Y, et al. (2002) The Ensembl genome database project. Nucleic Acids Res 30: 38–41.
19. Flicek P, Ahmed I, Amode MR, Barrell D, Beal K, et al. (2013) Ensembl 2013. Nucleic Acids Res 41: D48–D55.
20. Wu C, Orozco C, Boyer J, Leglise M, Goodale J, et al. (2009) BioGPS: an extensible and customizable portal for querying and organizing gene annotation resources. Genome Biol 10: R130.
21. Lekstrom-Himes J, Xanthopoulos KG (1998) Biological role of the CCAAT/ enhancer-binding protein family of transcription factors. Journal of Biological Chemistry 273: 28545–28548.
22. Sterneck E, Johnson PF (1998) CCAAT/enhancer binding protein beta is a neuronal transcriptional regulator activated by nerve growth factor receptor signaling. J Neurochem 70: 2424–2433.
23. Cortes-Canteli M, Pignatelli M, Santos A, Perez-Castillo A (2002) CCAAT/ enhancer-binding protein beta plays a regulatory role in differentiation and apoptosis of neuroblastoma cells. Journal of Biological Chemistry 277: 5460– 5467.
24. Allison AC (1956) The Sickle-Cell and Haemoglobin-C Genes in Some African Populations. Ann Hum Genet 21: 67–89.
25. Mosher DS, Quignon P, Bustamante CD, Sutter NB, Mellersh CS, et al. (2007) A mutation in the myostatin gene increases muscle mass and enhances racing performance in heterozygote dogs. Plos Genetics 3: 779–786.
26. Wang GD, Cheng LG, Fan RX, Irwin DM, Tang SS, et al. (2013) Signature of Balancing Selection at the MC1R Gene in Kunming Dog Populations. PloS one 8. 27. Strohmeyer R, Shelton J, Lougheed C, Breitkopf T (2014) CCAAT-Enhancer Binding Protein-beta Expression and Elevation in Alzheimer’s Disease and Microglial Cell Cultures. Plos One 9: e86617.
28. Khiari HM, Achouri A, Ben Ali N, Cherif A, Batti H, et al. (2011) Obsessive-compulsive disorder: a new risk factor for Alzheimer disease? Neurol Sci 32: 959–962.