AbstrAct: The use of topcross has proven to be an interesting option for the maize crop; however, for the popcorn, there is little information about the choice of the appropriate tester. In this context, this study aimed to analyze four testers including two open pollinated varieties(BRS Angela and UENF-14), one topcross hybrid (IAC125) and a line (P2), to evaluate the combining ability of 50 S3 families of popcorn, obtained from the UENF-14 variety. Popcorn families were evaluated for grain yield (GY) and
PlAnt breeding -
Article
Comparison of testers in the selection of S
3
families
obtained from the UENF-14 variety of popcorn
Guilherme Ferreira Pena1, Antonio Teixeira do Amaral Júnior1*, Leandro Simões Azeredo Gonçalves2, Marcelo Vivas1, Rodrigo Moreira Ribeiro1, Gabrielle Sousa Mafra1, Adriano dos Santos1,
Carlos Alberto Scapim3
1. Universidade Estadual do Norte Fluminense Darcy Ribeiro - Centro de Ciências e Tecnologias Agropecuárias - Laboratório de Melhoramento Genético Vegetal - Campos dos Goytacazes (RJ), Brazil.
2. Universidade Estadual de Londrina - Departamento de Agronomia - Londrina (PR), Brazil. 3. Universidade Estadual de Maringá - PGA Agronomia - Maringá (PR), Brazil.
*Corresponding author: amaraljr@pq.cnpq.br
Received: May 21, 2015 – Accepted: Sept. 19, 2015
popping expansion (PE). The estimates of general and specific combining abilities were obtained and the discrimination of each tester through differentiation index was carried out. The testers BRS Angela (for GY) and IAC 125 (for PE) were the most adequate, when combined with the best S3 families derived from UENF-14, for the production of popcorn hybrids for the Northern and Northwestern Fluminense Regions.
Key words:Zea mays var. everta, topcross, yield, popping expansion.
intrOdUctiOn
Any breeding program focusing on successful hybrid combinations must concentrate its efforts to identify superior lines and their ability to transmit these desirable traits to the hybrids (Hallauer et al. 2010). In this context, diallel analysis is considered an important statistical tool for estimating parameters useful in selecting parents (Seifert et al. 2006; Barreto et al. 2012; Souza Neto et al. 2015).
However, a limiting factor of diallel analysis is the number of assessed parents, usually not exceeding ten, because of the effort to obtain the hybrids. In this case, the topcross technique, proposed by Davis (1927) and Jenkins and Brunson (1932), has proven to be a more appropriate option, aiming at overcoming the impossible assessment of progenitor lines in works with hybrids, involving a large number of lines.
The term “topcross” is used to denote crosses of
lines with a tester. The tester can be a variety, a hybrid or even a line and receives this name for playing a role in evaluating the combining ability of the lines. Testers can be classified according to their genetic base (broad versus narrow), the degree of relatedness with the
material evaluated (related versus unrelated) and their
intrinsic genetic value (high pattern versus regular or
inferior pattern) (Miranda Filho and Gorgulho 2001; Hallauer et al. 2010).
the relative potential of lines in cross, thus maximizing the genetic gain. According to Rodovalho et al. (2012), it is more important to use testers with broad genetic base (synthetic and open pollinated varieties) during the initial phase of breeding, since they test for general combining ability or additivity.
Compared to the common maize, there are few studies regarding the definition of testers for popcorn (Pinto et al. 2004; Viana et al. 2007; Scapim et al. 2008; Arnhold et al. 2009). An important detail that possibly hampers to choose the most suitable tester is the fact that the two main traits of the crop, popping expansion and grain yield, which should be evaluated together, have different mechanisms of inheritance (Pereira and Amaral Júnior 2001). Popping expansion is controlled by a small number of genes and there is predominance of additive gene action (Yongbin et al. 2012; Rodovalho et al. 2014). On the other hand, grain yield is genetically controlled by a large number of genes with predominance of non-additive gene effects.
Given these considerations, this study analyzed and compared four testers (BRS Angela, UENF-14, IAC 125
and P2) in the assessment of 50 partially inbred families
(S3), obtained from the UENF-14 variety of popcorn.
MAteriAl And MetHOds
For this study, 50 S3 families of popcorn were obtained
from the variety UENF-14 of Universidade Estadual do Norte Fluminense Darcy Ribeiro (UENF) (Amaral Júnior et al. 2013). Four materials were evaluated as testers: BRS Angela (open pollinated variety), IAC 125 (topcross
hybrid), P2 Line (S7 generation coming from the CMS-42
composite of the Embrapa Maize and Sorghum) and UENF-14 (open pollinated variety). Hybrids were evaluated in the Experimental Station of PESAGRO-RIO, Itaocara, State of Rio de Janeiro, Northwestern Fluminense region (21°39’S latitude and 42°04’W longitude), in the growing season of 2013/2014.
Five trials were implemented in blocks with two replications, four for assessing the hybrids derived from crosses of families with each tester and the fifth for
testing the performance of S3 families. Each experimental
unit consisted of a row of 3 m, with spacing of 0.90 m between rows and five plants per meter. In the trials, the
cultural practices, such as fertilization at planting and topdressing, irrigation, pest and weed control, among others, were made as required by the popcorn crop.
The traits evaluated were grain yield (GY) and popping expansion (PE). GY was assessed by measurement of the grain mass produced in each plot after discarding the cob and
is expressed in kg∙ha−1. In order to adapt the measurement
of the yield, it was carried out the stand correction method, by analysis of covariance between the number of plants per plot and GY, according to the covariance of ideal stand methodology, proposed by Vencovsky and Barriga (1992). PE was determined by means of a seed sample, taken from the basal center of the ears (Granate et al. 2002) in each plot. All samples were sent to cold dry chamber to reach the equilibrium moisture content of 12 to 13%. PE was determined in laboratory with the use of a microwave Panasonic NN-S65B, placing a sample of 30 g seed in a plastic container obtained in the USA, at the power of 1,000 W for 2 minutes and 30 seconds, in two replications per treatment. PE was expressed by the ratio between the volume of the popped popcorn, measured in a 2,000-mL measuring cylinder, and the initial weight of grains (30 g),
being the final unit expressed in mL∙g−1.
Statistical analysis of data followed the model of randomized blocks. The mean squares of treatment and the residue were used for the F test. The analysis of general and specific combining ability, based only on topcross crosses, was performed according to the scheme of analysis of variance in partial diallel at the level of average of treatments using the model proposed by Griffing (1956), adapted by Geraldi and Miranda Filho (1988). The efficiency of testers was evaluated by statistical indices of performance (P) and differentiation (D) proposed by Fasoulas (1983). The P index gives the percentage, in relation to the number of means, that a particular cultivar statistically outperforms the others based on the minimum significant difference (MSD), determined by test of means. The T index gives the percentage of pairwise comparisons between cultivars that showed significant differences. Analyses were run using the software GENES (Cruz 2013).
resUlts And discUssiOn
The mean squares of treatments (topcrosses) were
families per se, indicating genetic variability for GY and PE (Table 1). The coefficients of variation (CVe) for GY and PE were within acceptable limits for agricultural experimentation, except for the experiment assessing
the lines per se that showed CVe values of 24.62 and
26.00, respectively, considered high (Scapim et al. 1995; Arnhold and Milani 2011; Fritsche Neto et al. 2012).
In the case of estimates of genetic parameters, the largest genetic variances were observed for the crossing
BRS Angela × S3 (22,830.61) and with the S3 families
per se (0.93) for GY and PE, respectively (Table 1). The greatest increase in variability in topcross hybrids from the tester BRS Angela, for GY, can be explained because it is a broad base and unrelated tester, or because it presents many heterozygous loci. It is noteworthy that the high
variability observed in S3 families per se, for PE, is possibly
related to the intrapopulation genetic variance, as they
are individuals from the same population (UENF-14) (Amaral Júnior et al. 2013).
Considering the estimates of heritability, in general, their magnitudes remained very close independently of the tester. The exception applies to hybrids from the tester BRS Angela, specifically for PE, noting that this tester
was not able to express the genetic variability among S3
families (Table 1).
There was a significant effect of general and specific combining abilities, estimated by diallel analysis of Griffing (1956), adapted by Geraldi and Miranda Filho (1988). The general and specific combining abilities
of S3 families and testers have statistical significance,
revealing differences for both traits between the values of
the estimates of general (Gi) and specific (Sij) combining
abilities (Table 2). Regarding the general combining ability,
the tester with the best estimate of Gifor GY was the P2
Mean squares
sV dF brs Angela iAc 125 P2 UenF14 s3 per se
grain yield
Repetitions 1 2183900.99 593525.18 343761.99 370365.60 76517.79 Treatments 49 1219809.45** 1178969.05** 1056164.30* 1127949.90** 398531.47**
Residual 49 489229.97 573285.61 540400.29 544026.16 122655.83 Mean 4638.79 4531.62 5264.58 4353.59 1346.69
σG 22830.61 18927.61 16117.62 18247.62 8621.11
σF 38119.04 36842.78 33005.13 35248.43 12454.11
h2 0.59 0.51 0.49 0.51 0.69
CVe 15.07 16.71 13.96 16.94 26.00
CVg 3.25 3.03 2.41 3.10 6.89
Iv(%) 21.61 18.17 17.27 18.31 26.52
Popping expansion
Repetitions 1 0.24 1.62 14.31 3.05 32.12 Treatments 49 23.21** 25.04** 27.60** 18.35** 67.87* Residual 49 19.46 10.89 13.58 7.85 38.11
Mean 30.99 32.13 25.44 30.13 25.06
σG 0.11 0.44 0.44 0.33 0.93
σF 0.72 0.78 0.86 0.57 2.12
h2 0.16 0.56 0.51 0.57 0.44
CVe 14.23 14.22 14.48 9.3 24.62
CVg 1.10 2.07 2.60 1.90 3.85
Iv (%) 7.76 14.55 17.97 20.44 15.63
table 1. Analysis of variance and estimates of genetic and phenotypic parameters for grain yield (in kg∙ha–1) and popping expansion
(PE, in mL∙g–1) of topcross hybrids and S
3 families per se.
*,**Significant at 5 and 1% probability, respectively; SV = Sources of variation; DF = Degrees of freedom; σG= Genotypic variance; σF= Fenotypic variance;
h2= Heritability; CV
e = Experimental variance coefficient; CVg = Genetic variance coefficient; Iv (%) = Variation index
ˆ
ˆ
ˆ
2
2
2
2 2
2
ˆ
ˆ
ˆ
ˆ
ˆ
ˆ ˆ
Line, while, for the PE, testers IAC 125 and BRS Angela achieved the best estimates, reflecting the greater allelic
complementarity of these testers with S3 families (Figure 1).
Barreto et al. (2012) evaluated the combining ability
of S2 families of popcorn and also obtained a similar
result for the tester IAC 125, indicating it as the tester with the best general combining ability (GCA) indices for PE.
S3 families with higher estimates of GCA were 9, 33,
4, 20 and 16 for GY, and 18, 23, 42, 11, and 25 for PE
(Figure 2). Among the 50 S3 families, only 9, 16 and 23
stood out for concomitantly presenting significantly positive estimates of GCA for GY and PE and should be evaluated more carefully in the breeding program conducted in the Northern and Northwestern Fluminense Regions by UENF.
As for the specific combining ability of S3 families,
for crosses with the tester BRS Angela, families 21, 4, 13, 50, 22 and 45 demonstrated the highest values of specific combining ability (SCA); for the tester IAC 125, the families 9, 20, 11, 35, 3 and 45 stood out. For tester
P2, families 49, 43, 24, 41, 18 and 50 showed the highest
SCA indices and, in relation to the tester UENF-14, families 19, 2, 4, 45, 48 and 47 were those with higher
estimates of Sij (Table 3). The two hybrids showing better
estimates of the effects of SCA were derived from crosses
between tester P2 and family 49 and between the tester
IAC 125 and family 9. These hybrids, respectively, had Sij
effects of 2,359 and 1,960, besides having values around
7,400 kg∙ha−1. These two materials are very interesting
because they express high genetic non-additive effects in their genotypes, derived from allelic complementation of their parents, and will certainly comprise hybrids with
sV dF Ms
gY Pe
Crossings 199 1635761.22** 35.25** GCA S3 Families (I) 49 1938796.04** 25.25** GCA Testers (II) 3 19506622.89** 883.32**
SCA 147 1170038.15** 21.28**
Residual 196 536735.51 12.94
table 2. Partial diallel analysis of means of treatments for grain yield and popping expansion in the study of general and specific combining abilities.
**Significant 1% probability; MS = Mean squares; SV = Sources of variation; DF = Degrees of freedom; GY = Grain yield; PE = Popping expansion; GCA = General combining ability; SCA = Specific combining ability.
Figure 1. Estimates of the effects of general combining ability (Gi) associated with testers for grain yield (kg∙ha–1) and popping
expansion (mL∙g–1) according to Griffing (1956).
-400 -200 0 200 400 600 800
General combining ability
(g
i
)
General combining ability
(gi
)
Grain yield Standard error (gi) = 56.14
-5 -4 -3 -2 -1 0 1 2 3
BRS
An
g
e
la
IA
C
125
P2
Line
UENF-14
Popping expansion Standard error (gi) = 0.372
gi = Effect of general combining ability associated with the progenitor i. high average GY, which may be useful in interpopulation breeding programs in popcorn.
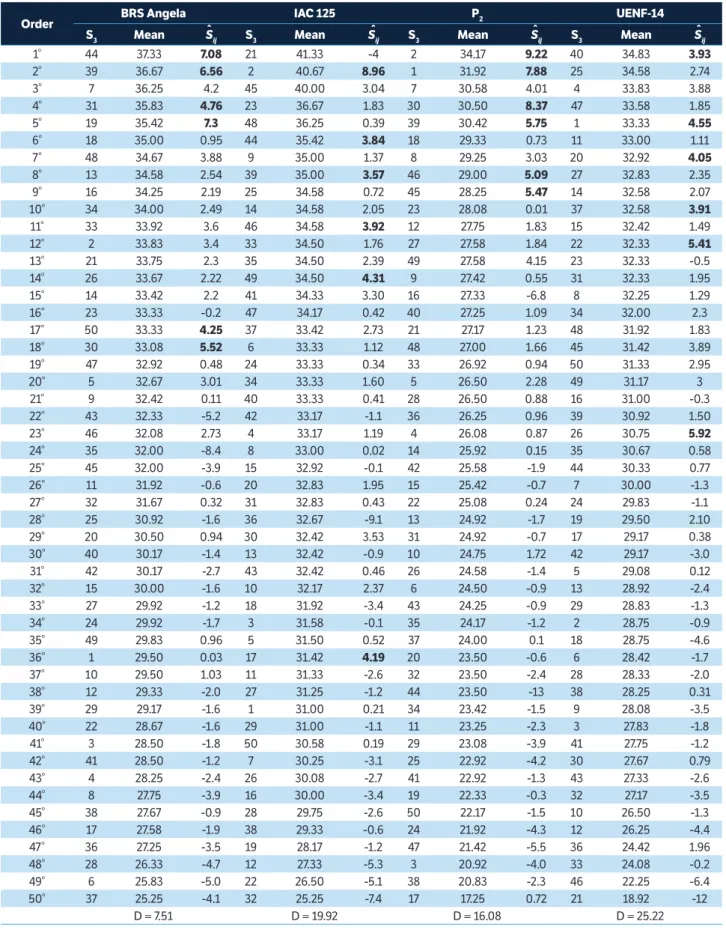
According to the SCA estimates for PE, families with better performance in relation to the tester BRS Angela were the genotypes 19, 44, 39, 30, 31 and 50. As for the
ˆ
ˆ
tester IAC 125, families with higher indices were 2, 49,
17, 46, 44 and 39. For P2 tester, families with greater
SCA effects were 2, 30, 1, 39, 45 and 46 and, for the tester UENF-14, families 26, 22, 1, 20, 40 and 37 stood
out with the highest indices of Sij (Table 4). Among the
better crosses in relation to SCA, with high GCA values and relevant estimates of PE, for the tester BRS Angela,
it can be highlighted family 18 with PE of 35 mL∙g−1; for
the tester IAC 125, family 23, with PE of 36.67 mL∙g−1;
and, for the tester UENF-14, family 11, with 33 mL∙g−1
(Table 4). By different mechanisms of genetic action of PE (additive and non-additive) which determine respectively the GCA and SCA, it can be inferred that these crossings are interesting and also deserve attention from the popcorn breeding program of UENF.
Higher values for differentiation index (D) of Fasoulas (1983), for GY, were obtained by tester UENF-14
(D = 28.98) and BRS Angela (D = 28.24), indicating these
testers as having greater efficiency in discriminating S3
families (Table 3). Rodovalho et al. (2012) examined
different testers in the discrimination of 64 S2 families
of popcorn, for GY, and also indicated the tester BRS Angela using this differentiation index. Considering the trait PE, the highest differentiation indices, 25.22 and 19.92%, were obtained, respectively, for the testers UENF-14 and IAC 125, indicating that these parents
discriminated better the trait PE of S3 families.
Among the testers used, the P2 Line exhibited only one
hybrid of high GY by combining with one of the seven
S3 families of greater values of GCA, the family 2. The
BRS Angela was the tester that concomitantly classified
most high-yield hybrids with S3 families of high GCA.
Of the seven S3 families with the highest GCA indices,
five that comprised the topcross hybrids of higher yields,
Figure 2. Estimates of the effects of general combining ability (Gi) associated with S3 families for grain yield (kg∙ha
–1) and popping expansion
(mL∙g–1) according to Griffing (1956).
gi = Effect of general combining ability associated with the progenitor i. S3 Lines
0 4 9 16 20 33 50
50
General combining ability
(g
i
)
General combining ability
(g
i
)
-800 -600 -400 -200 0 200 400 600 800 1,000 1,200
0
11 18 23 25 42
Grain yield
Standard error (gi) = 166.74
-4 -3 -2 -1 0 1 2 3 4
Popping expansion Standard error (gi) = 1.1062
ˆ
Order brs Angela iAc 125 P2 UenF-14
s3 Mean Sij s3 Mean Sij s3 Mean Sij s3 Mean Sij
1° 4 5113.81 1463.8 9 7444.44 1960.3 49 7349.70 2359 2 6803.70 1223.7
2° 9 5112.79 771.9 20 6481.48 1712.5 41 6768.82 1445 19 6039.06 1719.6
3° 13 4790.06 1387.6 11 5577.78 996.7 24 6589.84 1460 4 5837.04 1169.4
4° 50 4751.87 1235.2 33 5574.07 689.1 43 6580.71 1785 20 5352.94 709.6 5° 16 4583.67 981.8 3 5451.85 976 50 6454.00 1074 47 5296.88 957
6° 22 4359.79 1149.8 14 5374.07 875.5 18 6370.02 1375 46 5251.93 -1032 7° 15 4195.29 871.0 31 5346.30 681 2 6235.66 846.5 16 5238.64 619.1 8° 23 4160.94 634.1 35 5274.07 993.5 30 6120.85 903 44 5238.64 -563.6 9° 33 4150.85 409.2 37 5222.22 736.8 36 6102.33 965.5 23 5174.58 630.1 10° 30 4128.63 774.0 45 5088.89 943.0 13 6012.06 746.3 21 5076.77 842.2 11° 31 4111.77 589.7 25 5081.48 747.9 1 5846.00 628.6 30 5072.98 700.7 12° 45 4108.45 1106 5 5000.00 504.6 10 5830.41 715.2 24 4976.69 294.2 13° 41 4002.19 -459.7 23 4970.37 300.3 15 5823.77 636.2 3 4954.97 604.7 14° 7 3964.13 1007.4 41 4855.56 251.9 31 5783.81 398.5 9 4932.24 -426.2 15° 6 3930.67 695.7 4 4851.85 58.6 29 5734.88 653.4 31 4883.51 -1104 16° 17 3874.61 819.4 42 4840.74 470.9 11 5719.29 418.2 15 4875.67 533.7 17° 8 3811.64 499.3 1 4829.63 332.2 33 5608.96 4.0 8 4832.24 502.2 18° 3 3807.43 -603.9 18 4829.63 555.3 17 5583.98 665.5 32 4775.59 459.2 19° 19 3775.24 -604.8 19 4662.96 217.8 8 5537.81 362.2 10 4725.85 456.2 20° 40 3749.51 344.7 50 4655.56 -4.4 9 5511.11 -5.7 11 4712.71 257.3 21° 2 3722.37 196.5 46 4625.93 205.2 44 5504.05 430.7 6 4648.65 396 22° 46 3637.06 359.6 8 4618.52 162.9 40 5500.78 232.7 33 4628.03 -131.2 23° 1 3627.61 273.5 6 4607.41 229.1 14 5464.69 246.1 34 4591.50 539 24° 20 3549.32 -76.3 16 4511.11 -234 35 5418.52 418 1 4493.86 122.1 25° 14 3539.23 184.0 36 4496.30 79.4 23 5377.78 -12.2 50 4453.96 38.7 26° 32 3515.47 216.7 30 4492.59 -5.3 4 5352.80 -160 22 4409.94 182.3 27° 21 3488.01 1517.1 15 4488.89 21.3 19 5331.96 166.8 13 4373.49 -46.5 28° 37 3406.41 64.3 32 4474.07 32.06 42 5317.92 228.1 37 4368.27 8.5 29° 5 3378.44 26.3 47 4429.63 3.06 25 5208.96 155.4 40 4362.96 317 30° 42 3369.24 142.7 2 4400.00 -269.1 5 5207.41 -7.9 49 4183.59 -415
31° 36 3356.21 82.6 49 4385.19 114.6 34 5168.99 271 29 4118.52 -117.3 32° 11 3329.14 -1094 26 4377.78 232.4 47 5061.01 -85.5 28 4107.41 286.3 33° 38 3270.52 254.2 44 4225.93 -127.3 3 4991.22 -204 39 4093.10 6 34° 34 3260.94 -590.7 39 4137.04 235.3 38 4977.18 97.6 26 4058.67 38.9 35° 43 3252.00 -1023 12 4051.85 -207.3 16 4963.14 -502 12 3942.34 -191.2 36° 35 3251.36 114.2 24 4033.33 -376.8 37 4807.58 -398 7 3805.22 -169.1 37° 39 3181.63 -740.6 10 4000.00 -395.2 28 4754.18 87.5 14 3799.92 -573 38° 10 3164.13 -87.8 34 3970.37 -207.7 20 4719.89 -769 25 3760.86 -447.0 39° 26 2980.99 -21.06 48 3951.85 -36.9 12 4664.51 -314 41 3747.06 -59.4 40° 18 2849.70 -281.3 38 3940.74 -218.8 32 4583.03 -580 36 3730.64 -560.5 41° 25 2846.64 -343.5 13 3770.37 -775.3 45 4562.19 -303 18 3495.20 -653.4 42° 49 2842.42 -1315 40 3729.63 -818.4 6 4436.44 -662 48 3448.15 996
43° 47 2780.35 -502.9 29 3585.19 -776.2 7 4434.88 -385 38 3423.23 -610 44° 27 2630.67 -42.8 43 3540.74 -534.2 27 4426.53 -110 5 3416.92 -952.8 45° 48 2622.24 -223.2 22 3496.30 -856.9 48 4401.55 -307 35 3407.91 -747 46° 12 2529.27 -586.6 21 3340.74 -1019 26 4284.58 -581 43 3385.69 -1084 47° 24 2231.31 -1035 28 3255.56 -691.1 46 4283.21 -857 27 3306.82 -384.3 48° 28 2121.22 -682.2 27 3122.22 -694.6 21 4095.09 -985 42 3159.77 -731 49° 44 2113.30 -1096 7 2966.67 -233.3 22 3883.98 -120 17 3150.17 -922.7 50° 29 1125.56 -2092 17 2651.85 -880 39 3829.80 -792 45 2988.30 1011
D = 28,24 D = 26.53 D = 27.18 D = 28.98
table 3. Means, estimates of specific combining ability (Sij) and discrimination ability of testers, according to the D index and P performance index (Fasoulas 1983), for grain yield (kg∙ha–1) of topcross hybrids, based on the Student’s t-test (0.05) for
means comparisons.
ˆ ˆ ˆ ˆ
Order brs Angela iAc 125 P2 UenF-14
s3 Mean Sij s3 Mean Sij s3 Mean Sij s3 Mean Sij
1° 44 37.33 7.08 21 41.33 -4 2 34.17 9.22 40 34.83 3.93
2° 39 36.67 6.56 2 40.67 8.96 1 31.92 7.88 25 34.58 2.74 3° 7 36.25 4.2 45 40.00 3.04 7 30.58 4.01 4 33.83 3.88 4° 31 35.83 4.76 23 36.67 1.83 30 30.50 8.37 47 33.58 1.85 5° 19 35.42 7.3 48 36.25 0.39 39 30.42 5.75 1 33.33 4.55
6° 18 35.00 0.95 44 35.42 3.84 18 29.33 0.73 11 33.00 1.11 7° 48 34.67 3.88 9 35.00 1.37 8 29.25 3.03 20 32.92 4.05
8° 13 34.58 2.54 39 35.00 3.57 46 29.00 5.09 27 32.83 2.35 9° 16 34.25 2.19 25 34.58 0.72 45 28.25 5.47 14 32.58 2.07 10° 34 34.00 2.49 14 34.58 2.05 23 28.08 0.01 37 32.58 3.91
11° 33 33.92 3.6 46 34.58 3.92 12 27.75 1.83 15 32.42 1.49 12° 2 33.83 3.4 33 34.50 1.76 27 27.58 1.84 22 32.33 5.41
13° 21 33.75 2.3 35 34.50 2.39 49 27.58 4.15 23 32.33 -0.5 14° 26 33.67 2.22 49 34.50 4.31 9 27.42 0.55 31 32.33 1.95 15° 14 33.42 2.2 41 34.33 3.30 16 27.33 -6.8 8 32.25 1.29 16° 23 33.33 -0.2 47 34.17 0.42 40 27.25 1.09 34 32.00 2.3 17° 50 33.33 4.25 37 33.42 2.73 21 27.17 1.23 48 31.92 1.83 18° 30 33.08 5.52 6 33.33 1.12 48 27.00 1.66 45 31.42 3.89 19° 47 32.92 0.48 24 33.33 0.34 33 26.92 0.94 50 31.33 2.95 20° 5 32.67 3.01 34 33.33 1.60 5 26.50 2.28 49 31.17 3 21° 9 32.42 0.11 40 33.33 0.41 28 26.50 0.88 16 31.00 -0.3 22° 43 32.33 -5.2 42 33.17 -1.1 36 26.25 0.96 39 30.92 1.50 23° 46 32.08 2.73 4 33.17 1.19 4 26.08 0.87 26 30.75 5.92
24° 35 32.00 -8.4 8 33.00 0.02 14 25.92 0.15 35 30.67 0.58 25° 45 32.00 -3.9 15 32.92 -0.1 42 25.58 -1.9 44 30.33 0.77 26° 11 31.92 -0.6 20 32.83 1.95 15 25.42 -0.7 7 30.00 -1.3 27° 32 31.67 0.32 31 32.83 0.43 22 25.08 0.24 24 29.83 -1.1 28° 25 30.92 -1.6 36 32.67 -9.1 13 24.92 -1.7 19 29.50 2.10 29° 20 30.50 0.94 30 32.42 3.53 31 24.92 -0.7 17 29.17 0.38 30° 40 30.17 -1.4 13 32.42 -0.9 10 24.75 1.72 42 29.17 -3.0 31° 42 30.17 -2.7 43 32.42 0.46 26 24.58 -1.4 5 29.08 0.12 32° 15 30.00 -1.6 10 32.17 2.37 6 24.50 -0.9 13 28.92 -2.4 33° 27 29.92 -1.2 18 31.92 -3.4 43 24.25 -0.9 29 28.83 -1.3 34° 24 29.92 -1.7 3 31.58 -0.1 35 24.17 -1.2 2 28.75 -0.9 35° 49 29.83 0.96 5 31.50 0.52 37 24.00 0.1 18 28.75 -4.6 36° 1 29.50 0.03 17 31.42 4.19 20 23.50 -0.6 6 28.42 -1.7 37° 10 29.50 1.03 11 31.33 -2.6 32 23.50 -2.4 28 28.33 -2.0 38° 12 29.33 -2.0 27 31.25 -1.2 44 23.50 -13 38 28.25 0.31 39° 29 29.17 -1.6 1 31.00 0.21 34 23.42 -1.5 9 28.08 -3.5 40° 22 28.67 -1.6 29 31.00 -1.1 11 23.25 -2.3 3 27.83 -1.8 41° 3 28.50 -1.8 50 30.58 0.19 29 23.08 -3.9 41 27.75 -1.2 42° 41 28.50 -1.2 7 30.25 -3.1 25 22.92 -4.2 30 27.67 0.79 43° 4 28.25 -2.4 26 30.08 -2.7 41 22.92 -1.3 43 27.33 -2.6 44° 8 27.75 -3.9 16 30.00 -3.4 19 22.33 -0.3 32 27.17 -3.5 45° 38 27.67 -0.9 28 29.75 -2.6 50 22.17 -1.5 10 26.50 -1.3 46° 17 27.58 -1.9 38 29.33 -0.6 24 21.92 -4.3 12 26.25 -4.4 47° 36 27.25 -3.5 19 28.17 -1.2 47 21.42 -5.5 36 24.42 1.96 48° 28 26.33 -4.7 12 27.33 -5.3 3 20.92 -4.0 33 24.08 -0.2 49° 6 25.83 -5.0 22 26.50 -5.1 38 20.83 -2.3 46 22.25 -6.4 50° 37 25.25 -4.1 32 25.25 -7.4 17 17.25 0.72 21 18.92 -12
D = 7.51 D = 19.92 D = 16.08 D = 25.22
table 4. Means, estimates of specific combining ability (Sij) and discrimination ability of testers, according to the D index and P performance index (Fasoulas 1983), for popping expansion (mL∙g–1) of topcross hybrids, based on the Student’s t-test (0.05) for means
comparisons.
ˆ ˆ ˆ ˆ
among the 50 produced with this tester, in descending order of yield, were the families 4, 9, 16, 23 and 33. Of the nine topcross hybrids from the IAC 125 that showed better average of GY, three were formed with families (9, 20 and 33) which obtained high indices of GCA. In the tester UENF-14, three topcross hybrids with high average GY stood out, combined with families of high GCA effect, namely, families 2, 4 and 20 (Table 5). Thus, it can be said that the tester BRS Angela discriminated
more consistently S3 families, according to their genetic
merit for GY.
Among the nine hybrids showing better values of PE, obtained with the tester BRS Angela, only one (sixth most expansive) was formed with a family of high index of GCA; the best family for such effect was the family 18. For the tester IAC 125, three hybrids (fourth, seventh
and ninth) of greater PE were formed by families that presented high GCA indices, the families 23, 25 and 9.
The tester P2, as well as the tester BRS Angela, classified
only one hybrid with high PE (sixth best hybrid) with the family 18, which had the best GCA index for the trait. Among the hybrids from the UENF-14 tester with the highest values of PE, three were formed by families with significantly high GCA effects, the families 11, 25 and 47 (Table 5). The testers IAC 125 and UENF-14 stood out for having three topcross hybrids, classified with high PE indices within each group (tester), obtained from
crossing with S3 families that held high indices of GCA.
However, the hybrids from the tester IAC 125 provided a higher general average for the trait PE in relation to hybrids produced by crossings with the tester UENF-14. Therefore, the best tester for PE is the IAC 125.
grain yield Popping expansion
s3 rg t1 t2 t3 t4 cgc s3 ce t1 t2 t3 t4 cgc
2 1106 7° 1° 7° 1 16.6 2° 5°
4 1087 1° 3° 3° 2 21.5 2° 1°
5 1972 5° 4 23.5 3°
9 2585 2° 1° 1° 7 26.1 3° 3°
11 1640 3° 8 27.1 7°
13 1202 3° 9 29.3 7° 7°
14 1397 6° 11 32.2 6° 4°
15 670 7° 13 29.3 8°
16 1824 5° 7° 5° 14 23.2 9°
18 817 6° 16 28.5 9°
19 907 2° 18 35.2 6° 6° 1°
20 1516 2° 4° 4° 19 28.6 5°
22 1830 6° 20 19.9 7°
23 1330 8° 9° 6° 21 32.7 1°
24 1416 3° 23 30.4 4° 2°
30 576 8° 25 30.2 9° 2° 5°
31 1814 7° 27 25.5 8°
33 2051 9° 4° 2° 30 11.6 4°
35 938 8° 31 22.9 4°
36 1316 9° 39 15.5 2° 8° 5°
37 1531 9° 40 25.2 1°
41 1720 2° 42 34.2 3°
43 1084 4° 44 25.2 1° 6°
44 1364 8° 45 16.2 3° 9°
cOnclUsiOn
The testers BRS Angela (for GY) and IAC 125 (for PE)
grain yield Popping expansion
s3 rg t1 t2 t3 t4 cgc s3 ce t1 t2 t3 t4 cgc
46 1276 6° 46 20.0 8°
47 1414 5° 47 30.2 4° 6°
49 709 1° 48 21.7 7° 5°
50 974 4° 5°
tabela 5. Continuation...
were the most appropriate, when combined with S3 families
derived from UENF-14 for the production of popcorn hybrids for the Northern and Northwestern Fluminense Regions.
Amaral Júnior, A. T., Gonçalves, L. S. A., Freitas Júnior, S. P., Candido,
L. S., Vitorazzi, C., Pena, G. F., Ribeiro, R. M., Silva, T. R. C., Pereira, M.
G., Scapim, C. A., Viana, A. P. and Carvalho, G. F. (2013). UENF-14: a
new popcorn cultivar. Crop Breeding and Applied Biotechnology,
13, 218. http://dx.doi.org/10.1590/S1984-70332013000300013.
Arnhold, E. and Milani, K. F. (2011). Rank-ordering coefficients
of variation for popping expansion. Acta Scientiarum Agronomy,
33, 527-531. http://dx.doi.org/10.4025/ actasciagron.v33i3.11911.
Arnhold, E., Viana, J. M. S. and Silva, R. G. (2009). Associação de
desempenho entre famílias S3 e seus híbridos topcross de
milho-pipoca. Revista Ciência Agronômica, 40, 396-399.
Barreto, R. R., Scapim, C. A., Amaral Júnior, A. T., Rodovalho, M. A.,
Vieira, R. A. and Schuelter, A. R. (2012). Avaliação da capacidade de
combinação de famílias S2 de milho-pipoca por meio de diferentes
testadores. Semina: Ciências Agrárias, 33, 873-890. http://dx.doi. org/10.5433/1679-0359.2012v33n3p873.
Cruz, C. D. (2013). GENES - a software package for analysis in
experimental statistics and quantitative genetics. Acta Scientiarum
Agronomy, 35, 271-276. http://dx.doi.org/ 10.4025/actasciagron. v35i3.21251.
Davis, R. L. (1927). Report of plant breeder. Mayaguez: Puerto Rico
Agricultural Experiment Station.
Fasoulas, A. C. (1983). Rating cultivars and trials in applied plant
breeding. Euphytica, 32, 939-943. http://dx.doi.org/10.1007/ BF00042176.
Ferreira, E. A., Paterniani, M. E. A. G. Z., Duarte, A. P., Gallo, P. B.,
Sawazaki, E., Azevedo Filho, J.A. and Guimarães, P. S. (2009).
Desempenho de híbridos topcrosses de linhagens S3 de milho
reFerences
em três locais do Estado de São Paulo. Bragantia, 68, 319-327.
http://dx.doi.org/10.1590/S0006-87052009000200005.
Fritsche Neto, R., Vieira, R. A., Scapim, C. A., Miranda, G. V. and
Rezende L. M. (2012). Updating the ranking of the coefficients of
variation from maize experiments. Acta Scientiarum Agronomy,
34, 99-101. http:// 10.4025/actasciagron.v34i1.13115.
Geraldi, I. O. and Miranda Filho, J. B. (1988). Adapted models for the
analysis of combining ability of varieties in partial diallel crosses.
Brazilian Journal of Genetics, 2, 419-430.
Granate, M. J., Cruz, C. D. and Pacheco, C. A. P. (2002). Predição
de ganho genético com diferentes índices de seleção no
milho-pipoca cms-43. Pesquisa Agropecuária Brasileira, 37, 101-108.
http://dx.doi.org/10.1590/S0100-204X2002000700014.
Griffing, A. R. (1956). Concept of general and specific combining
ability in relation to diallel crossing system. Australian Journal of
Biological Science, 9, 463-493.
Hallauer, A. R, Carena, M. J. and Miranda Filho, J. B. (2010).
Quantitative genetics in maize breeding. Iowa: Springer.
Jenkins, M. T. and Brunson, A. M. (1932). Methods of testing inbred
lines of maize in crossbred combinations. Journal of the American
Society of Agronomy, 24, 523-530.
Miranda Filho, J. B. and Gorgulho, E. P. (2001). Cruzamentos com
testadores e dialelos. In L. L. Nas, A. C. C. Valois, I. S. Melo, and M.
C. Valadares, Inglis recursos genéticos e melhoramento: plantas
(p. 649-672). Rondonópolis: Fundação-MT.
Pereira, M. G. and Amaral Júnior, A. T. (2001). Estimation of
Crop Breeding and Applied Biotechnology, 1, 3-10. http://dx.doi. org/10.13082/1984-7033.v01n01a01.
Pinto, R. J. B., Scapim, C. A., Ferreira Neto, A., Pacheco, C. A. P.,
Royer, M., Pedroni, M. V., Salvadori, R. K. and Silva, R. M. (2004).
Analysis of testers of broad and narrow genetic base for topcrosses
in popcorn breeding. Crop Breeding and Applied Biotechnology,
4, 152-162.
Rodovalho, M., Mora, F., Arriagada, O., Maldonado, C., Arnhold,
E. and Scapim, C. A. (2014). Genetic evaluation of popcorn
families using a Bayesian approach via the Independence chain
algorithm. Crop Breeding and Applied Biotechnology, 14, 261-265.
http://dx.doi.org/10.1590/1984-70332014v14n4n41.
Rodovalho, M., Scapim, C. A., Barth Pinto, R. J., Barreto,R. R., Ferreira,
F. R. A. and Clóvis, L. R. (2012). Comparação de testadores em
famílias S2 obtidas do híbrido simples de milho-pipoca IAC-112.
Bioscience Journal, 28, 145-154.
Scapim, C. A., Carvalho, C. G. P. and Cruz, C. D. (1995). Uma proposta
de classificação dos coeficientes de variação para a cultura do
milho. Pesquisa Agropecuária Brasileira, 30, 683-686.
Scapim, C. A., Royer, M. R., Barth Pinto, R. J., Amaral Júnior, A. T.,
Pacheco, C. A. P. and Moterle, L. M. (2008). Comparison of testers
in the evaluation of combining ability of S2 families in popcorn.
Revista Brasileira de Milho e Sorgo, 7, 83-91.
Seifert, A. L., Carpentieri-Pípolo, V., Ferreira, J. M. and Gerage, A.
C. (2006). Análise combinatória de populações de milho-pipoca
em topcrosses. Pesquisa Agropecuária Brasileira, 41, 771-778.
http://dx.doi.org/10.1590/S0100-204X2006000500008.
Souza Neto, I. L., Barth Pinto, R. J., Scapim, C. A., Jobim, C. C., Figueiredo,
A. S. T. and Bignotto, L. S. (2015). Diallel analysis and inbreeding
depression of hybrid forage corn for agronomic traits and chemical
quality. Bragantia, 74, 42-49. http://dx.doi.org/10.1590/1678-4499.0315.
Vencovsky, R. and Barriga, P. (1992). Genética biométrica no
melhoramento. Ribeirão Preto: SBG.
Viana, J. M. S., Condé, A. B. T., Almeida, R. V., Scapim, C. A. and
Valentini, L. (2007). Relative importance of per seand topcross
performance in the selection of popcorn S3 families. Crop Breeding
and Applied Biotechnology, 7, 74-81.
Yongbin, D., Zhongwei, Z., Qingling, S., Qilei, W., Qiang, Z. and
Yuling, L. (2012). Quantitative trait loci mapping and meta-analysis
across three generations for popping characteristics in popcorn.