Carmen Argmann1, Radu Dobrin2.¤a, Sami Heikkinen1,3.¤b, Aure´lie Auburtin4, Laurent Pouilly4, Terrie-Anne Cock1, Hana Koutnikova4, Jun Zhu2¤c, Eric E. Schadt2¤d, Johan Auwerx1,4,5*
1Institut de Ge´ne´tique et de Biologie Mole´culaire et Cellulaire, CNRS/INSERM/Universite´ Louis Pasteur, Illkirch, France,2Rosetta Inpharmatics, Seattle, Washington, United States of America, 3A. I. Virtanen Institute for Molecular Sciences, University of Kuopio, Kuopio, Finland,4Institut Clinique de la Souris, Illkirch, France,5Ecole polytechnique Fe´de´rale de Lausanne, Lausanne, Switzerland
Abstract
Aging involves a progressive physiological remodeling that is controlled by both genetic and environmental factors. Many of these factors impact also on white adipose tissue (WAT), which has been shown to be a determinant of lifespan. Interrogating a transcriptional network for predicted causal regulatory interactions in a collection of mouse WAT from F2 crosses with a seed set of 60 known longevity genes, we identified a novel transcriptional subnetwork of 742 genes which represent thus-far-unknown longevity genes. Within this subnetwork, one gene wasPparg(Nr1c3), an adipose-enriched nuclear receptor previously not associated with longevity. In silico, both the PPAR signaling pathway and the transcriptional signature of Pparcagonist rosiglitazone overlapped with the longevity subnetwork, while in vivo, lowered expression of
Pparg reduced lifespan in both the lipodystrophic Pparg1/2-hypomorphic and the Pparg2-deficient mice. These results establish Pparc2 as one of the determinants of longevity and suggest that lifespan may be rather determined by a purposeful genetic program than a random process.
Citation:Argmann C, Dobrin R, Heikkinen S, Auburtin A, Pouilly L, et al. (2009) Pparc2 Is a Key Driver of Longevity in the Mouse. PLoS Genet 5(12): e1000752. doi:10.1371/journal.pgen.1000752
Editor:Gregory S. Barsh, Stanford University School of Medicine, United States of America
ReceivedMay 6, 2009;AcceptedNovember 4, 2009;PublishedDecember 4, 2009
Copyright:ß2009 Argmann et al. This is an open-access article distributed under the terms of the Creative Commons Attribution License, which permits unrestricted use, distribution, and reproduction in any medium, provided the original author and source are credited.
Funding:We acknowledge grant support of the NIH (DK067320-01), the European Union (Eugene2; LSHM-CT-2004-512013 and Sirtuins; ERC-2008-AdG-23118), the Ecole Polytechnique Federale de Lausanne, the Swiss National Science Foundation, Universite Louis Pasteur, CNRS, INSERM, the Hopital Universitaire de Strasbourg, France, and the Academy of Finland. The funders had no role in study design, data collection and analysis, decision to publish, or preparation of the manuscript.
Competing Interests:RD, JZ, and EES work for Merck and Co. and own stock in the company. * E-mail: [email protected]
¤a Current address: Merck & Co., Rahway, New Jersey, United States of America ¤b Current address: Department of Biosciences, University of Kuopio, Kuopio, Finland ¤c Current address: Sage Bionetwork, Seattle, Washington, United States of America ¤d Current address: Pacific Biosciences, Menlo Park, California, United States of America .These authors contributed equally to this work.
Introduction
Aging is not a disease, but a natural evolution characterized by declining biological function, whose timeline is sensitive to both environmental and genetic factors. Several longevity candidate genes have been identified, including the insulin/IGF1 signaling pathway [1–3]. With the use of dietary regimens, such as caloric restriction (CR) and by modulating core body temperature, the control of energy metabolism has been implicated as a critical determinant of the aging phenotype [4–6]. A central physiological component of energy metabolism, involved in energy preservation, is the white adipose tissue (WAT), which has also been directly associated with the determination of lifespan [7,8]. However, it is still uncertain whether WAT modulates aging via its ability to e.g. store fat, sensitize towards insulin, or produce adipocyte hormones. Also unknown is the nature of the involved genetic players and importantly, whether they function in a purposeful program or as random genetic events.
Using a systems approach we identified a novel subnetwork of genes in mouse WAT, which potentially impacts longevity, suggesting that aging is the result of a determined transcriptional network program and not entirely accidental. Furthermore, the most significantly enriched biological pathway revealed within this
aging subnetwork was the PPAR signaling pathway. The aging subnetwork also contained the nuclear receptor Pparg (Nr1c3), a transcription factor well associated with adipocyte biology [9,10], but whose contribution to longevity has not been previously assessed. In this study, we support our network theory of aging by demonstrating a significantly altered lifespan in 2 independent genetic mouse models expressing reduced levels ofPparg. Thus, in addition to providing novel candidate ‘longevity genes’ such as
Pparg2, this study also provides further insight into the potential role of WAT biology and genetics as determinants of lifespan.
Results/Discussion
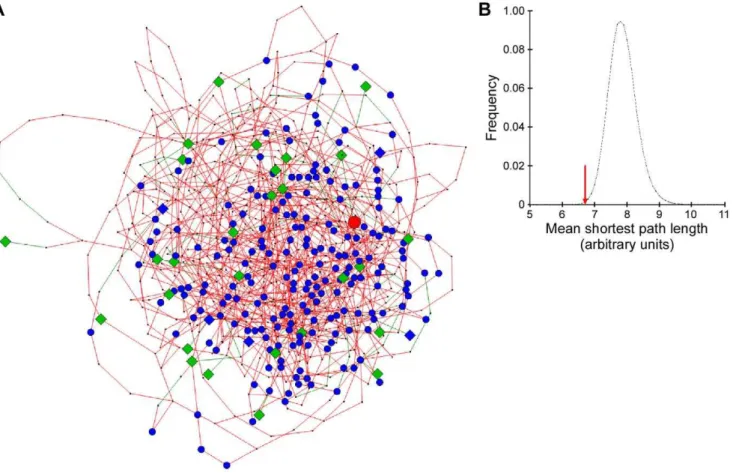
mouse (Table S1). Out of these 60 ‘known’ longevity genes, 33 were also present within the adipose tissue network (Table S1; Figure 1A). The pair-wise shortest path analysis against 106 randomly selected sets of 33 genes showed that these 33 genes on average were much more tightly connected than expected by chance (p= 0.00149) (Figure 1B). Furthermore, the distribution of the shortest paths within the set of 33 ‘known’ longevity genes was
significantly tighter than that for the randomly selected sets as
.99% of all Kolmogorov-Smirnov two-sided test p-values were less than 0.05. This tight, non-random interconnection of known aging-linked genes suggests that the associated biological phenom-ena are deliberate such that other ‘unknown’ age-related genes and/or biological processes may be predicted. This network theory is reminiscent of the transcriptional consequences of single genetic perturbations, such as knock-out mouse models or DNA polymorphisms, which result in concentrations of transcriptional changes in the genes functionally relating to the perturbed gene rather than altering genes diffusely distributed across the whole network [11]. Following the concept of using the ‘known’ to discover the ‘unknown’, we thus expanded the subnetwork beyond the 33 longevity genes to other genes most highly connected to them, and obtained a larger subnetwork, containing 742 genes (Table 1, Table S2). By assigning importance to the closeness of connection with known longevity genes, we were thus able to suggest several hundred additional genes that may influence the aging process. One such example, among the top 20 genes for the closeness of connectivity with the 33 ‘known’ longevity genes (Table 1), was the eukaryotic translation initiation factor 4E (eIF4E) binding protein 1 (Eif4ebp1, or 4E-BP1) which, in the unphosphorylated state, represses mRNA translation by binding to eIF4E. Since it regulates adipogenesis and metabolism [12], and one of the mediators of its phosphorylation is insulin signaling Author Summary
The progression of aging is controlled by both genetic and environmental factors. Many of these factors are present also in adipose tissue, which itself has been shown to determine lifespan. Applying advanced bioinformatics methods on a large mouse gene expression data set, we identifiedPparg(Nr1c3), an important metabolic controller that regulates the expression of many other genes particularly in adipose tissue, to be associated with longevity. This association was verified in experimental mouse models where the lowered expression of Pparg reduced lifespan. In addition to Pparg, our analysis identified .700 potential novel aging genes in mouse adipose tissue. More generally, these findings suggest that lifespan may not be a random process but controlled by a purposeful genetic program.
Figure 1. A subnetwork of likely longevity genes in mouse adipose tissue.(A) Longevity-related subnetwork of 775 genes, extracted from the mouse adipose transcriptional network of 13,088 genes. The 33 ‘‘known’’ longevity genes used as a seed set are depicted as green diamonds, and the 213 genes overlapping from the mouse WAT rosiglitazone signature in blue circles. The 5 gene overlap of ‘‘known’’ longevity genes and rosiglitazone signature is shown as blue diamonds.Pparg, shown as a red circle, is part of the rosiglitazone signature. (B) The distribution of mean shortest path lengths (m) for the set of 33 ‘‘known’’ longevity genes and 106randomly selected sets of 33 genes within the mouse consensus network.
Red arrow marks the mean shortest path (m= 6.7102) for the ‘‘known’’ longevity genes.
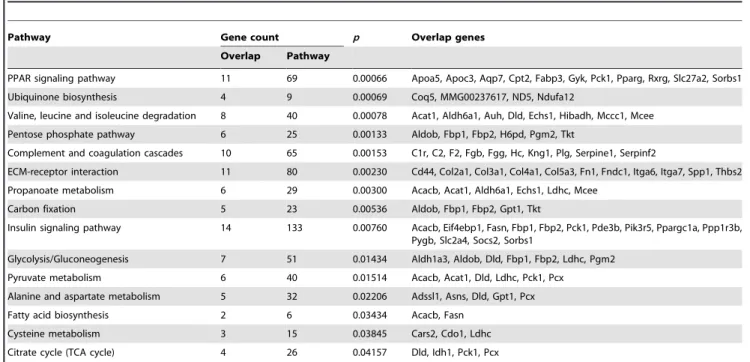
[13], Eif4ebp1 can be linked to the established effects of insulin signaling on longevity. Moreover, in Drosophila 4E-BP plays an important role in lifespan extension upon dietary restriction [14]. Eif4ebp1 has furthermore been identified as a ‘‘funnel factor’’ in cancer, through which several oncogenic pathways converge [15]. Biological pathway enrichment analysis is a powerful tool to uncover functional associations within an a priori selected set of genes. When applied to the aging subnetwork of 742 genes (excluding the 33 ‘known’ longevity genes from the full set of 775 genes to eliminate bias), significant enrichment was revealed in several ontology classes with established links to aging such as complement and coagulation cascade (i.e. inflammation), insulin signaling, and ubiquinone pathway (i.e. oxidative stress) (Table 2). Importantly, however, several pathways lacking previously demonstrated association with longevity also appeared among the significantly enriched ontologies. One of these, the PPAR signaling pathway, was actually ranked the highest for the enrichment of all potential longevity genes. Although direct in vivo evidence linking Ppars to aging are scarce, conceptual evidence does exist [16,17], including links to age-related changes in inflammatory response, insulin sensitivity, distribution and proportion of body fat, oxidative stress [18], and fatty acid oxidation rate. Of the three actual Ppar family members, the only one that was present within the aging subnetwork was Pparc(Table S2). Given that signaling through Pparc
is also of vital importance to proper adipose tissue development and function [9,10,19–21], and that Pparcis regulated in WAT by one of the best established longevity determinants, mammalian SIR2
orthologue sirtuin 1 (Sirt1) [22], we hypothesized that perturbing Pparcsignaling might affect longevity.
We first tested this hypothesis in silico by using the WAT gene expression signature generated from mice with chemically modulated Pparcactivity through the administration of the Pparc
agonist, rosiglitazone [11]. Notably, 213 out of the 1669 genes whose transcriptional expression was altered by Pparcactivation, overlapped with the genes in the aging subnetwork at a very high significance level (p= 5.2028*10230) (Table S2). This finding thus validates the association ofPpargwith the aging subnetwork and further implicates it as a potential determinant of the aging phenotype.
To put this hypothesis to further rigorous in vivo testing, we investigated the role ofPparg in longevity in two mouse models with genetically altered levels ofPpargexpression: the hypomorphic
Pparg1/2knock-out mouse, which lacksPpargexclusively in WAT (Figure S1A) and is severely lipodystrophic and remains insulin resistant throughout life [19]; and thePparg2deficient mouse that lacksPparc2in all tissues (Figure S1B) and shows some features of
moderate lipodystrophy and insulin resistance at a young age [23], but which fully compensates upon aging (see below). The nearly complete knockdown ofPparg1 andPparg2 in the WAT of male
Pparghyp/hyp mice resulted in a reduction in lifespan by approxi-mately 16 weeks when compared to the wild type mice (93.764.4 vs 109.663.4 weeks, p = 0.03) (Figure 2A). In some respects this observation goes against the prediction that reduced fat mass, as seen during CR [4,5], would increase longevity; however, if the known insulin sensitizing effects of Pparcwere key to mediating the effects of CR, then one would expect reduced longevity in the
Pparghyp/hyp mice, where whole body insulin resistance is promi-nent. However, one potentially confounding factor in this experiment is the profound lipodystrophy exhibited by the
Pparghyp/hyp mice, which may not represent ‘normal’ metabolic environment due to the amount of metabolic compensation by the upregulation of other signaling pathways that these mice need for survival [19]. Also, although differences in the amount of gross Table 1.Top 20 genes most highly connected to the set of 33 ‘‘known’’ longevity genes in male mouse adipose tissue.
Gene symbol Ranka Distanceb Gene name
Hoxa7 1 4.636 homeo box A7
Npr3 2 4.697 natriuretic peptide receptor 3 Tmem182 3 4.697 transmembrane protein 182
Plxnb2 5 4.758 plexin B2
Fads3 6 4.788 fatty acid desaturase 3
Mcam 7 4.788 melanoma cell adhesion molecule
Mmd 8 4.818 monocyte to macrophage differentiation-associated 1110006G14Rik 9 4.818 RIKEN cDNA 1110006G14 gene
Palmd 10 4.848 palmdelphin
Fry 11 4.879 furry homolog (Drosophila)
Apcdd1 12 4.879 adenomatosis polyposis coli down-regulated 1 Gpt1 13 4.909 glutamic pyruvic transaminase 1, soluble Prelp 14 4.909 proline arginine-rich end leucine-rich repeat
Eif4ebp1 15 4.909 eukaryotic translation initiation factor 4E binding protein 1
MMG00345348 17 4.909 NA
Echdc3 18 4.909 enoyl Coenzyme A hydratase domain containing 3 Fzd4 19 4.970 frizzled homolog 4 (Drosophila)
Apol6 20 4.970 apolipoprotein L, 6
Rtn2 21 4.970 reticulon 2 (Z-band associated protein) Smoc1 23 4.970 SPARC related modular calcium binding 1
aRank within the whole male mouse adipose tissue network of 10,388 genes. bDistance to the subnetwork of 33 ‘‘known’’ longevity genes.
tumors were not observed upon macroscopic necropsy, we can not exclude the possible contribution of more discrete tumors to the decreased longevity of thePparghyp/hypmice. Interestingly though, the males of an equally lipodystrophic A-ZIP/F-1 mouse model have more than 40% mortality rate before 30 weeks of age [8], in comparison to the Pparghyp/hyp mice which survived 85% of the average,2 year lifespan of wild type mice. In this sense,Pparghyp/hyp mouse model is one of the longest living severely lipodystrophic models reported.
In order to assess more directly the effects ofPpargon longevity, without the added complication of reduced adiposity or insulin sensitivity, we made use ofPparg22/2 mice that we generated in the laboratory and which lack Pparc2, the WAT enriched Pparc
isoform, in all tissues. Although young Pparg22/2mice are lean [23], our,2 year oldPparg22/2mice had the same total and lean
body mass, body fat content (Figure S2A and S2B), and caloric intake (12.3361.53 vs. 14.2461.53 kcal/day/mouse,p= 0.421) as their age-matched littermate controls. YoungPparg22/2mice have also been reported to be insulin resistant [23]. Again in contrast, there were no differences in glucose tolerance, the HOMA index for insulin resistance, nor in circulating insulin or adiponectin levels between ourPparg22/2andPparg2+/+mice at
,2 years of age (Figure S2C, S2D, S2E, S2F). Thus, our agingPparg22/2mice represent a very metabolically ‘clean’ model for investigating the role ofPparg2in longevity.
Consistent with reduced longevity in thePparghyp/hypmouse, we noted a significant decrease in lifespan inPparg22/2 mice. The femalePparg22/2mice lived, on average, 8.8 weeks less than their wild type controls (p = 0.02 when limiting the analysis to those living no more than 120 weeks), although this difference seemed to Table 2.Pathway analysis of the predicted novel longevity genes in male mouse adipose tissue.
Pathway Gene count p Overlap genes
Overlap Pathway
PPAR signaling pathway 11 69 0.00066 Apoa5, Apoc3, Aqp7, Cpt2, Fabp3, Gyk, Pck1, Pparg, Rxrg, Slc27a2, Sorbs1 Ubiquinone biosynthesis 4 9 0.00069 Coq5, MMG00237617, ND5, Ndufa12
Valine, leucine and isoleucine degradation 8 40 0.00078 Acat1, Aldh6a1, Auh, Dld, Echs1, Hibadh, Mccc1, Mcee Pentose phosphate pathway 6 25 0.00133 Aldob, Fbp1, Fbp2, H6pd, Pgm2, Tkt
Complement and coagulation cascades 10 65 0.00153 C1r, C2, F2, Fgb, Fgg, Hc, Kng1, Plg, Serpine1, Serpinf2
ECM-receptor interaction 11 80 0.00230 Cd44, Col2a1, Col3a1, Col4a1, Col5a3, Fn1, Fndc1, Itga6, Itga7, Spp1, Thbs2 Propanoate metabolism 6 29 0.00300 Acacb, Acat1, Aldh6a1, Echs1, Ldhc, Mcee
Carbon fixation 5 23 0.00536 Aldob, Fbp1, Fbp2, Gpt1, Tkt
Insulin signaling pathway 14 133 0.00760 Acacb, Eif4ebp1, Fasn, Fbp1, Fbp2, Pck1, Pde3b, Pik3r5, Ppargc1a, Ppp1r3b, Pygb, Slc2a4, Socs2, Sorbs1
Glycolysis/Gluconeogenesis 7 51 0.01434 Aldh1a3, Aldob, Dld, Fbp1, Fbp2, Ldhc, Pgm2 Pyruvate metabolism 6 40 0.01514 Acacb, Acat1, Dld, Ldhc, Pck1, Pcx
Alanine and aspartate metabolism 5 32 0.02206 Adssl1, Asns, Dld, Gpt1, Pcx Fatty acid biosynthesis 2 6 0.03434 Acacb, Fasn
Cysteine metabolism 3 15 0.03845 Cars2, Cdo1, Ldhc Citrate cycle (TCA cycle) 4 26 0.04157 Dld, Idh1, Pck1, Pcx
The input set of 197 genes was determined by the overlap of the full set of 742 potentially novel longevity genes and the set of 3835 genes for which functional data was available in the KEGG repository at the time of analysis. Note that the 33 ‘‘known’’ longevity genes were excluded from the determination of the input set to remove bias. Only those pathways withp,0.05 are shown.
doi:10.1371/journal.pgen.1000752.t002
Figure 2.Ppargdetermines longevity.(A) Lifespan of hypomorphic (hyp) Ppargdeficient mice (n= 38 wild type and 24 Pparchyp/hypmice).
**p= 0.003. (B) Lifespan ofPparg2knock-out mice (n= 25 wild type and 26Pparg22/2mice). *p= 0.020 when mice.120 weeks were excluded from
the test.
disappear towards extreme age (Figure 2B). Gross morphological differences that could contribute to mortality were not observed between the genotype groups, although again the contribution of more discrete tumors can not be excluded. Since the Pparg22/2 mice had reduced longevity, comparable to that in Pparghyp/hyp
mice, but were not lipodystrophic or insulin resistant, our observations point more towards a specific role for Pparc2 and
any of its downstream pathways in the regulation of longevity, rather than mere changes in fat content and/or insulin signaling. Together our studies thus reveal another genetic factor, Pparg2, that affects the basic mechanisms of aging, independent of changes in fat mass or insulin sensitivity [1,2,7]. Interestingly, a potential molecular mechanism linking aging and Pparchas recently been suggested to involve a steroid receptor coactivator-1 (SRC-1) as the age-induced loss of PPARc/SRC-1 interactions increased the binding of PPARcto the promoter of a model adipogenic gene for fatty acid binding protein 4 (FABP4, also called aP2) [24].
Both our in silico and in vivo results in the mouse tie longevity tightly together with signaling through Pparc, and especially the
Pparc2 isoform. We have recently shown increased longevity in
knock-in mice carrying the Ala12 allele of the common human genetic variantPro12Alavariant ofPPARG2[25], which associates with leanness and improved insulin sensitivity in both man and mouse [25–27]. The species gap between mice and humans for the role of Pparc2 in longevity is bridged by the observation that
lifespan is increased also in human carriers of theAla12allele of the Pro12Ala variant of PPARG2 [28]. In the clinical setting, therefore, the links we show between longevity and bothPpargand the rosiglitazone signature suggest that thiazolidinediones [29] (TZDs), like rosiglitazone or pioglitazone which are widely used Pparcagonists and insulin sensitizers in the treatment of type 2 diabetes mellitus (T2D), could be beneficial for longevity. On the face of it, this may in fact seem paradoxical, considering that impaired insulin signaling through insulin receptor or its substrates increases, rather than decreases lifespan in a number of mouse models [1,2,7]. However, this can be reconciled by the fact that these models are primarily protected from the detrimental effects of age-induced increase in plasma insulin levels as TZDs lower circulating insulin levels [30,31]. Fittingly, low insulin levels and maintained insulin sensitivity characterize human centenarians [32]. In light of the above, the results from ongoing outcome trials evaluating the long-term health benefits of treatments with PPARc-agonists, i.e. TZDs, are eagerly awaited.
In summary, we have identified a substantial set of potential novel longevity genes in mouse adipose tissue, and demonstrate, as a case study, the significant effects of perturbed Pparcactivity on mouse lifespan. Furthermore, our network analysis suggests that, at least in the context of adipose tissue, the determination of longevity may not be a random process, but governed by a concerted effort of a distinct subnetwork of genetic players.
Materials and Methods
Ethics statement
Animal experiments were approved by the local ethics committee and performed according to governmental guidelines.
Compilation of the seed set of 60 ‘‘known’’ longevity genes
To obtain a list of genes with known association to longevity, we used the Phenotypes section of the Mouse Genome Informatics (MGI) resource of The Jackson Laboratory (http://www.informatics. jax.org/) [33], the GenAge Model Organisms pages for mouse within
The Human Ageing Genomic Resources (HAGR) [34], and a literature search. The list was compiled in October, 2007.
Generation of the transcriptional network for mouse adipose tissue
Detailed description of these methods is given in Text S1. In summary, we obtained male adipose tissue gene expression data from 4 different mouse F2 crosses [35,36] using Agilent microarrays, and generated a Bayesian network for each cross by integrating genetic and gene expression data [37–39]. The combined network, containing 13088 nodes and 22809 edges, was obtained as the union of all these 4 separate Bayesian networks.
Connectivity of ‘‘known’’ longevity genes within the adipose transcriptional network
To assess the degree of connectivity of the 33 ‘known’ longevity genes that were present in the adipose consensus network, mean shortest paths were computed using Dijkstra’s algorithm [40] for our set of 33 nodes ( = genes) as well as 106randomly selected sets of 33 nodes. Briefly, the algorithm finds the smallest number of edges we have to ‘‘walk’’ in order to ‘‘travel’’ from a source node ( = gene) to another node ( = gene) of interest within the map/ network. The probability of finding random sets of 33 nodes with shorter mean paths than with our set was obtained by counting the number of such eventualities within the randomized sets, and amounted to ap-value of 0.00149, demonstrating that indeed our 33 genes are much more connected within the adipose tissue consensus network than expected by change. Kolmogorov-Smirnov (KS) test was used to further assess whether there were any significant differences between the shortest path distribution within our longevity gene-set and those within each of the 106 random sets. The resultingp-value distribution demonstrated that indeed the longevity genes shortest path distribution is not a normal occurrence in the network.
Generation ofPparghyp/hypandPparg22/2mice
Pparg22/2mice were generated fromPparghyp/hyp [19] mice by
successive matings with transgenic C57Bl/6J mice expressing FLP and Cre recombinases to remove thePparg2specific exon B. All mice studied were backcrossed a minimum of 9 generations to achieve an essentially pure C57Bl/6J background.
Survival
The original survival cohorts consisted of 38 wild type and 24
Pparghyp/hypmale, and 25 wild type and 26Pparg22/2female mice which were maintained on a 12 hour light/dark cycle, fed regular chow, had free access to H2O and received standard animal care. The mice were bred locally and were entered into the survival cohort over the course of 23 weeks for malePparghyp/hypmice, amd 19 months for femalePparg22/2mice. For all groups, deaths were recorded weekly. Mice observed as moribund were euthanized and recorded as dead on that week. All Pparghyp/hyp reached the end-point, but a few Pparg22/2 mice survived at the time of analysis.
Metabolic exploration ofPparg22/2 mice
measure-ments using Ultrasensitive Mouse Insulin ELISA kit (Mercodia, Uppsala, Sweden) and Quantikine Mouse Adiponectin/Acrp30 Immunoassay (R&D systems Inc., Minneapolis, MN), respectively. HOMA index for insulin resistance was calculated from fasting glucose and insulin values [41].
RNA analysis
Pparg1 and Pparg2 gene expression in WAT, BAT, liver and skeletal muscle of Pparghyp/hyp mice was previously reported [19] and is presented for comparative purposes. For Pparg22/2 mice, total RNA was extracted from WAT, BAT, liver and skeletal muscle either with RNeasy for Lipid Tissues Mini Kit (Qiagen, Valencia, CA) or Trizol (Invitrogen, Carlsbad, CA), and reverse transcribed to cDNA using SuperScript II System (Invitrogen) and random hexamer primers. Pparc1 and Pparc2 gene expression
was quantified by qRT-PCR using isoform-specific primers and SYBR Green chemistry on a LightCycler 480 (Roche, Penzberg, Germany).
Statistical analyses
Statistical methods pertaining to the network and other associated analysis of gene expression and gene set data were as detailed above. Kaplan-Meier survival analysis, which allows for censored cases, was used to analyze the survival data in SPSS (version 14). Metabolic and molecular data for Pparghyp/hyp and
Pparg22/2 mice were analyzed using Student’s t-test and are presented as means6s.e.m.
Supporting Information
Figure S1 Pparg1and Pparg2 gene expression in WAT, BAT, liver and skeletal muscle in mouse models with alteredPparglocus. Data are presented relative to mean WAT expression in the wild type (Pparg+/+) for each Pparg isoform. Note the much lower expression levels in liver and muscle. (A) Hypomorphic Pparg
deficient mouse. (B)Pparg2knock-out mouse. Note that only one mouse per group was analyzed.
Found at: doi:10.1371/journal.pgen.1000752.s001 (0.07 MB TIF)
Figure S2 Metabolic phenotype of,2 year oldPparg2knock-out mice. For all tests,n= 4–9 per group. (A) Unaltered body weight and (B) fat content were analyzed by QNMR and are presented in % of fat of total body weight. (C) Intraperitoneal glucose tolerance test. The mean areas under the curve above baseline (AUC) are shown in the inset. (D) HOMA index for insulin resistance, calculated from fasting glucose and insulin values. (E) Fasting insulin and (F) adiponectin levels. None of the comparisons showed statistical significance.
Found at: doi:10.1371/journal.pgen.1000752.s002 (0.06 MB TIF)
Table S1 The seed set of 60 ‘‘known’’ longevity genes in mouse for the identification of a novel transcriptional longevity subnetwork. The gene list was derived from public resources (see Materials and Methods). The overlaps with the consensus white adipose tissue network (33 genes) and the rosiglitazone signature in the mouse WAT (5 genes) are indicated by a plus sign.
Found at: doi:10.1371/journal.pgen.1000752.s003 (0.03 MB XLS)
Table S2 Listing of 742 potentially novel longevity genes. Genes are ranked for the strength of connectivity with the network of the 33 ‘‘known’’ longevity genes within the male mouse adipose tissue transcriptional network of 13,088 genes.
Found at: doi:10.1371/journal.pgen.1000752.s004 (0.12 MB XLS)
Text S1 Supporting Methods.
Found at: doi:10.1371/journal.pgen.1000752.s005 (0.18 MB DOC)
Acknowledgments
We thank the members of the Auwerx and Schadt laboratories for helpful discussions.
Author Contributions
Conceived and designed the experiments: CA SH TAC EES JA. Performed the experiments: CA RD SH AA LP TAC HK. Analyzed the data: CA RD SH. Contributed reagents/materials/analysis tools: HK JZ EES JA. Wrote the paper: CA RD SH EES JA.
References
1. Selman C, Lingard S, Choudhury AI, Batterham RL, Claret M, et al. (2008) Evidence for lifespan extension and delayed age-related biomarkers in insulin receptor substrate 1 null mice. Faseb J 22: 807–818.
2. Taguchi A, Wartschow LM, White MF (2007) Brain IRS2 signaling coordinates life span and nutrient homeostasis. Science 317: 369–372.
3. Kenyon C (2005) The plasticity of aging: insights from long-lived mutants. Cell 120: 449–460.
4. Bishop NA, Guarente L (2007) Genetic links between diet and lifespan: shared mechanisms from yeast to humans. Nat Rev Genet 8: 835–844.
5. Wolf G (2006) Calorie restriction increases life span: a molecular mechanism. Nutr Rev 64: 89–92.
6. Conti B, Sanchez-Alavez M, Winsky-Sommerer R, Morale MC, Lucero J, et al. (2006) Transgenic mice with a reduced core body temperature have an increased life span. Science 314: 825–828.
7. Blu¨her M, Kahn BB, Kahn CR (2003) Extended longevity in mice lacking the insulin receptor in adipose tissue. Science 299: 572–574.
8. Moitra J, Mason MM, Olive M, Krylov D, Gavrilova O, et al. (1998) Life without white fat: a transgenic mouse. Genes Dev 12: 3168–3181.
9. Knouff C, Auwerx J (2004) Peroxisome proliferator-activated receptor-gamma calls for activation in moderation: lessons from genetics and pharmacology. Endocr Rev 25: 899–918.
10. Chawla A, Schwarz EJ, Dimaculangan DD, Lazar MA (1994) Peroxisome proliferator-activated receptor (PPAR) gamma: adipose- predominant expression and induction early in adipocyte differentiation. Endocrinology 135: 798–800. 11. Chen Y, Zhu J, Lum PY, Yang X, Pinto S, et al. (2008) Variations in DNA
elucidate molecular networks that cause disease. Nature 452: 429–435. 12. Tsukiyama-Kohara K, Poulin F, Kohara M, DeMaria CT, Cheng A, et al.
(2001) Adipose tissue reduction in mice lacking the translational inhibitor 4E-BP1. Nat Med 7: 1128–1132.
13. Lin TA, Kong X, Haystead TA, Pause A, Belsham G, et al. (1994) PHAS-I as a link between mitogen-activated protein kinase and translation initiation. Science 266: 653–656.
14. Zid BM, Rogers AN, Katewa SD, Vargas MA, Kolipinski MC, et al. (2009) 4E-BP extends lifespan upon dietary restriction by enhancing mitochondrial activity in Drosophila. Cell 139: 149–160.
15. Armengol G, Rojo F, Castellvi J, Iglesias C, Cuatrecasas M, et al. (2007) 4E-binding protein 1: a key molecular ‘‘funnel factor’’ in human cancer with clinical implications. Cancer Res 67: 7551–7555.
16. Chung JH, Seo AY, Chung SW, Kim MK, Leeuwenburgh C, et al. (2008) Molecular mechanism of PPAR in the regulation of age-related inflammation. Ageing Res Rev 7: 126–136.
17. Erol A (2007) The Functions of PPARs in Aging and Longevity. PPAR Res 2007: 39654.
18. Luo W, Cao J, Li J, He W (2008) Adipose tissue-specific PPARgamma deficiency increases resistance to oxidative stress. Exp Gerontol 43: 154–163.
19. Koutnikova H, Cock TA, Watanabe M, Houten SM, Champy MF, et al. (2003) Compensation by the muscle limits the metabolic consequences of lipodystrophy in PPAR gamma hypomorphic mice. Proc Natl Acad Sci U S A 100: 14457–14462.
20. Jones JR, Barrick C, Kim KA, Lindner J, Blondeau B, et al. (2005) Deletion of PPARgamma in adipose tissues of mice protects against high fat diet-induced obesity and insulin resistance. Proc Natl Acad Sci U S A 102: 6207–6212. 21. He W, Barak Y, Hevener A, Olson P, Liao D, et al. (2003) Adipose-specific
peroxisome proliferator-activated receptor gamma knockout causes insulin resistance in fat and liver but not in muscle. Proc Natl Acad Sci U S A 100: 15712–15717.
23. Zhang J, Fu M, Cui T, Xiong C, Xu K, et al. (2004) Selective disruption of PPARgamma 2 impairs the development of adipose tissue and insulin sensitivity. Proc Natl Acad Sci U S A 101: 10703–10708.
24. Miard S, Dombrowski L, Carter S, Boivin L, Picard F (2009) Aging alters PPARgamma in rodent and human adipose tissue by modulating the balance in steroid receptor coactivator-1. Aging Cell 8: 449–459.
25. Heikkinen S, Argmann C, Feige JN, Koutnikova H, Champy MF, et al. (2009) The Pro12Ala PPARgamma2 variant determines metabolism at the gene-environment interface. Cell Metab 9: 88–98.
26. Altshuler D, Hirschhorn JN, Klannemark M, Lindgren CM, Vohl MC, et al. (2000) The common PPARgamma Pro12Ala polymorphism is associated with decreased risk of type 2 diabetes. Nat Genet 26: 76–80.
27. Deeb SS, Fajas L, Nemoto M, Pihlajama¨ki J, Mykka¨nen L, et al. (1998) A Pro12Ala substitution in PPARgamma2 associated with decreased receptor activity, lower body mass index and improved insulin sensitivity. Nat Genet 20: 284–287.
28. Barbieri M, Bonafe M, Rizzo MR, Ragno E, Olivieri F, et al. (2004) Gender specific association of genetic variation in peroxisome proliferator-activated receptor (PPAR)gamma-2 with longevity. Exp Gerontol 39: 1095–1100. 29. Lehmann JM, Moore LB, Smith-Oliver TA, Wilkison WO, Willson TM, et al.
(1995) An antidiabetic thiazolidinedione is a high affinity ligand for peroxisome proliferator-activated receptor gamma (PPAR gamma). J Biol Chem 270: 12953–12956.
30. Lebovitz HE, Dole JF, Patwardhan R, Rappaport EB, Freed MI (2001) Rosiglitazone monotherapy is effective in patients with type 2 diabetes. J Clin Endocrinol Metab 86: 280–288.
31. Smith SA, Porter LE, Biswas N, Freed MI (2004) Rosiglitazone, but not glyburide, reduces circulating proinsulin and the proinsulin: insulin ratio in type 2 diabetes. J Clin Endocrinol Metab 89: 6048–6053.
32. Barbieri M, Rizzo MR, Manzella D, Grella R, Ragno E, et al. (2003) Glucose regulation and oxidative stress in healthy centenarians. Exp Gerontol 38: 137–143.
33. Bogue MA, Grubb SC, Maddatu TP, Bult CJ (2007) Mouse Phenome Database (MPD). Nucleic Acids Res 35: D643–649.
34. de Magalhaes JP, Costa J, Toussaint O (2005) HAGR: the Human Ageing Genomic Resources. Nucleic Acids Res 33: D537–543.
35. Schadt EE, Molony C, Chudin E, Hao K, Yang X, et al. (2008) Mapping the genetic architecture of gene expression in human liver. PLoS Biol 6: e107. doi:10.1371/journal.pbio.0060107.
36. Wang S, Yehya N, Schadt EE, Wang H, Drake TA, et al. (2006) Genetic and genomic analysis of a fat mass trait with complex inheritance reveals marked sex specificity. PLoS Genet 2: e15. doi:10.1371/journal.pgen.0020015.
37. Zhu J, Wiener MC, Zhang C, Fridman A, Minch E, et al. (2007) Increasing the power to detect causal associations by combining genotypic and expression data in segregating populations. PLoS Comput Biol 3: e69. doi:10.1371/journal. pcbi.0030069.
38. Zhu J, Lum PY, Lamb J, GuhaThakurta D, Edwards SW, et al. (2004) An integrative genomics approach to the reconstruction of gene networks in segregating populations. Cytogenet Genome Res 105: 363–374.
39. Schadt EE, Lamb J, Yang X, Zhu J, Edwards S, et al. (2005) An integrative genomics approach to infer causal associations between gene expression and disease. Nat Genet 37: 710–717.
40. Dijkstra EW (1959) A note on two problems in connexion with graphs. Numerische Mathematlk 1: 269–271.